David Archibald writes to tell me that the IMF has hit “rock bottom” and may go lower still. Watching the IMF is a good indicator of the activity of the Sun’s internal magnetic dynamo. Looking at this graph from Archibald, and Lief’s graph below one could conclude that the sun’s inner magnetics are quieter than any time in the last 90+ years.
First a bit of a primer to help our readers understand what the IMF is.
This is from SpaceWeather.com
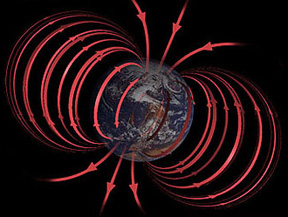
During solar minimum the Sun’s magnetic field, like Earth’s, resembles that of an iron bar magnet, with great closed loops near the equator and open field lines near the poles. Scientists call such a field a “dipole.” The Sun’s dipolar field is about as strong as a refrigerator magnet, or 50 gauss. Earth’s magnetic field is 100 times weaker.

During the years around solar maximum (2000 and 2001 are good examples) spots pepper the face of the Sun. Sunspots are places where intense magnetic loops — hundreds of times stronger than the ambient dipole field — poke through the photosphere. Sunspot magnetic fields overwhelm the underlying dipole; as a result, the Sun’s magnetic field near the surface of the star becomes tangled and complicated.
The Sun’s magnetic field isn’t confined to the immediate vicinity of our star. The solar wind carries it throughout the solar system. Out among the planets we call the Sun’s magnetic field the “Interplanetary Magnetic Field” or “IMF.” Because the Sun rotates (once every 27 days) the IMF has a spiral shape — named the “Parker spiral” after the scientist who first described it.
Here is another view of the Parker Spiral. Our own Leif Svalgaard had a hand in this I believe:

Guest Post by David Archibald
There has been one view that the Interplanetary Magnetic Field (IMF) has a floor of 4 nanoTeslas below which it cannot go. The value of the last 27 day average was 3.3, as shown in the graph below:

So far in 2009 there have been individual days as low as 1.8 nanoTeslas, so there may be no physical reason why a monthly average close to 2 is not possible. It seems that the Sun’s “magneticness” drives everything, and in that case the IMF data suggests that solar activity is not even feeling bottom yet.
Leif has a plot of the IMF all the way back to 1840:

Click for larger image. Source: http://www.leif.org/research/Erl75.png
From Leif’s graph, it appears that the last time the IMF got this low was in 1913 during that lull in solar activity.
pyromancer76 (13:56:42) :
It seems to me that given “the remarkable, and unprecedented, never before seen period of abnormally high AVERAGE sunspot numbers” we should be basking in something like the Medieval Warm Period. I wish we were. Why aren’t we?
Possibly because we are not so basking.
http://www.leif.org/EOS/2009GL038004.pdf
“A comparison with sunspot and neutron records confirms that ice core 10Be reflects solar Schwabe cycle variations, and continued 10Be variability suggests cyclic solar activity throughout the Maunder and Spoerer grand solar activity minima. Recent 10Be values are low; however, they do not indicate unusually high recent solar activity compared to the last 600 years.”
and neither a lack of solar activity [as reflected in cosmic rays] during the Spoerer and Maunder Minima.
pyromancer76 (13:56:42) :
It seems to me that given “the remarkable, and unprecedented, never before seen period of abnormally high AVERAGE sunspot numbers” we should be basking in something like the Medieval Warm Period. I wish we were. Why aren’t we?
Maybe not “never before” but certainly in the last 400 years, but we are on the downslope now and wont recover until 2130. Why Leif would prefer to look at proxy records rather than the real thing just baffles me.
In regard to my graph, the simplest method is to look at the purple angular momentum peaks in the background, when they are on an upward trend so is solar activity. The only time that changes is when we have grand minima signified by the green and orange dots.
http://users.beagle.com.au/geoffsharp/200predsm.jpg