David Archibald writes to tell me that the IMF has hit “rock bottom” and may go lower still. Watching the IMF is a good indicator of the activity of the Sun’s internal magnetic dynamo. Looking at this graph from Archibald, and Lief’s graph below one could conclude that the sun’s inner magnetics are quieter than any time in the last 90+ years.
First a bit of a primer to help our readers understand what the IMF is.
This is from SpaceWeather.com
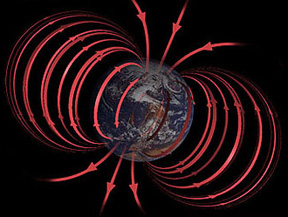
During solar minimum the Sun’s magnetic field, like Earth’s, resembles that of an iron bar magnet, with great closed loops near the equator and open field lines near the poles. Scientists call such a field a “dipole.” The Sun’s dipolar field is about as strong as a refrigerator magnet, or 50 gauss. Earth’s magnetic field is 100 times weaker.

During the years around solar maximum (2000 and 2001 are good examples) spots pepper the face of the Sun. Sunspots are places where intense magnetic loops — hundreds of times stronger than the ambient dipole field — poke through the photosphere. Sunspot magnetic fields overwhelm the underlying dipole; as a result, the Sun’s magnetic field near the surface of the star becomes tangled and complicated.
The Sun’s magnetic field isn’t confined to the immediate vicinity of our star. The solar wind carries it throughout the solar system. Out among the planets we call the Sun’s magnetic field the “Interplanetary Magnetic Field” or “IMF.” Because the Sun rotates (once every 27 days) the IMF has a spiral shape — named the “Parker spiral” after the scientist who first described it.
Here is another view of the Parker Spiral. Our own Leif Svalgaard had a hand in this I believe:

Guest Post by David Archibald
There has been one view that the Interplanetary Magnetic Field (IMF) has a floor of 4 nanoTeslas below which it cannot go. The value of the last 27 day average was 3.3, as shown in the graph below:

So far in 2009 there have been individual days as low as 1.8 nanoTeslas, so there may be no physical reason why a monthly average close to 2 is not possible. It seems that the Sun’s “magneticness” drives everything, and in that case the IMF data suggests that solar activity is not even feeling bottom yet.
Leif has a plot of the IMF all the way back to 1840:

Click for larger image. Source: http://www.leif.org/research/Erl75.png
From Leif’s graph, it appears that the last time the IMF got this low was in 1913 during that lull in solar activity.
Dave Middleton (19:10:04) :
Well, Dr. Svalgaard…I’m just going to have to figure out a way to organize the data in such a way to convince you that my correlation is reasonable.
I don’t think organizing the data any other [honest] way will show a better correlation than is in the data to begin with and http://www.leif.org/research/Cycle%20Length%20Temperature%20Correlation.pdf shows that there isn’t any.
OK, here is a sales pitch for deterministic chaos.
In contrast to colloquial chaos, which from definition is related to randomness and cannot be studied further, deterministic chaos happens when the underlying equations controlling a physical system are known, but they are so many and disparate that it is not possible to have one to one solutions, as we are used when solving dynamical problems.
It means that the push and pull from different known dynamics is such that the outcome of the process under study cannot be deduced with the usual means of correlations or not.
Let me give an example: Take a long flat beach. The waves come with a certain predictable frequency and height. After some observation the frequency and height are tabulated. Suddenly the pattern is broken by the wake of a large oil transport. With some calculational effort and knowledge of coordinates and velocity etc of the tanker, the change in the pattern could be predicted. If a second tanker goes by at the same time, predictability fades.
In the weather/climate observations there are many such inputs: PDO, ENSO, all the ocean currents, all the air currents transferring enormous amounts of heat/humidity around and out and on top of this small inputs from sun behavior, both energy and electromagnetic, not to forget volcanics. Svenmark’s cosmic rays suggestion is one input in this soup. To expect a one to one correlation with sunspot cycles is hopeless, imo. Only using the tools of chaotic theory one might come into some order in this, again imo, and it will not be the order people expect.
Now I do not know about temperatures and sun cycles, but I do know about tree rings and sun cycles. That is where sun cycles were discovered, in the change of thickness of tree rings. Change of thickness means climate change, the whole caboodle, from rains to available CO2 to temperature to what not. But an overall correlation exists.
anna v (22:48:17) “[…] deterministic chaos happens when the underlying equations controlling a physical system are known, but they are so many and disparate […]”
Even a single, simple equation can exhibit deterministic chaos – example: The logistic equation.
…but my intention in commenting is not to send people down fruitless paths.
You raise some interesting points.
As for complex elements in the dynamics – that might (in many cases) come later… i.e. it will be easier to study small signals after we master some of the (remaining) more-sizable signals. I believe there are still some (relatively) easy hits left to be had in climate research…
I am a SATCOMM operator for the Marine Corps. I probably know the answer, but would like a second opinion. Would less sun spots or IMF mean that as a Ground Mobile Forces operator see higher gains with less out put power(amplification) in ranges of SHF an EHF frequencies? I would think that would be yes, because usually any clearing of interference/noise is always beneficial for the resource constrained DSCS III Satellites, but not to worry DSCS III is being phased out as of last spring/summer with much more heftier WGF(Wide Gap-band Filler) Sat’s state of the art stuff, which are now able to Tx & Rx in the Ka and Ku bands, but the cool thing is that let’s say I Tx in X-band to you but you need Ka the (WGF) will automatically make the conversion so that both Ground Sat Terminals can communicate in lag free Full Duplex. I think that is the best and darn “awesomest” investment the military has made thus far.
Looking forward to your answer to confirm my knowledge on this subject.
Although I do not know everything about Solar influences on Sat’s, but I do spend my working increasing knowledge on how the Sat it self works in relation to my ground terminals. Simper Fi
George E. Smith (18:43:48) :
The avbove numbers were pinched fair and square from page 178 from Dr Willie Soon’s book; The Maunder Minimum and the Variable Sun-Earth Connection.
Rather ironic page number, but I have also noticed the overall trend in sunspot numbers and climate as you have. The overall trend is what is important not trying to match individual sunspot records with climate.
Here is a 200 year prediction of solar sunspot activity, temperature trends should loosely follow it:
http://users.beagle.com.au/geoffsharp/200predsm.jpg
Can anyone tell me why it well into the Month of June here in okinawa, Japan and Since the Beginning of May we have had the equivalent to 6 full 24 hour periods of cloud/rain/cool free days = Awesome sunshine, a bit unusual for this time of year. I always look forward to summer time Temps otherwise I would never leave house I would rather it be 85Deg F or more outside which makes going to beach and snorkeling around the beautiful coral all the more enjoyable. Otherwise it would be to cool for comfort I am Tropical person I hate,HATE cold weather. 80-98 deg is quite comfortable to me, I could always take more clothes off 😉 , but I could never put on enough layers of clothing to get warm.
Leif Svalgaard (21:45:17) :
The IMF changes sign every week or two [and sometimes from minute to minute] as the heliospheric fields sweeps over the Earth. My plot shows the magnitude of the IMF.
Thank you for that.
So there is NO 22 year magnitude cycle. Just the usual 11 year variation in absolute field strength the sign of which changes at the whim of the solar wind.
the Cern CLOUD experiment proposal. Interesting background stuff
forgot the link!
http://cdsweb.cern.ch/record/444592/files/cer-2195245.pdf?version=1
“” anna v (22:48:17) : …predictability fades.
In the weather/climate observations there are many such inputs: PDO, ENSO, all the ocean currents, all the air currents transferring enormous amounts of heat/humidity around and out and on top of this small inputs from sun behavior, both energy and electromagnetic, not to forget volcanics. Svenmark’s cosmic rays suggestion is one input in this soup.””
I think some are expecting perfect correlation. I think only God can understand the complexities and see perfect correlation. The rest of us get only glimpses.
Our human limitations not only keep us from grasping all these complexities but also trouble us in accepting new ideas that can be part of the explanation of these complexities, like Henrik Svensmark work.
Svensmark got the two sticks to come together
I just watched the Svensmark videos. Truly excellent. You can’t but be impressed by his calm, methodical and patient work. How different to some other scientists we could mention! Is his theory right? I don’t know, but I would say it’s far more likely to be right than AGW.
.
As I think someone else mentioned, it would be great if Svensmark could be persuaded to write a piece for WUWT. I would particularly like to know what is the current state of his research. Also, it strikes me that the current state of the sun may provide a critical test of his theories.
Chris
One could not expect temperatures to exactly follow solar activity unless one expected the response in the change of temperatures to be immediate and absolute to that change in solar activity. It takes a long time to warm the oceans up and there are many other factors at work such as currents and changes in atmospheric composition. The trend in solar activity since the Dalton minimum has been up and the trend in temperatures has been up. This doesn’t mean that the two have to be connected. A mechanism hasn’t been identified and I no more believe in an unidentified mechanism then I do in the tooth fairy but I still have to explain how the money got under my pillow. If the current predictions for solar cycle 25 are accurate, yes a big if, then we are in for a very quiet solar cycle. We have about a decade to figure out if we are looking at one of the worst food disasters the world has ever experienced coming up with that cycle.
Leif Svalgaard (13:10:10) :
from referenced document (bill (02:39:48)) CERN shows this cycle length and temperature plot:
http://img242.imageshack.us/img242/5739/cyclelngthcftemp.jpg
This shows amazing correlation between temp and length.
BUT the plot does not agree with Leif’s
BUT the plot does not even agree with cycles shown a couple of Figs later.
Also there are too many points plotted (perhaps min to min and max to max?)
CERN seem to have accepted other’s reports on faith alone!
Gene Nemetz;-))
Thanks a lot for that, really appreciated, that’s a pint of finest virtual ale for you my lad!
smallz79 (01:16:37),
Amateur radio satellites were doing such conversions decades ago. The uplink/downlink bands were different. Although they were fixed.
From the design point of view that is the easiest way to design because the Tx/Rx filters don’t have to be near as sharp. Which also means things like temperature compensation can be avoided.
I’m mostly a DC guy myself i.e 2 to 30 MHz. Always looked forward to sunspot peak skip. However, low spot years were better for security. Part of the romance for me was hoping the next spot cycle was even stronger.
Which is why I love the Solar-Terrestrial Data on the sidebar.
Donald Rumsfeld was heavily criticized for his statement that “there are things we know we know, there are things we know we don’t know and there are things we don’t know we don’t know.”
Nevertheless, this is an aphorism that every scientist and engineer should hang on his wall.
It is also a concept that Lief would be well advised to ponder.
Mr excellency moderator – I tried to do italics, but nothing showed up. Pls delete first post. I won’t do it again!
jlc
to do italics here use the letter i between the less than and greater than signs. to finish italics use /i again between the less than and greater than signs.
jlc (07:32:57) :
Donald Rumsfeld was heavily criticized for his statement that “there are things we know we know, there are things we know we don’t know and there are things we don’t know we don’t know.”
It is also a concept that Lief would be well advised to ponder.
There is one element missing from Rumsfeld’s aphorism: “the things we don’t know we know”. I am referring to people making strong statements based on them not knowing what is already known.
Rumsfeld’s problem was he didn’t follow his own advice. “I doubt 6 months” meant there was a lot he didn’t know he didn’t know, and apparently didn’t care to find out.
Leif Svalgaard (21:45:17)
“The eddy currents are formed high above the earth….”
Then how does high solar activity bring down power grids due to current surges?
Also thanks for the info?
Leif Svalgaard (21:45:17)
“The eddy currents are formed high above the earth….”
Then how does high solar activity bring down power grids due to current surges?
Here is how it works: http://www.phy6.org/Education/Intro.html
see especially section 30, but the whole thing is worth a read.
Maybe lowest since the 1810s.
SteveSadlov (00:20:20) :
Maybe lowest since the 1810s.
Not likely, IMF is now what is was in 1901-1902 and will not go lower now that SC24 has started and new solar magnetic flux is emerging.
George E. Smith (18:43), like you I have thought that “seven cycles of the highest average sunspot counts of all time” must be related to those temperature charts that show (or used to show) the “average global temperature” heading north. And, like you, I love the fitness of cycles when they fit.
But then there is the information that the Arctic was more free of ice in the 1930s than during our warmth in the 1990s and early 2000s; we had a cool spell from ~1940-1970 even though the spectacular numbers you include suggest that that time period should have been hotter; the increasing warmth of global temperatures are suspect because surface stations have not been recording temperature accurately and the inaccuracy has almost without exception moved temp in the warmer direction; the statement (from fallible memory) that the temperature in the warm period of the second half twentieth century (1970-1998?) was not as warm at that in the first half. I can’t connect your amazing (I find them amazing) collection of sunspot numbers from #16 in 1928 to #23 in our century with the ups and downs of global temperatures, even with a lag time. (I also keep trying with Geoff Sharp’s chart of angular momentum, but my eyes cannot see a predictable pattern.)
I keep trying but I have difficulty seeing a nice, tight fit. Without the sun we would not be warm, yes, but there is so much variability in the way our oceans, atmosphere (especially the long, slow waves of each), winds, and plate tectonics/volcanic activity distribute/affect that energy, plus Earth’s travel through space with the effects of cosmic rays (Be10 evidence) on cloud cover and whatever else, that I can’t find suspots telling us enough by themselves.
It seems to me that given “the remarkable, and unprecedented, never before seen period of abnormally high AVERAGE sunspot numbers” we should be basking in something like the Medieval Warm Period. I wish we were. Why aren’t we?