David Archibald writes to tell me that the IMF has hit “rock bottom” and may go lower still. Watching the IMF is a good indicator of the activity of the Sun’s internal magnetic dynamo. Looking at this graph from Archibald, and Lief’s graph below one could conclude that the sun’s inner magnetics are quieter than any time in the last 90+ years.
First a bit of a primer to help our readers understand what the IMF is.
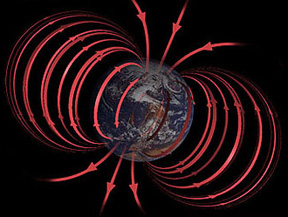
This is from SpaceWeather.com
During solar minimum the Sun’s magnetic field, like Earth’s, resembles that of an iron bar magnet, with great closed loops near the equator and open field lines near the poles. Scientists call such a field a “dipole.” The Sun’s dipolar field is about as strong as a refrigerator magnet, or 50 gauss. Earth’s magnetic field is 100 times weaker.

During the years around solar maximum (2000 and 2001 are good examples) spots pepper the face of the Sun. Sunspots are places where intense magnetic loops — hundreds of times stronger than the ambient dipole field — poke through the photosphere. Sunspot magnetic fields overwhelm the underlying dipole; as a result, the Sun’s magnetic field near the surface of the star becomes tangled and complicated.
The Sun’s magnetic field isn’t confined to the immediate vicinity of our star. The solar wind carries it throughout the solar system. Out among the planets we call the Sun’s magnetic field the “Interplanetary Magnetic Field” or “IMF.” Because the Sun rotates (once every 27 days) the IMF has a spiral shape — named the “Parker spiral” after the scientist who first described it.
Here is another view of the Parker Spiral. Our own Leif Svalgaard had a hand in this I believe:

Guest Post by David Archibald
There has been one view that the Interplanetary Magnetic Field (IMF) has a floor of 4 nanoTeslas below which it cannot go. The value of the last 27 day average was 3.3, as shown in the graph below:

So far in 2009 there have been individual days as low as 1.8 nanoTeslas, so there may be no physical reason why a monthly average close to 2 is not possible. It seems that the Sun’s “magneticness” drives everything, and in that case the IMF data suggests that solar activity is not even feeling bottom yet.
Leif has a plot of the IMF all the way back to 1840:

Click for larger image. Source: http://www.leif.org/research/Erl75.png
From Leif’s graph, it appears that the last time the IMF got this low was in 1913 during that lull in solar activity.
George E. Smith (13:56:06) :
I’m not going to accept that everything imaginable exists; so we should look for it. What do we gain if we discover any sort of life elsewhere. OK go and look if you are curious; just don’t charge me for the tab.
But, but, but George. With so many stars in the universe, there must be intelligent life somewhere.
Dave Middleton (12:04:38) :
Like all good theories, Svensmark’s theory is evolving.
But at least it’s progressing according to sound scientific principles.
I suspect that Svensmark’s theory will prove to be valid, but that it won’t be the single factor driving climate. I’m also inclined to think that climate is driven by a number of irregular cyclical factors, and that it may be possible to eventually predict what the approximate effect may be at different points of convergence, but that it will never be possible to place those points on a timeline.
[snip – way waaayyy off topic – this thread is about solar, not politics]
Svensmark’s work may have merit but Corbyn’s has none: because he will not tell us what it is.
He may be successful commercially but we have no idea how he makes his forecast. He claims it is the sun: for all we know it might be a dart board.
If he genuinely does have knowledge about the sun we do not he will not be the first to conceal technical data to his commercial advantage: known in IP law as Secret Process. On the other hand many an ?honest? quacksalver has sold the True Triacle of the Ancients. The very best is aged in casks beneath a pyramid I understand. Or not as the case might or might not be.
Kindest Regards
Dave Middleton (13:09:42) :
The shorter periods that remain are dominated by the 22-year period the …. We suggest that this period may be related to the solar magnetic cycle. The low frequency data show a major dip centered around the period 1905-1910. These results should be considered in any analysis of global marine temperature for trends.
Show me the 22 year cycle in temperature please. Note that it has to be 2*the solar cycle exactly.
http://img162.imageshack.us/img162/84/hadcrutnhshlsgiscetssna.jpg
there is a peak somewhere between 20.07 and 21.3 years and between 22.7 and 24.4 years in some FFTs There is no peak occuring between 21.3 and 22.7 years
Using info from Leif’s pages
http://www.leif.org/research/Consensus%20IMF%20B.pdf
The magnetic flux is on a 11 year cycle (although one could GUESS at a 67 year cycle as well – no where near enough data to prove this!)
How does the 11 year cycle generate a 22 year cycle? If the flux was going from high negative to high positive on an 11 year cycle then perhaps one could imagine a 22 year low flux to high flux magnitude cycle.
But it is changing low to high only (no sign change)
bill (16:05:47) :
for information
Temperature vs TSI
Temperature vs CO2
At least temperature increases with CO2 whereas Temperature is not related to TSI.
I realise that plotting 2 increasing variables against each other will show correlation. But at least there is correlation and not randomness!
You have all in the opposite way… CO2 increases with increases in oceans and subsurface materials of ground temperatures. Do you know the dry sand and dry clay absorb CO2 during nighttime and release it when get warmer?
Clever! had to cheat and look at page source to see how you did that.
Dave Middleton (12:37:43) :
I agree that you can’t claim proof of causality just based on a close correlation of two functions
The problem is that the correlation is not good, as I showed.
David Archibald (14:49:21) :
Thanks for pointing out that the floor is broken.
See above how there is a significant problem with the OMNI data.
(Friis-Christensen and Lassen theory) mean that significant cooling is certain.
Except that the F-L theory is junk as has been shown repeatedly, even on this very thread.
Gilbert (16:37:58) :
[snip – way waaayyy off topic – this thread is about solar, not politics]
Sorry. Meant to suggest a specific thread, not immediate discussion. Will try to do better.
Hmmm 191x is interesting year since that is when Lassen last erupted along with a couple of other volcanoes in Latin America and else where… of course we all know there couldn’t possibly be any relationship between the sun and the planets (and this planets volcanos…)
OOOOhhh! The angular momentum Shiny Thing!! 😎
Just really hoping we don’t get a Big One… Chaiten & Redoubt are enough already…
Adolfo Giurfa (08:43:11) : Anyway we are broke already 🙂
We can’t be broke, the credit card is still working !! (At least the 2 year and 5 year bonds sold well… 10 year, not so much…)
George E. Smith (09:00:19) : Well some of us are living in a country, that once was the greatest survival experiment ever conducted on earth; and that country is now deliberately committing national suicide; both economically, and philosophically; and instead of shrinking in horror at the prospect, everyone is out there cheering the destroyers on.
Well, you can be upset about it our you can buy stock in the cheer leading costume sales company and use the money to take care of you and yours… I came from a poor background. I was stunned when a “rich kid” in college said this, but in retrospect, I think it has some value. He said “Don’t complain about the stupid, make money off of them.” It offended my dirt poor Joe Sixpack farm town egalitarian ethos.
While he was arrogant about it; and I’m reluctant about it; it is sound advice for this kind of thing. So you can’t change Obama and you can’t stop Boxer, and no body can ever give Pelosi a clue (and if she had one she wouldn’t know what to do with it)… at least you can make some money off of them. They hand China a free pass? They give India a free pass? They pump $1B a year of subsidy (sorry, “Foreign Aid”) into Egypt and Israel each year? Own China, India, etc. stocks. TEVA is an Israeli drug company. CEL is their cell phones. TKC is the Turkish one. VOD Vodaphone has a big presence in the 3rd world. So you bet on the ones who don’t have the stupids tax.
DISCLOSURE: I own CEL and I’m waiting for an entry in TEVA. I’m also looking at the Islamic country funds and stocks, but haven’t reached any conclusions yet.
No there isn’t any intelligent life anywhere in this universe.
Reminds me of that old saw: “What do you think of intelligent life in the universe? Reply: I think it would be a very good idea!”
“”” bill (16:43:32) :
Dave Middleton (13:09:42) :
The shorter periods that remain are dominated by the 22-year period the …. We suggest that this period may be related to the solar magnetic cycle. The low frequency data show a major dip centered around the period 1905-1910. These results should be considered in any analysis of global marine temperature for trends.
Show me the 22 year cycle in temperature please. Note that it has to be 2*the solar cycle exactly.
http://img162.imageshack.us/img162/84/hadcrutnhshlsgiscetssna.jpg
there is a peak somewhere between 20.07 and 21.3 years and between 22.7 and 24.4 years in some FFTs There is no peak occuring between 21.3 and 22.7 years
Using info from Leif’s pages
http://www.leif.org/research/Consensus%20IMF%20B.pdf
The magnetic flux is on a 11 year cycle (although one could GUESS at a 67 year cycle as well – no where near enough data to prove this!)
How does the 11 year cycle generate a 22 year cycle? If the flux was going from high negative to high positive on an 11 year cycle then perhaps one could imagine a 22 year low flux to high flux magnitude cycle.
But it is changing low to high only (no sign change) “””
The 22 year cycle is just two of the 11 year cycles. The polarity reverses between 11 year cycles. That’s one of the ways you can tell a cycle 24 spot from a cycle 23 spot; they have opposite magnetic polarities.
Dave Middleton (11:01:22) : It’s not “chilling” enough to bump natural gas prices…Futures are down $0.36…But spot prices are up a bit…
So…I guess the natural gas market shares the view that space weather is not climate…;)
“We” learned a new trick that broke tight shale gas free. Now we have a glut of gas (and likely will for several years…). It’s not about demand, it’s about supply, and right now we have a gigantic surge in new nat gas supply…
“”” Gilbert (16:28:02) :
George E. Smith (13:56:06) :
I’m not going to accept that everything imaginable exists; so we should look for it. What do we gain if we discover any sort of life elsewhere. OK go and look if you are curious; just don’t charge me for the tab.
But, but, but George. With so many stars in the universe, there must be intelligent life somewhere. “””
Well if you say so Gilbert.
Now quickly; give me a list of the ten most important things; about which we have not one bit of evidence peer reviewed or not, but which simply must exist, because the Universe is so vast.
I can give you a list of things about which we have oodles, and oodles of information, similar to the information we have on intelligence; yet none of which exist anywhere in the universe; not a single one.
How about: points, lines, surfaces, circles, ellipses, spheres, triangles, squares, parabolas, hyperbolas. There’s a start.
We made them all up in our heads; they are a total fiction; just like intelligent life out there in the universe.
George
George E. Smith (17:35:51) :
The 22 year cycle is just two of the 11 year cycles. The polarity reverses between 11 year cycles. That’s one of the ways you can tell a cycle 24 spot from a cycle 23 spot; they have opposite magnetic polarities.
Leif’s plot of IMF shows no reversal. The sun field does reverse at 22 year cycle –
http://sun.stanford.edu/~xudong/AGU2008/AGU2008_Poster.pdf
I am now confused but perhaps Leif could explain?
George E. Smith (17:46:04) :
“”” Gilbert (16:28:02) :
George E. Smith (13:56:06) :
I’m not going to accept that everything imaginable exists; so we should look for it. What do we gain if we discover any sort of life elsewhere. OK go and look if you are curious; just don’t charge me for the tab.
But, but, but George. With so many stars in the universe, there must be intelligent life somewhere. “””
Well if you say so Gilbert.
Sorry. I’m still learning the lingo and my “BS off” didn’t come thru with the comment.
Whale of response tho!!!
1913… so that would be near the end of the Damon Minimum?
DR (09:39:53)
Thanks for posting that link to the CLOUD experiment progress report. It was great to see the main chamber in construction. This is what I call real climate science. I was shocked recently to read of a paper claiming to have disproved Svensmark’s theory using computer modeling. The publication of such computer model based work while an actual physical experiment is in construction raises difficult questions.
I find it telling that the foreword in Svensmark and Calder’s book The Chilling Stars was written by Eugene Parker. I seem to recall the consensus opposition to Parker’s solar wind theory was dealt a blow by physical expeimentation.
“”” bill (11:47:03) :
Mike Abbott (11:15:14) :
I’ve looked for the 11 year solar cycle. I cannot find it. Someone show me the 11 year solar cycle in the temperature record please!
http://img162.imageshack.us/img162/84/hadcrutnhshlsgiscetssna.jpg
I guess that means Svensmark is not correct then! “””
In what way, would the lack of an 11 year cycle prove that “Svensmark is incorrect. ” ? How about if there was a 22 year cycle; since the sunspot polarity reverses each 11 years, but the earth’s field doesn’t, then the combined field might show an assymmetry which could show up in the cosmic ray distribution on earth, by steering cosmic rays towards the magnetic poles which are regions of low moisture content, and away from equatorial regions which are regions of high cloud forming moisture content. I’m not saying there is a perceivable 22 year temperature record; well I don’t believe there is a credible temperature record going back before the Argo buoys were put out in the ocean.
But back to Svensmark. In my view, the strongest evidence to support his idea; other than the obvious that cosmic rays do enhance cloud nucleation; is the long term record of sunspot cycle peak counts.
lets start with sunspot cycle #5, which is the first peakduring the Dalton minimum (1795-1823) around 1802 at a count of about 45, then to about the same 45 for #6 and then 70, 140, 125, 95, 140, 65, 85, 65, 100, 80, this brings us to about 1928 and cycle 16. So now here’s what happens from #16 in 1928 to #23 (?) during which time frame the earth arguably warmed up; hence the great big global warming scam. continuing from #16:-
80, 115, 150, 190, 110, 155, 160, > 125 at the recent cycle #23 for which I have no number.
The avbove numbers were pinched fair and square from page 178 from Dr Willie Soon’s book; The Maunder Minimum and the Variable Sun-Earth Connection. They may suffer from my errors in interpolating off the not very accurate style graph.
So that run of peaks from cycle 17 to cycle 23, from 1937ish to 200Xish with counts of 115, 150, 190, 110, 155, 160, >125 is a seven cycle long record of the highest average peak numbers in the entire recorded history of sunspots. The 190 peak (#19) of the IGY in 1957/8 is the highest sun spot peak of all recorded history, and before #18, no previous peak ever exceeded 150, and only eight previous peaks ever exceeded 100.
So we had seven peaks in a row above 100, with no previous period having more than 4 in a row.
So from 1937 to the peak of cycle 23 (wherever that ended up) we have had a remarkable, and unprecedented, never before seen period of abnormally high AVERAGE sunspot numbers, and solar activity.
Sorry for all the alarmist superlatives lingo there.
But now does somebody want to tell me that the sunspot cycles don’t impact the earth’s climate. Seven cycles of the highest average sunspot counts of all time, covering a period during which we had admittedly a period of warmer mean global temperatures.
No it is NOT a proof; but it IS the pattern you could not see.
I’ll let those who have access to some phony global temperature proxies dating back to 1600 do the comparison of those temperatures to the concurrent sunspot counts; noting only that from1645 to 1715 during the Maunder minimum it was bloody cold (scientifically speaking) and the sunspot peak counts were in the low zeros for 70 years. Maybe just a coincidence; not a proof; but you were looking for a pattern; right ?
George
@Adolfo Giurfa (13:43:20) :
Thank you for the link to the Reichel paper.
@David L. Hagen (14:34:15) :
Thanks for the info on Scafetta and West (2007)…Sometimes I wish that this could be more than just a hobby…;)
@Leif Svalgaard (17:17:58) :
Well, Dr. Svalgaard…I’m just going to have to figure out a way to organize the data in such a way to convince you that my correlation is reasonable.
@MartinGAtkins (15:24:58) :
That was my Homer Simpson “D’Oh!” moment of the day :-))
E.M.Smith (17:42:51) :
And at ~$3.50/mcf those gas shale plays will be more quiet than the Maunder Minimum!
The IMF must cause some eddy currents in the earth’s atmosphere. There must be some electromagnetic induction heating of the earth’s atmosphere due to the earth passing through the IMF and the IMF passing through the earth. If in times of high solar activity power grids can be brought down, there has to be a significant affect due the sun’s activity. Less solar activity, less electromagnetic induction heating of the atmosphere. Therefore lower temperatures. Why is this ignored?
I don’t know who originated the graphic of the Parker Spiral, but you can see the same here.
http://www.plasma-universe.com/index.php/Plasma-Universe.com
If you ever want to get an idea of how little we really know about the universe read a little of Alfven or Paratt, or consider that 90% of the universe is supposed to be “dark matter”.
Preemptive disclaimer: yes, I know there are some real crackpots attracted by the “Plasma Universe”, but that is always true when the envelope is being pushed and no reason the reject the idea in toto.
Leif Svalgaard (11:34:43) :
All data need be corrected for various effects that affect them one way or other
You are so right. All sensors & electronics have noise. All observed measurements have a range of uncertainty. The atmosphere of Earth is what separates me from taking diffraction-limited images, whether scintillation or refraction, it has to be corrected. Even correction itself is a source of noise, there being only so much you can do, and it ends up being subject to the law of diminishing returns.
George E. Smith (18:43:48) :
One of the things I got from Svensmark is that the amount of cosmic rays in any given sector of the galaxy is not a constant. The Solar System could in fact have entered such sectors exceptionally high in GCR’s as in a Spiral Arm.
The arms themselves vary. Precession of the orbit around the galaxy could also make repeated entries into the same arms pass through differing densities. The resulting swarms of GCR’s would lead to differing depths and lengths of Ice Ages given Svensmark is correct. That the present orbit is along the galactic plane does not mean that further in the past it was not (as in highly inclined) or will again incline due to perturbations.
Such as very young understanding of our galactic surroundings and so much more to be discovered.
bill (18:18:23) :
Leif’s plot of IMF shows no reversal. The sun field does reverse at 22 year cycle […] I am now confused but perhaps Leif could explain?
The IMF changes sign every week or two [and sometimes from minute to minute] as the heliospheric fields sweeps over the Earth. My plot shows the magnitude of the IMF. This table http://www.leif.org/research/spolar.txt shows the sign of the IMF [on a time scale of a day] since 1926 organized in 27-day rotations. A “.” means positive [away from the Sun]. an “X” means negative [towards the Sun] polarity. You can learn more about the modern view of the IMF from this 30-yr old paper of mine: http://www.leif.org/research/A%20View%20of%20Solar%20Magnetic%20Fields,%20the%20Solar%20Corona,%20and%20the%20Solar%20Wind%20in%20Three%20Dimensions.pdf
David J. Ameling (19:44:51) :
The IMF must cause some eddy currents in the earth’s atmosphere. […] Why is this ignored?
Because that is not the way it works. The eddy currents are formed high above the Earth, some 40,000 miles ‘up’ or out, where the Earth’s magnetic field begins to stop the solar winf from getting any closer.
fred (20:05:58) :
I don’t know who originated the graphic of the Parker Spiral,
I did [see the paper referred to above], with some basic theoretical ideas going back to E. Parker and Mike Schulz.