David Archibald writes to tell me that the IMF has hit “rock bottom” and may go lower still. Watching the IMF is a good indicator of the activity of the Sun’s internal magnetic dynamo. Looking at this graph from Archibald, and Lief’s graph below one could conclude that the sun’s inner magnetics are quieter than any time in the last 90+ years.
First a bit of a primer to help our readers understand what the IMF is.
This is from SpaceWeather.com
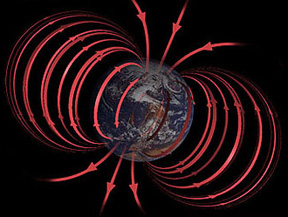
During solar minimum the Sun’s magnetic field, like Earth’s, resembles that of an iron bar magnet, with great closed loops near the equator and open field lines near the poles. Scientists call such a field a “dipole.” The Sun’s dipolar field is about as strong as a refrigerator magnet, or 50 gauss. Earth’s magnetic field is 100 times weaker.

During the years around solar maximum (2000 and 2001 are good examples) spots pepper the face of the Sun. Sunspots are places where intense magnetic loops — hundreds of times stronger than the ambient dipole field — poke through the photosphere. Sunspot magnetic fields overwhelm the underlying dipole; as a result, the Sun’s magnetic field near the surface of the star becomes tangled and complicated.
The Sun’s magnetic field isn’t confined to the immediate vicinity of our star. The solar wind carries it throughout the solar system. Out among the planets we call the Sun’s magnetic field the “Interplanetary Magnetic Field” or “IMF.” Because the Sun rotates (once every 27 days) the IMF has a spiral shape — named the “Parker spiral” after the scientist who first described it.
Here is another view of the Parker Spiral. Our own Leif Svalgaard had a hand in this I believe:

Guest Post by David Archibald
There has been one view that the Interplanetary Magnetic Field (IMF) has a floor of 4 nanoTeslas below which it cannot go. The value of the last 27 day average was 3.3, as shown in the graph below:

So far in 2009 there have been individual days as low as 1.8 nanoTeslas, so there may be no physical reason why a monthly average close to 2 is not possible. It seems that the Sun’s “magneticness” drives everything, and in that case the IMF data suggests that solar activity is not even feeling bottom yet.
Leif has a plot of the IMF all the way back to 1840:

Click for larger image. Source: http://www.leif.org/research/Erl75.png
From Leif’s graph, it appears that the last time the IMF got this low was in 1913 during that lull in solar activity.
Adolfo Giurfa (12:58:52) :
Mike Abbott (12:51:07) :
P.S. Somebody tell me how to turn italics on and off.
To start italics type the “minus than” sign then an “i” and the “more than”sign
. Then to end it, same but with the slash sign before the “i”.
Thanks!
I don’t know. Intuitively I think that when the Sun is more active, the cycle speeds up. I’m not a solar physicist.
The link between the cycle length and temperature is not a new idea…
Dave Middleton (12:14:02) :
But, if you plot the length of the 11-year cycle against the HadCRUT3 & UAH Lower Trop. temperature data, you can see a fairly good correlation. Warming periods correlate to shortening of the cycle and cooling periods correlate to lengthening of the cycle
I don’t think so. Here I show
http://www.leif.org/research/Cycle%20Length%20Temperature%20Correlation.pdf the length of cycles since the 1850s [blue symbols – there are two for each cycle: min-to-min and max-to-max, doesn’t make any difference], and the HadCRU temp anomalies [pink symbols – averages over the cycle (again two symbols per cycle – see above). I don’t see any correlation, neither does Excel [see pink symbols in plot in next panel], the R^2 value is 0.03 [meaning no correlation]. If you detrend the temperature curve [taking AGW out 🙂 ], you get the green curve. Again there is hardly any correlation (R^2 = 0.20, not significant), and in any case if the think the R^2 value of 0.2 is a sign on weak [but real] correlation, then it is positive: longer cycles = higher temps.
Italicized text…Omit “the letter” bits.
Argh!
For italics put an “i” and “/i” around the italicized text with around the i and /i.
With “less than” and “greater than” symbols around the i and /i.
The cosmic ray count is still increasing to record levels ( since at least 1964, Oulu).
http://cr0.izmiran.rssi.ru/oulu/main.htm
Now that SC 24 has begun, are there good guesses as to when GCR will peak?
Dave Middleton:
For the paper: Citation: Reichel, R., P. Thejll, and K. Lassen (2001), The cause-and-effect relationship of solar cycle length and the Northern Hemisphere air surface temperature, J. Geophys. Res., 106(A8), 15,635–15,641.
I found the pdf:
http://web.dmi.dk/solar-terrestrial/staff/thejll/ReichelThejllLassen2001JA900027.pdf
“”” David Ball (09:52:54) :
George, I must firmly disagree with you ( first time ever!! ) regarding intelligent life elsewhere. The sad part is, that neither of us has any proof either way. It will be a long time before there is any definitive proof. If there is no intelligent life anywhere else, it seems “an incredible waste of space”. Was it Carl Sagan who said this? One may also argue that there is no intelligent life here,. “””
Well there are those who believe in parallel universes also; an infinite number of them. They are quick to add that these other universes are so distant that there is no way we can ever become aware of any of them.
I say balderdash ! Anything that we can observe; no matter how strange; by any means that it may make itself known to us, is a part of THE universe.
Anything about which we can never know anything by any means now known or to be found in the future; is not a part of science and we have no business discussing it. There is only one universe; that’s what the word means; and it is the one we can “see”.
Humans have been discussing life in the universe for centuries. To date we have not so much as one single binary digit of scientific information pertaining to such life originating outside a thin shell no more than about +/- 20 km about mean sea level on planet earth. That is close enough to non-existent for me; sorry, but I don’t waste time on what might be, but is in no way apaprent.
And there clearly isn’t intelligent life here on earth, as our Boy wonder Teleprompter Reader in Chief tells us that Iran, that is sitting on more oil than they could possibly burn up in the forseeeable future of humans on this planet; has a need to develop nuclear power plants for energy; while the Country of which he is the de facto leader and protector designate, is prohibited by him, and those who hold his hand towel; from either building any more nuclear power stations itself; or from drilling for the abundant oil and gas sources of energy beneath our own feet.
The dinosairs survived for 140 million years just by being big and mean and ugly; while “intelligent” human life has yet to make it to 50,000 years, and likely may not last to the next century.
George
I’m not going to accept that everything imaginable exists; so we should look for it. What do we gain if we discover any sort of life elsewhere. OK go and look if you are curious; just don’t charge me for the tab.
Don B (13:25:31) :
The cosmic ray count is still increasing to record levels ( since at least 1964, Oulu).
different stations show slightly different cosmic ray counts. select 1 day resolution or 1 month for a better view. ‘Record levels’: we are talking of a couple of percent or so over the general trend.
Now that SC 24 has begun, are there good guesses as to when GCR will peak?
It takes the solar wind about a year to fill the heliosphere so the GCR cycle lags behind the solar cycle by about that amount or perhaps a little less, but not much.
The new NIPCC report Climate Change Reconsidered addresses
Chapter 5 – Solar Variability and Climate Cycles which gives a detailed review of Cosmic Rays in section 5.1, pp 208-220.
Dave Middleton, Re seeing solar cycles in TSI.
The new NIPCC report Climate Change Reconsidered addresses
Chapter 5 – Solar Variability and Climate Cycles which gives a detailed review of Irradiance in Section 5.2 in p 220-233. For example:
Don B (13:25:31) :
The cosmic ray count is still increasing to record levels ( since at least 1964, Oulu).
http://cr0.izmiran.rssi.ru/oulu/main.htm
Now that SC 24 has begun, are there good guesses as to when GCR will peak?
My guess would be that the solar wind will have a more direct effect on GCR’s and the SSN is more of a proxy.
I was wondering though if someone had plotted smoothed SSN, Ap, IMF etc graph that used a 6 to 7 year total for smoothing (as opposed to daily or monthly smoothed numbers). I was wondering this because pulling out a long term trend like that might be more apt to show a corrolation (or not) to long term climate change since there are lot’s of little things that show good corrolations but never quite perfect. One of these has been length of sunspot cycle, and cycle length changes should show up well if the smoothing was done for a longer time. I chose 6 to 7 years just because of the question of the possible corrolation of the ’91 major dip and the ’98 super El Nino.
Mike Abbott (11:15:14) :
Are these correlations REALLY beautiful, perfect and remarkable? Aren’t these claims questioned by many, including our own Leif? What do the data really tell us? If these correlations are weak, Svensmark’s cosmic ray theory must also be weak, right?
The correlations are not perfect, but are definitely there, and some are striking. The thing they are lacking is causation since we don’t know the mechanism, though many explanations seem plausible. Some are a little difficult to test as you might imagine. I don’t personally have a big issue with correlations that seem obvious though we don’t know the mechanism. If the variation in one relates to variation in another, statistically, it takes variation away from what is so often blamed on CO2. CO2 only has a weak correlation to temperature IF you ignore all of the other factors like ocean oscillations, planetary movements, etc. Leif will probably disagree since many solar changes are too small to explain the temperature differences. I think it’s quite possible that small changes in some solar factors produce larger changes in primarily albedo, by whatever mechanism, that can account for the temperature differences that TSI alone cannot. I can accept that we don’t know the mechanisms behind everything, we hardly ever do in the overall scheme of things. It is, however, easy to reject CO2 as a major cause, as has been demonstrated so many times.
KBK (12:29:11) :
Thanks for pointing out that the floor is broken. The data source is http://omniweb.gsfc.nasa.gov/
The Ap Index and the aa Index are following the IMF down. Oulu looks like it will reach at least 7030 versus my prediction of a peak of 6900. The heliospheric current sheet is continuing to flatten, and taking its time about it. It will be interesting to see what the bottom of solar activity looks like – a V turn or an extended base?
As far as the solar-climate connection goes, the solar cycle length/average temperature over the following cycle plots (Friis-Christensen and Lassen theory) mean that significant cooling is certain.
David L. Hagen (14:34:15) :
Scafetta and West (2007) So they are a kind of gnostics conspiring against the green church establishment. 🙂
>Mike Lorrey (08:23:55) :
>Space weather isn’t climate….lol
Quote of the week!!
Alan the Brit (09:27:43)
For the DVD of “The Cloud Mystery” look up the web site under the same name.
Dr David Archibald…………what was that prediction for global temp by middle of the year? Someone (not me) pointed out that the prediction would be a spectacular failure……..I guess that someone will be much closer to the truth than the Dr!
Dave Middleton (13:21:28) :
Like this. ;):
<i> turns italics on and </i> turns italics off.
DR (09:39:53) :
John W. (09:59:02) :
Mike Abbott (11:15:14) :
Nasif Nahle (11:16:35) :
tallbloke (12:28:19) :
Adolfo Giurfa (12:45:43) :
Leif Svalgaard (11:39:14) :
Dave Middleton (12:04:38)
bill (11:47:03) :
Don B (13:25:31) :
David L. Hagen (14:24:59)
(sorry if I missed any)
Piers Corbyn uses the sun in making his forecast, both short range and long range. He does not use the sun exclusively. But he has said the sun is the driver of climate. It his hard to ignore his record. Is it 100%? Of course it isn’t. But it is higher than any other.
It may be sinking in that the sun must be looked at more closely. Some of the money going in to the study of co2’s effect on climate must start being diverted into the study of the sun. Another portion must go to studying ocean currents. And still more must go in to other areas that are obviously related to understanding weather and climate. Apparently both Piers Corbyn, amd Anthony Watts(et al)say the moon is involved too.
As Dave Middleton (12:04:38) : has said “Like all good theories, Svensmark’s theory is evolving.” The relationships are beautiful and fascinating. To see a relationship verified by data is beautiful. It is what all scientists work for. To me that’s why the Svensmark video is so ‘remarkable’; Svensmark’s theory has elegance. A new discovery in science is beautiful, isn’t it? I think it is.
Can any one really say there is nothing real to it? The aerosols are there.
Also, I have not heard either Svensmark or Corbyn claim anything about the 11 year cycle.
A relation between cosmic rays and aerosols does exist. To label that relation ‘strong’ or ‘weak’ at this point is premature. We can however conclude the realtion is real. It exists.
There is debate over it? Certainly there is. There was raging debate over Einstein’s General Relativity. Can this debate mean the theory is wrong? Let the debate come! Let’s never be caught saying “It is beyond debate.”
for information
Temperature vs TSI
Temperature vs CO2
http://img156.imageshack.us/img156/6731/hadcrut3nhvsco2andtsi.jpg
At least temperature increases with CO2 whereas Temperature is not related to TSI.
I realise that plotting 2 increasing variables against each other will show correlation. But at least there is correlation and not randomness!
bill:
At least CO2 increases with temperature…
fixed.
Leif (14:04:06)– I deliberately wrote that GCR were at “record levels” knowing full well that they were currently only marginally higher than at earlier peaks, since alarmists (not me) wallow in hyperbole.
Thanks for the info, and for your many comments.
Is it possible that Anthony might invite Henrik Svensmark to make a contribution here, or perhaps Anthony might conduct and post an interview with him? (factoring in your busy schedule…..)