David Archibald writes to tell me that the IMF has hit “rock bottom” and may go lower still. Watching the IMF is a good indicator of the activity of the Sun’s internal magnetic dynamo. Looking at this graph from Archibald, and Lief’s graph below one could conclude that the sun’s inner magnetics are quieter than any time in the last 90+ years.
First a bit of a primer to help our readers understand what the IMF is.
This is from SpaceWeather.com
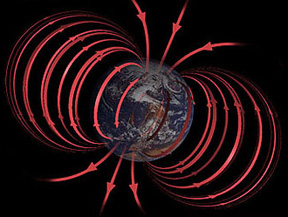
During solar minimum the Sun’s magnetic field, like Earth’s, resembles that of an iron bar magnet, with great closed loops near the equator and open field lines near the poles. Scientists call such a field a “dipole.” The Sun’s dipolar field is about as strong as a refrigerator magnet, or 50 gauss. Earth’s magnetic field is 100 times weaker.

During the years around solar maximum (2000 and 2001 are good examples) spots pepper the face of the Sun. Sunspots are places where intense magnetic loops — hundreds of times stronger than the ambient dipole field — poke through the photosphere. Sunspot magnetic fields overwhelm the underlying dipole; as a result, the Sun’s magnetic field near the surface of the star becomes tangled and complicated.
The Sun’s magnetic field isn’t confined to the immediate vicinity of our star. The solar wind carries it throughout the solar system. Out among the planets we call the Sun’s magnetic field the “Interplanetary Magnetic Field” or “IMF.” Because the Sun rotates (once every 27 days) the IMF has a spiral shape — named the “Parker spiral” after the scientist who first described it.
Here is another view of the Parker Spiral. Our own Leif Svalgaard had a hand in this I believe:

Guest Post by David Archibald
There has been one view that the Interplanetary Magnetic Field (IMF) has a floor of 4 nanoTeslas below which it cannot go. The value of the last 27 day average was 3.3, as shown in the graph below:

So far in 2009 there have been individual days as low as 1.8 nanoTeslas, so there may be no physical reason why a monthly average close to 2 is not possible. It seems that the Sun’s “magneticness” drives everything, and in that case the IMF data suggests that solar activity is not even feeling bottom yet.
Leif has a plot of the IMF all the way back to 1840:

Click for larger image. Source: http://www.leif.org/research/Erl75.png
From Leif’s graph, it appears that the last time the IMF got this low was in 1913 during that lull in solar activity.
George E. Smith (09:00:19) :
…
I don’t think Svensmark is claiming that the cosmic ray effect is all that controls earth’s climate; but I think we ignore the solar magnetism/cosmic ray/cloud cover mechanism at our peril; it does affect our climate/weather conditions, whther we want to believe that or not.
I think we’re like blind men and women, each felling a different part of the elephant and thinking we understand the whole.
The planetary climate is a complex system driven by the sun. There are multiple primary interactions, such as ocean heating and cloud formation. There are multiple secondary interactions, such as wind, rain, ocean currents. Hell , there are probably secondary and quaternary interactions as well. I understand and have modeled missiles, radars, and optical systems in high fidelity (and done it quite well, thank you). I wouldn’t want to attempt climate without several years, a large dedicated staff, and a large enough budget to actually formulate and conduct some tests to verify simulation results.
George, just wanted to add that I agree with the point you were making.
Leif Svalgaard (08:25:13) :
more serious problem with the latest OMNI data, that causes the values to be too low by about half a nT. Earlier, data from the ACE spacecraft [spacecraft ID = 71 in the OMNI database] were used, but since late in 2008 they have switched to the Wind spacecraft (ID =51) which has this systematic difference.
This graph shows the problem:
http://www.leif.org/research/OMNI-ACE%20B%20Comparison.png
First a technical subtlety: Because of the variations of the field the average magnitude of the scalar field is larger than the average magnitude of the average vector field. ACE reports on the real-time list the average vector field as the ‘total’ field, that is the value of bv = sqrt(bx^2+by^2+bz^2), where bx, by, and bz are the three components of the vector. This is shown as the green curve for the last couple of years. ACE reports to OMNI the true scalar field which was then reported to the world by OMNI and is shown by the red curve, note the constant difference between them (15%). The blue curve is just the green increased by 15% and you can see how well it matches the red curve until the last several rotations [when they started to use the ‘Wind’ data].
George E. Smith (09:00:19)
No there isn’t any intelligent life anywhere in this universe.
I always council against making conclusions beyond the available evidence. Just because there is no evidence of intelligence here doesn’t justify extending the theory to the whole universe.
Continuum 2009/06/03 (16:00) : It looks like someone took a hammer and smashed the sunspot into tiny pieces…
It is fading from the GONG images too…
It’s not “chilling” enough to bump natural gas prices…Futures are down $0.36…But spot prices are up a bit…
So…I guess the natural gas market shares the view that space weather is not climate…;)
“Just Want Results… (07:41:08) :
I know I have posted this video probably in 4 other threads. I think not everyone is aware of it though. It it speaks directly to this topic. And it does it in very simple terms.”
Thanks for posting that video on Svensmark’s cosmic ray theory. You’re right, his theory is explained very clearly. Like another commenter said, it should be played on the Science Channel for the masses. However, I have questions about several claims that are stated as fact in the video:
1. Svensmark says there is a “beautiful, clear-cut correlation between solar activity and Earth’s temperature.”
2. An associate of Svensmark says there is a “perfect correlation between solar magnetic activity and surface temperatures on Earth.”
3. Prof. Eugene Parker states that there is a “remarkable correlation between worldwide cloud cover and cosmic ray activity.”
Are these correlations REALLY beautiful, perfect and remarkable? Aren’t these claims questioned by many, including our own Leif? What do the data really tell us? If these correlations are weak, Svensmark’s cosmic ray theory must also be weak, right?
Just Want Results… (07:41:08) :
I know I have posted this video probably in 4 other threads. I think not everyone is aware of it though. It it speaks directly to this topic. And it does it in very simple terms.
I’ve done it all four times, JWR… I know about Svensmark’s theory (I call it theory cause it has been confirmed observationally and experimentally) and each time I’ve seen the movie I’ve been moved to wonder why modern academies give more credit to a model than to reality.
Local meteorologists have had problems on forecasting regional precipitation and temperatures because they have not been considering Svensmark’s theory… When they say it will rain, it doesn’t; when they say it won’t rain, it does. When forecasters say temperature will go up to 37 °C, the cloudiness clouds our forecast and the temperature doesn’t go higher than 27 C… And the latter happens in a very hot land.
I think two people must be considered seriously, Svensmark and Corbyn. 🙂
Alex (09:32:04) :
“Corrected” data eh? Corrected for what?
How is the data for IMF pre 1960s estimated? By sunspot count?
All data need be corrected for various effects that affect them one way or other, like we measure the earth magnetic field with a magnet of known strength, but the effect of the magnetic depends on its length which in turn depend on its temperature, so the reading have to be corrected for that. The cosmic ray count depends on the amount of air above the observer which in turn is given by the barometric pressure, so the count has to be corrected for that, and so on.
The estimate of IMF does not depend on the sunspot number. See here for how it is done: http://www.leif.org/research/AGU%20Spring%202008%20GP53A-07.pdf or http://www.leif.org/research/Determination%20IMF,%20SW,%20EUV,%201890-2003.pdf
Thanks to Anthony and David Archibald for alerting us to the sun’s activities, although the most unusual aspect of the unusually low Interplanetary Magnetic Field seems to be from changing instruments. Somehow it feels comforting to imagine that SCs 23-24 might be similar to SCs 12-13. At least we can look to the early 20th century for a while (until the next new data) for ideas about our “future weather/climate”.
I am grateful to Leif for the Berggen ea article on the 600-year annual Berylium10 record. I’m interested the findings that “recent Be10 flux in NGRIP is low”, yet there is no unusually high recent solar activity when compared to the rest of the record. Do they mean recent since the 1900s? What do they mean by “low”? Does your IDV index “agree” with their Be10 findings? Does this finding reflect your comments that “solar cycle average B increased by 25% from the 1900s to the 1950s and has been lower since”?
Mike Abbott (11:15:14) :
Are these correlations REALLY beautiful, perfect and remarkable?
If they were, we wouldn’t be debating this issue. In fact, they are not. Beware of people who claim perfect correlation or fit. You only get such things if you really understand the physical cause for something and can calculate from that fundamental understanding what you must observe. I don’t think we have that kind of understanding of the climate, the many claims of the opposite notwithstanding.
pyromancer76 (11:36:44) :
Does your IDV index “agree” with their Be10 findings? Does this finding reflect your comments that “solar cycle average B increased by 25% from the 1900s to the 1950s and has been lower since”?
Their data only goes to 1994, and I can’t see what they mean by recent Be10 flux in NGRIP. Since cycle 22 was a very active cycle, 10Be in the last decade of their data would be low.
Their findings are very much in agreement with our results. In fact, a nice ‘vindication’. Of course, this is not the final word. The main point of their paper is to point out that different ice cores give different results and that one cannot extrapolate blindly from one core only. We need many more of these, and from the South polar regions as well.
Mike Abbott (11:15:14) :
I’ve looked for the 11 year solar cycle. I cannot find it. Someone show me the 11 year solar cycle in the temperature record please!
http://img162.imageshack.us/img162/84/hadcrutnhshlsgiscetssna.jpg
I guess that means Svensmark is not correct then!
[snip Off topic]
Like all good theories, Svensmark’s theory is evolving.
Some of the correlations are very good and others are weaker. There are periods of time in which high energy cosmic rays and low cloud cover have a very high degree of correlation. Some of the arguments against Svensmark have involved correlations of all cosmic rays and all cloud cover – a strawman. Although some of the arguments against Svensmark have been fairly solid.
The exact mechanism for the possible connection between cosmic radiation and low cloud cover is not fully developed. Svensmark did, to some extent, empirically test the theory in his lab at the Danish National Space Center (IIRC) in a series of experiments called SKY. Essentially, natural heavy electrons (muons) did seed cloud formation in a type of cloud chamber.
The theory will be more extensively tested at one of CERN’s facilities in a series of experiments known as CLOUD. These tests will test the theory under a wide range of conditions…
bill (11:47:03) :
I’ve looked for the 11 year solar cycle. I cannot find it. Someone show me the 11 year solar cycle in the temperature record please!
I guess that means Svensmark is not correct then!
And the 11-yr cycle is not in the albedo either. Now, some people claim their is a very small solar signal [like 0.1C], this would be hard to pick out of the noise as the cycle lengths vary a bit. What it shows is that the Sun is not a major driver.
The Diatribe Guy (07:35:37) :
I have no good scientific reason to explain why the two are correlated, but a 6-ish year lag seems to have enough merit for further study.
Then we could expect (provided Svensmark is right), from nowadays highs in CRs, within 6 years, a very interesting low in temperatures.
Anyway it will be blamed by His Highness to “climate change” due again to that “Global Warming” which HE so graciously predicted for the welfare of humanity.
bill (11:47:03) :
You shouldn’t “see” the 11-year sunspot cycle in the temperature data.
But, if you plot the length of the 11-year cycle against the HadCRUT3 & UAH Lower Trop. temperature data, you can see a fairly good correlation. Warming periods correlate to shortening of the cycle and cooling periods correlate to lengthening of the cycle…Temp vs. Schwabe Shortness
Does this mean that sunspots modulate the climate? No. But the speed of the cycle could be a proxy for something that does modulate the climate…Like…maybe clouds & albedo.
Leif Svalgaard (11:39:14) :
Mike Abbott (11:15:14) :
Are these correlations REALLY beautiful, perfect and remarkable?
If they were, we wouldn’t be debating this issue. In fact, they are not. Beware of people who claim perfect correlation or fit. You only get such things if you really understand the physical cause for something and can calculate from that fundamental understanding what you must observe. I don’t think we have that kind of understanding of the climate, the many claims of the opposite notwithstanding.
Do you think Svensmark et al have better correlations between solar activity and temperature than the correlation between co2 and temperature, or worse?
There has been one view that the Interplanetary Magnetic Field (IMF) has a floor of 4 nanoTeslas below which it cannot go.
A Floor in the Solar Wind Magnetic Field
It would be helpful if David Archibald would reference the souce of his IMF plot. It doesn’t compare particularly well with Leif Svalgaard’s.
Leif Svalgaard (11:39:14) :
Dr. Svalgaard,
I agree that you can’t claim proof of causality just based on a close correlation of two functions without a full understanding of the physical mechanisms. But isn’t it just good “science” to consider such correlations to at least form the basis of working hypotheses?
I think one of the problems with the whole AGW dilemma is the fact that a perceived deep understanding of the physical mechanisms of CO2’s properties as a greenhouse gas has driven the correlation process; rather than the correlation process driving the search for mechanisms.
As this chart from IPCC’s 3AR shows, CO2 was considered to be well understood; whereas solar processes and albedo were poorly understood…And low cloud cover wasn’t even mentioned.
The funny thing is that if you apply the albedo results of BBSO’s “Earthshine Project” …You get more than enough radiative forcing to explain the warming of the late 20th century.
Dave Middleton (12:14:02) :
if you plot the length of the 11-year cycle against the HadCRUT3 & UAH Lower Trop. temperature data, you can see a fairly good correlation
Then it follows the next question:
What does it make a cycle longer or smaller than other? The driver of cycle length should be the indirect driver of climate. ???
I should have mentioned that my original source for the BBSO Earthshine data was this blog…
http://wattsupwiththat.com/2007/10/17/earths-albedo-tells-a-interesting-story/#comments
“tallbloke (12:28:19) :
Do you think Svensmark et al have better correlations between solar activity and temperature than the correlation between co2 and temperature, or worse?”
I guess Svensmark’s correlations are “better” since his correlations are weak while the correlation between CO2 and temperature is virtually nonexistent. In any case, this raises doubts about both theories.
P.S. Somebody tell me how to turn italics on and off.
Mike Abbott (12:51:07) :
P.S. Somebody tell me how to turn italics on and off.
To start italics type the “minus than” sign then an “i” and the “more than”sign
. Then to end it, same but with the slash sign before the “i”.