By Joseph D’Aleo ICECAP
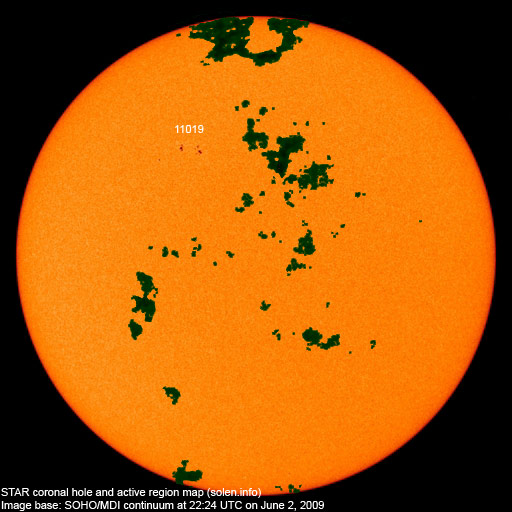
The sun has become more active in recent days with cycle 24 spots in middle latitudes. See sunspot group number 11019 for group of red spots. This is slightly diminished since yesterday. The dark green areas are coronal holes out of which the solar wind escapes at higher velocity.

See larger image here.
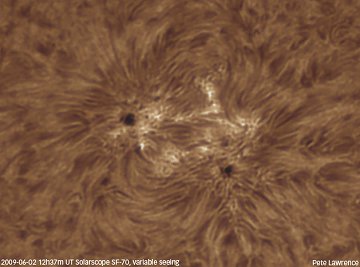
Peter Lawrence has a close up view of that sunspot posted on spaceweather.com.

See larger image here.
There is a loop of the sunspots develop and rotate around the solar disk the last few days here.
This activity came late enough in the month of May, to keep the monthly number for May below the value of 14 months ago of 3.2 which it is replacing in the 13 month running mean. That means the solar cycle minimum can’t be earlier than November 2008, making it at least a 12.5 year long cycle 23.
The value needs to fall below 3.4 in June to move the minimum to December. That is still possible if the sunspot group continues to decay as most have done as they crossed the disk in recent months. If it stays below that value, we will likely see the solar minimum in December, 2008 as 14 months before that the sun was very quiet with just a sunspot number of 0.5. If not, the minimum will be November. It is my guess that November will win the prize.
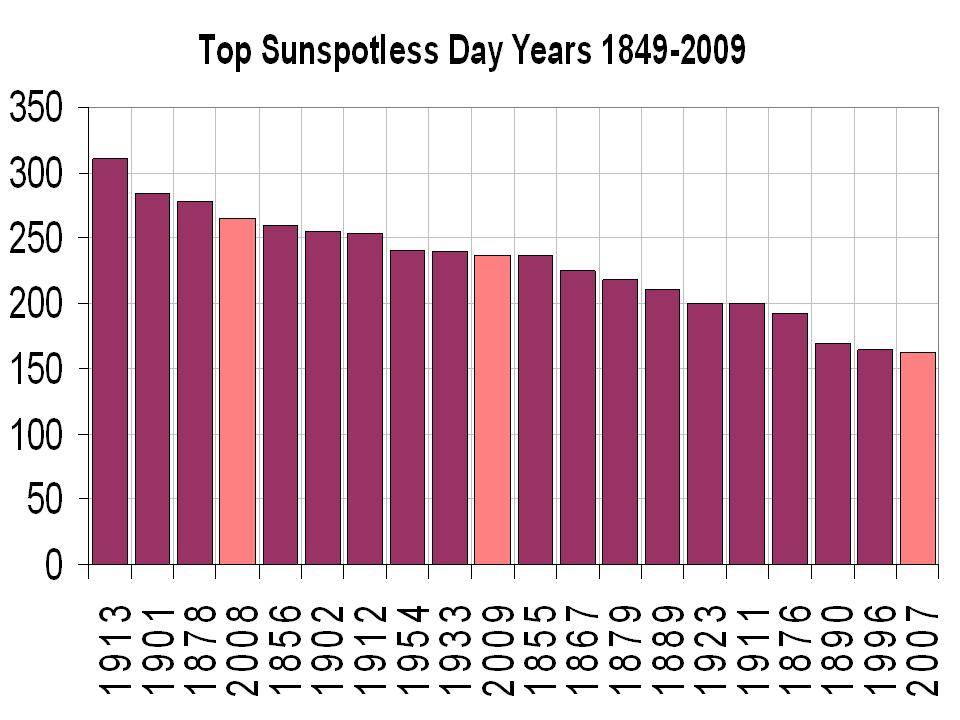
We added 22 more sunspotless days to the total for this cycle transition which as of June 1 had now reached an amazing 614 days. We are likely to add additional days and add 2009 to 2007 and 2008 as recent years in the top ten since 1900. Only the early 1900s had a similar 3 year stretch of high sunspot days (1911, 1912, and 1913).

See larger image here.
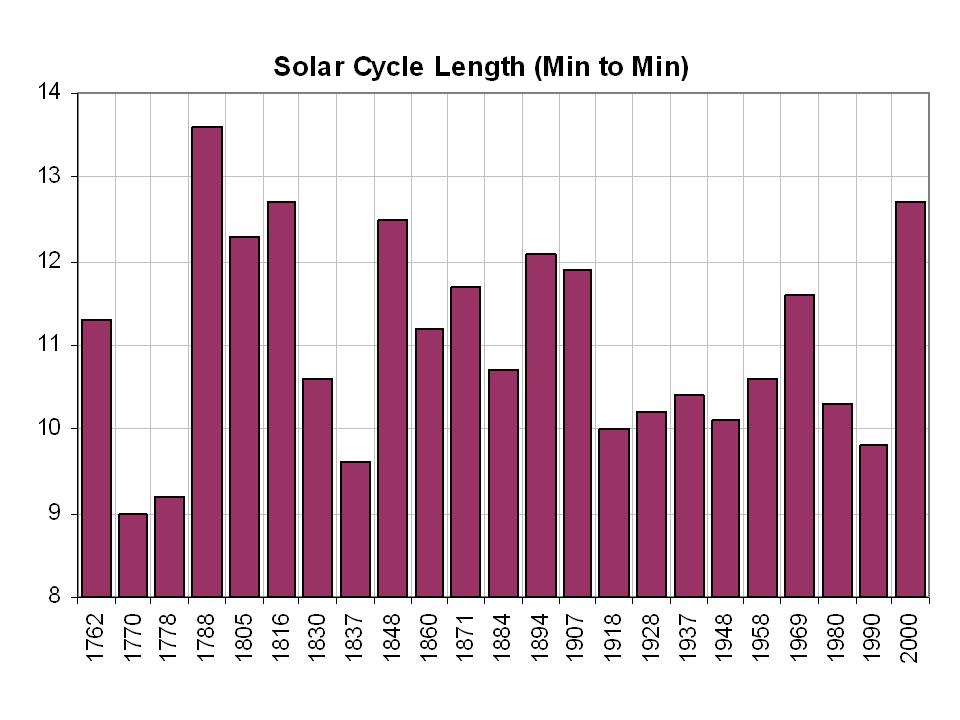
It also marks the longest cycle in 150 years, tying the one that peaked in 1848. You have to go back to the Dalton minimum in 1816 to find a longer cycle 12.7 years.

See larger image here.
You can see by the 12th year in 3 of the 5 most recent cycles, the sun had rebounded significantly by years 12 and 13.

See larger image here.NOTE: Updated per discussion in comments – Anthony
See what some scientists believe this means about the decades ahead here.
Mick J (07:32:45) :
Had three or so hot days in the UK reaching into the mid 20s C (current average would be about 18C) but now the temperatures have dropped by over 10C, same for most of north and central Europe
Same here in southern Norway, we had ~25C max over the last weekend, but by Tuesday it had dropped 15 degrees overnight. Right now (22:40 local summertime) it it 6C outside.
ralph ellis (08:40:58) :
However, it is still a bit of a damp squib thus far, so let’s not count any chickens until the Sun lays few more spotty eggs.
http://sohowww.nascom.nasa.gov/data/realtime/mdi_igr/1024/latest.html
I agree with this, it is too early to conclude in my opinion. We have had this (in comparison to prior spots) somewhat respectable spot group, and it is now dying. The earlier specks this year have been almost jokes. There is not much telling us that the coming months will be very active, it could easily become like the last few months.
If we get more spots like the last one in the coming 2-3 months it seems more convincing to me that the activity is in fact increasing, but IMHO the latest spot is not significant alone to conclude now that the sunspot activity is going to “skyrocket” anytime soon, or that the minimum will be well defined in December 2008.
I just hope the next spot will show itself during the time when Livingston has “telescope time”, so we can get another assessment on the “Sunspots may vanish by 2015” issue.
I live in Ontario, 2 hours north of Toronto. Our temperatures have been below normal all year, we had 3 nice (26 C or so days in May, now back to 5 to 6 to 11 degrees C below normal. We had a frost warning the evening of May 31st as did NY state. How nuts is that? Normal planting time is May 24th. But our Liberal provincal governments continues in its attempt to bring in a cap and trade. So that the temperatures will decrease? So that we can pay more to heat our homes all year long, as I did last year.
Neven (09:58:33) :
UAH May 2009 Global Temperature Update +0.04 deg. C
Could someone explain this to me? When I look at the AMSU-A temperatures at http://discover.itsc.uah.edu/amsutemps/execute.csh?amsutemps using channel 05 like Dr. Spencer advises I see that the 2009 temperatures are quite a bit (relatively speaking) above the 20-year average for most of May. So how can the global average temperature anomaly for May 09 be +0.04 degrees C?
1. The Ch 5 readings come from NOAA-15 satellite which UAH no longer use. UAH readings are from AMSUs on NASA’s Aqua satellite.
2. NOAA-15 satellite experiences “diurnal drift” which means that over time measurements are taken at a warmer time of the day. Some adjustment to the raw data is, therefore, required.
See http://www.drroyspencer.com/ where there is a brief reference to this on the home page.
For a rough guide of the most recent month’s anomaly, it is probably best to compare with the corresponding month from the previous year rather than the 20 year average. For example, the NOAA-15 readings suggest May 2009 is ~0.2 deg C warmer than May 2008. UAH is ~0.22 warmer than May 2008 and RSS is ~0.17 deg warmer, so in this case, at least, using the monthly comparisons gives a decent approximation.
A Giurfa: I dont think so
UNISYS SST
http://weather.unisys.com/surface/sst_anom.html
I keep asking why is the NOAA SST graph so different to the Unisys one, No one seem to know. Any volunteers?
NOAA SST
http://www.osdpd.noaa.gov/PSB/EPS/SST/data/anomnight.6.4.2009.gif
In light of the differences in sea ice extent between sites one has to wonder….
There was no attempt to deceive, just a careless sliding of the years for cycle 23 in EXCEL.Probably happened when I updated file to include May values. I think I had correctly depicted it before and have use the right one in PPTs.
I did the story while riding Amtrak yesterday after a 5 am start after attending the ICCC with Anthony in DC.
I had arbitrarily chosen year 0 as solar minimum, meaning the first full calendar year of the new cycle gets a 1 and so forth. This is just like your birthday. You are not 1 at birth but 12 months after although you are in your first year.
I did not mean to imply the typical cycle lasts 13 years, only to show that in most recent cycles by this time (years 12 and 13) the activity had strongly rebounded. We are in the 13th year of the cycle, it will have a 13th birthday only if the minimum holds off to May 2009, increasingly unlikely. Monthly numbers in the last 7 months in 2009 will determine what the calendar year average will be.If it ends up high in 2009 than 2008, 2009 will become year 1 of cycle 24.
It would have been ideal to actually use 12 month intervals from minimum instead of calendar year, but the original purpose was to show that this cycle like cycle 20 was longer than most and calendar year averages were readily available in my excel files.
I have the highest regard for Leif Svalgaard and the work he does and his immense knowledge of the solar science. i enjoy his comments here on Climate Audit and Solar Cycle 24.
He was one of the first to call for a diminished cycle 24 and I respect his opinion that that fact doesn’t necessarily mean a cooling is coming. I do believe there is enough evidence in the historical record that it will cool if it peaks at 70 or especially if it tops at 40. See also http://www.dailytech.com/NASA+Study+Acknowledges+Solar+Cycle+Not+Man+Responsible+for+Past+Warming/article15310.htm
A historic question – may be for Leif Svalgaard.
Go back to the 1950’s or earlier; and would anyone have seen the current crop of cycle 24 sunspots ?
I believe they are very small; is their observation possible only because of better equipment ?
If so; if we used comparable technology – how many spotless days would we ‘really’ have had ?
And per my communication with Joe D’Aleo, his graph has been updated both on ICECAP and WUWT – Anthony
Carsten Arnholm, Norway (13:26:33) :
Geoff Sharp (00:20:20) :
So its official, SC23 minimum has gone way past Aug 2008?
Of course. It happened months ago, it follows from the way the smoothing works.
Thanks Carsten, the reason I mentioned it was I seem to recall Leif saying not so long ago that Aug 2008 was going to be the minimum…but my memory may not be correct?
peter_dtm (15:04:44) :
Go back to the 1950’s or earlier; and would anyone have seen the current crop of cycle 24 sunspots ?
Yes, and 100 years ago as well. E.g. ftp://howard.astro.ucla.edu/pub/obs/drawings/1923/dr231019.jpg
Geoff Sharp (00:20:20) :
I seem to recall Leif saying not so long ago that Aug 2008 was going to be the minimum
never miss a chance of a cheap shot…
Gosh, I didn’t know my blog was so influential. – Anthony
Geeze Anthony, doncha know that we live and breathe by your written word being the sheeple that we are:P Hehehe. (mumbles Anthony!, Anthony!)
Flanagan, when Australia had fires, it was global warming. When CA had a hot spell and or fires, it was touted as a sure sign of the global warming to come in both the local and national news. There was a recent report on all the MSM stations about refugees of sea rises on islands where the ocean hasn’t risen yet, and lets see what else have I heard about lately, certainly not the cold!. Oh yes, tornados were more intense because of global warming, and our first cyclone of the season was a day early and that was also touted as a symptom of global warming. Nancy P. went to china to talk about human rights of global warming. Our legislature is about to vote on a bill based on .. you guessed it, the theory of Co2 caused by humans warming the earth. While its ok for warmers to use ‘weather’ as sure signs of warming.. turn about is considered cherry picking. Maybe if more balance was restored in our media we wouldnt need to be so defensive, perhaps we could even have a rational discussion… but alas the non existant consensus makes that impossible but no one forces you to come here and read… that tells me you have doubts as well.
We keep hearing one month does not a trend make, but here you are screaming about a warm month. Well all these years later most of us are wondering, does the current trend have to go longer then the “warming” trend at max solar activity and El Nino for the models to be proven wrong? Or do you buy the momentary pause in warming theory caused by those pesky negative feedbacks which AGW absolutely denies exist. I do notice we haven’t managed to expand beyond the one degree on the anomaly chart. Where o where is that massive heating? HMMMMMM?
http://www.ncdc.noaa.gov/img/climate/research/global-jan-dec-error-bar-pg.gif
Then again, it may be yet another false alarm, the latest of several.
What Joe said … chilling (pun partially intended).
Thanks for explaining, John Finn!
Paul Stanko (03:25:43) :
“My spreadsheet indicates that cycle 23 was 147 months (12.25 years). This is calculated using the 13 month smoothed International Sunspot Number. Cycles 4, 6, 9 and 13 were longer.”
I made the same calculation on my spreadsheet. If we assume SC23 begins in May 1996 and ends in October 2008, the duration of the cycle was 150 months. (Of course, your calculation started with another month.)
Then, there are 2 cycles that are longer: cycle 4 (164 months) and cycle 6 (151 months: begin Oct 1810, end Apr 1823). Cycles 5 (begin May 1798, end Sep 1810) and 9 (begin Jul 1843, end Nov 1855) lasted 149 months.
I have a difference with your calculation for the solar cycle 13. I think you agree with the begining (Mar 1890) but for the end of the cycle, there are several months in the running. When I opt for Jan 1902, cycle 13 was 143 months long.
With these preconditions, SC 23 (if Oct 2008 would be the last month of the cycle) would be the third longest cycle since 1755.
Of course, as Leif says,
– solar cycles overlap by several years,
– “the [smoothed – itself a dubious thing] minimum around 1890 had multiple ‘minima’ ”
– “The next minimum did a similar thing (…) during 1901 May- Jun and 1901 Dec – 1902 Feb”
So, “the whole concept is too fuzzy and not very useful” (see post regarding Ken Tapping)
Nevertheless, it should be reassuring, if we should agree on some calculations.
Leif Svalgaard (17:46:01) :
Thank you !
I had come across accusations that reporting was ‘artificially’ high due to improved instrumentation.
Rik Gheysens (11:48:24) :
I have a difference with your calculation for the solar cycle 13. I think you agree with the begining (Mar 1890) but for the end of the cycle, there are several months in the running. When I opt for Jan 1902, cycle 13 was 143 months long.
With these preconditions, SC 23 (if Oct 2008 would be the last month of the cycle) would be the third longest cycle since 1755.
Quite interesting, we actually disagree on the beginning of cycle 13 and probably agree on the ending time. I have Jan 1902 as the first month of cycle 14, much as you suggest, but December 1888 as the first month of cycle 13. That’s because the smoothed 13 month sunspot # got down to 5.41538 in December 1888, then as you say, it started upward then dipped again. It reached 5.43077 in December 1889. It then rose a bit and dipped a bit again, then finally rose starting in March 1890, as you point out.
So, if you look at the cycle beginning when the clear uptrend becomes monotonic, I would agree with you and this would make cycle 13 at least a year shorter. My rule was to just look for the minimum though, seemed the simplest.
Thanks for the thought provoking analysis and discussion,
Paul
In Britain the Guardian MSM has reportedsnow in Cumbria . Apparently it is the first time it has snowed in Britain in June since 1975.
So, the NASA report posed on here recently, says that there is about a 0.1C effect on global surface temperatures, between the sunspot max and sunspot min. This has been an extended minimum – perhaps the effect is stronger than 0.1C – maybe 0.15C?
So, as sunspots get started again, and we start – however slowly or rapidly – moving back toward max, we’re going to recover that 0.1 – 0.15C. No? So, in 6-7 years, we’re going to see an increase in global surface temps of 0.1C – 0.15C, just as a result of sunspot activity?
No?
I don’t quite know where to put this, but I hope someone can explain it.
Spaceweather.com is showing a SSN of 12 for the 12th June.
They did the same 3 days ago.
Checking the SOHO MDI images,
you can get them here http://sohowww.nascom.nasa.gov/data/realtime/realtime-mdi_igr-1024-all.html
shows no sunspots since the 5th of June which means we have had 7 spotless days and 5 spot days this month. Their info doesn’t make sense (Spaceweather.com that is ).
So my question is, what are these people counting.
This comment is a bit late, but the guys over at solarcycle24.com have discussed the issue of modern observations vs historical observations.
http://solarcycle24com.proboards.com/index.cgi?board=general&action=display&thread=704&page=1 “Layman’s Sunspot Count” is one place. A search for “speck” will bring up others.
In addition to higher resolution observation picking up smaller spots, we are also artificially increasing the spot count through more thorough 24 hour per day observation.
In general though, the sunspot record is much longer and much cleaner than any temperature or precipitation records.
discussion on sunspots vs “specks” can be found over at solarcycle24.com.