By Joseph D’Aleo ICECAP
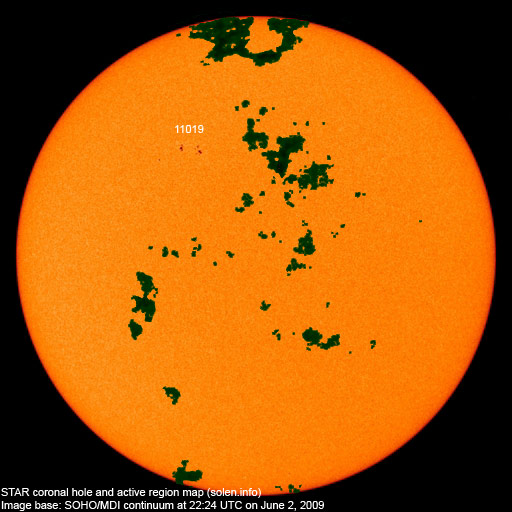
The sun has become more active in recent days with cycle 24 spots in middle latitudes. See sunspot group number 11019 for group of red spots. This is slightly diminished since yesterday. The dark green areas are coronal holes out of which the solar wind escapes at higher velocity.

See larger image here.
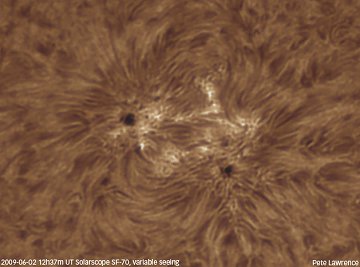
Peter Lawrence has a close up view of that sunspot posted on spaceweather.com.

See larger image here.
There is a loop of the sunspots develop and rotate around the solar disk the last few days here.
This activity came late enough in the month of May, to keep the monthly number for May below the value of 14 months ago of 3.2 which it is replacing in the 13 month running mean. That means the solar cycle minimum can’t be earlier than November 2008, making it at least a 12.5 year long cycle 23.
The value needs to fall below 3.4 in June to move the minimum to December. That is still possible if the sunspot group continues to decay as most have done as they crossed the disk in recent months. If it stays below that value, we will likely see the solar minimum in December, 2008 as 14 months before that the sun was very quiet with just a sunspot number of 0.5. If not, the minimum will be November. It is my guess that November will win the prize.
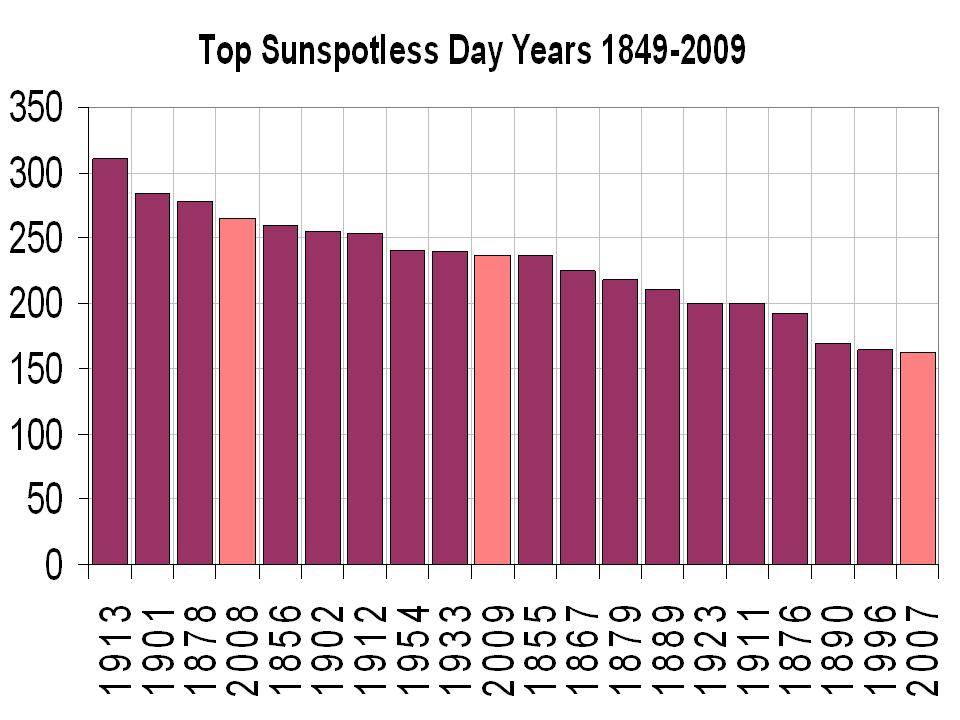
We added 22 more sunspotless days to the total for this cycle transition which as of June 1 had now reached an amazing 614 days. We are likely to add additional days and add 2009 to 2007 and 2008 as recent years in the top ten since 1900. Only the early 1900s had a similar 3 year stretch of high sunspot days (1911, 1912, and 1913).

See larger image here.
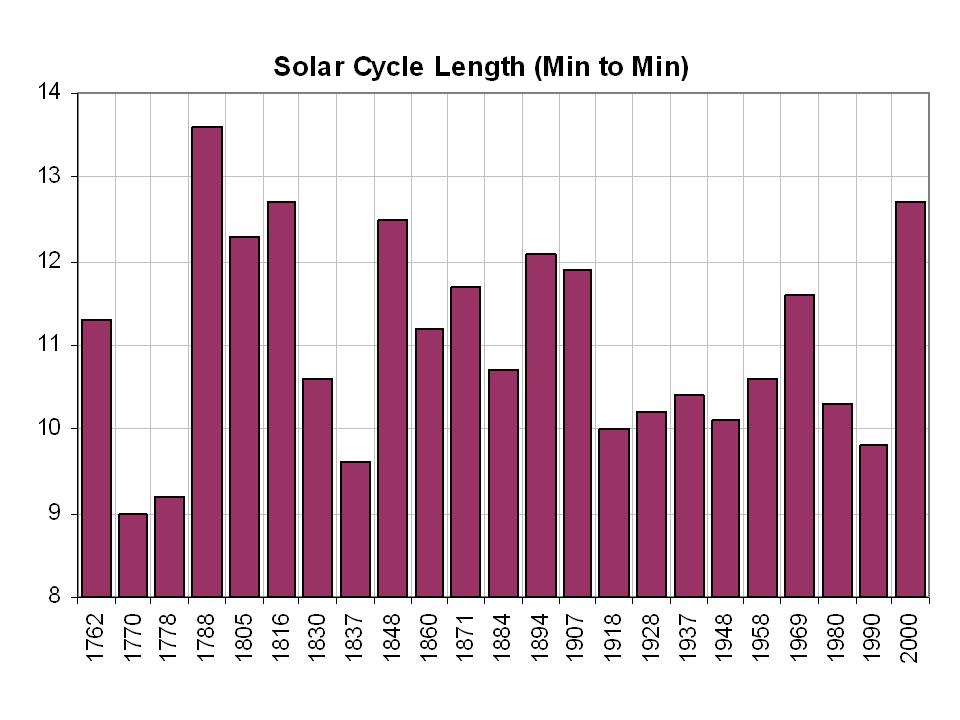
It also marks the longest cycle in 150 years, tying the one that peaked in 1848. You have to go back to the Dalton minimum in 1816 to find a longer cycle 12.7 years.

See larger image here.
You can see by the 12th year in 3 of the 5 most recent cycles, the sun had rebounded significantly by years 12 and 13.

See larger image here.NOTE: Updated per discussion in comments – Anthony
See what some scientists believe this means about the decades ahead here.
Apparently it helps to start cycle 23 a year earlier to make it look longer than it really is:
http://icecap.us/images/uploads/Cycles19-23.jpg
One would think it better to place the minimum value reached just before cycle 23 at zero as you did for the other cycles, rather than at one to artificially increase the length of SC23…
Hopefully this will mean that radio propagation will begin to improve. It has been a very long minimum.
So solar minimum isn’t even here yet!?
What implications may have on global temps.? wxmaps.org show some well below average spots in various locations around the world (balanced by above normal spots), old man Winter is roaring into New Zealand, temps. here are forecast to bounce from the 70’s to the 90’s to the 70’s to the 80’s in a near-rollercoaster fashion, the UAH daily temps. site is showing a rather sizable interruption in stratospheric cooling (at 118,000 ft.) which is ‘supposed’ to happen during CO2 driven warming ect…
Look’s like more confirmation of the “Watts Effect”. Things started to perk up right after your “Baby Grand” post.
There being many measures of what constitutes solar minimum, a lot is now riding on this month, and the way in which spots are counted.
Even if Nov 2008 is the minimum (or other dates) the time spent in the deep lull will also take it’s toll on the present cycle, if the history of Solar Cycles is a good guide.
Those predictors who are still standing (Lief being one of the few) have a low to very low maximum indicated. That should mean a much more gradual slope out of minimum (as in SC5 & 6).
But, caveat emptor, all of this can turn on a dime.
So far, I have only gotten one day in on 11019, but it was very distinct & pronounced in contrast to the meager spots of the last 1.25 years.
“Needless to say much will be learned the next 5 years. . .”
And I’m not so old that I don’t expect to be around to learn it. Cool stuff!
The last chart of the original could use labels for the colored lines. Maybe instead of black/bold at the top Hadley and UAH could match the colors of the lines. Then write out the meaning of these labels for those who might stumble on this and have no idea what is being presented. Easy for me to say, I know. Sorry to sound critical when the material is so interesting.
New Zealand has just gone through the coldest May on record (note: some records only start in the early 1930’s). 2.5 degrees C below average. We haven’t had snow here at my location (Palmerston North) since 1975 and 1977 during the 70’s cold period, but if this keeps up I can see it happening this coming southern winter.
In an average May the mountain ranges to our south and NE might expect one dumping of snow based on my records for the past 28 years. This year we have had 9 mountain snowfalls. The last really cold May was in 1992 and that was rightly blamed on Mt Pinatubo. Aparently the scientists are perplexed as to what could be causing this current cold situation. They wouldn’t be so perplexed if they pulled their heads out of the sand, or some other equally dark space.
Can’t slide anything past Leif.
John F. Hultquist (17:58:16) : “Needless to say much will be learned the next 5 years. . .”
Yes, but it won’t be reported in the MSM.
Adam from Kansas (17:47:15) :
What implications may have on global temps.? wxmaps.org show some well below average spots in various locations around the world (balanced by above normal spots), old man Winter is roaring into New Zealand, temps. here are forecast to bounce from the 70’s to the 90’s to the 70’s to the 80’s in a near-rollercoaster fashion, the UAH daily temps. site is showing a rather sizable interruption in stratospheric cooling (at 118,000 ft.) which is ’supposed’ to happen during CO2 driven warming ect…
Hi Adam… The problem is that the stratospheric cooling at 36 kilometer of height is wrongly attributed to increases of the concentration of CO2 at the lower troposphere (it’s a lie derived from models). There are many factors which contribute to the cooling of the stratosphere, but the CO2, a decrease of thermosphere temperature, for example, by a lesser energetic solar particles hitting on it which leads to a lower conductive heat transfer, by fluctuations of its content of oxygen, and by a decrease of chemical reactions which would drive the chemical heating due to changes in UV radiation incoming from the Sun, etc.
“” Ian Cooper (18:27:12) :
New Zealand has just gone through the coldest May on record (note: some records only start in the early 1930’s). 2.5 degrees C below average. We haven’t had snow here at my location (Palmerston North) since 1975 and 1977 during the 70’s cold period, “”
There hasn’t been snow on Thanksgiving in my home town in Michigan, a Northern USA State, since the 70’s. There was snow for Thanksgiving the last 2 years.
Just Want Results… (19:44:53) :
I should have said for the international readers, Thanksgiving is a holiday at the end of November, just before winter starts.
So does this mean temperatures will pick up just as global warming legislation hits the floor in Congress?
Leif Svalgaard (17:35:47) :
Apparently it helps to start cycle 23 a year earlier to make it look longer than it really is:
Good catch. I also want to know why the graph of cycle 23 in the last chart in D’Aleo’s article above is so much different than in his previous (2008) version of the same chart:
http://icecap.us/images/uploads/solarcyclestory.pdf
The older chart I’m talking about is on page 3 of that article.
anyone notice the new RSS data is out? with the exception of may of 2008, it was the coldest may anomaly since 1997, and (cherry picking here) slightly cooler tahn the temperature of May of 1980.
“So does this mean temperatures will pick up just as global warming legislation hits the floor in Congress?”
Of Course! It’s called the beginning of Summer!
MikeN (20:05:37) :
“So does this mean temperatures will pick up just as global warming legislation hits the floor in Congress?”
It has been determined (by whom I don’t know) that Summer solstice will occur on June 21, 2009 at 1:45 A.M. EDT. I’ll bet on hot and muggy in Foggy Bottom and the rest of the D.C. area.
And… Forecasters said that today and the remainder days of this week up to Thursday of the next week the weather would be hot, dry and cloudless days… Suddenly, appearing from the Mexican Gulf, a dense army of cumulonimbus covered the night sky of Monterrey and a thunderstorm whipped out my internet by cable… Now, I’m working through my ADSL connection. Coincidentally, the group of bipolar sunspots (beta) started disappearing from humans’ sight. Anyway, forcasters failed from morning to evening.
so leif, are you saying we are only at 11.5 years? i am confused…i thought otherwise. would you mind clarifying?
Never mind my previous posts; the old and new graphs of graphs of cycle 23 are not much different after all. The one above is simply shifted forward a year as Leif noted.
Solar Cycle 24 maybe upon us, but its latest entrant sunspot group is fading rapidly – will be gone within 24 hours.
yeah…we really won’t know until we get some consistency right?
ladise and gentlemen corrected Arctic sea ice is now 100% normal Mayday!
http://arctic-roos.org/observations/satellite-data/sea-ice/observation_images/ssmi1_ice_area.png
keep for posterity someone
Kabul, Afghanistan in the meantime had the coolest and wettest May in over 30 years. Huge roses in my yard.
Forecasts for the wheat crop are the highest in 32 years, very near to wheat self-sufficiency for Afghanistan.
We only hit 32°C one day so far with the forecast showing temps staying below 30°C for the next ten days. We still have snow at the 11,000 foot line. (It was all gone this time last year.) We thought last summer was cool when we only hit 37.8°C one day all summer on 31 July, but this one is shaping up to be even cooler. The locals, while enjoying the pleasant weather right now, are concerned about what the coming winter may portend.
It’s only weather, but…