By Joseph D’Aleo, CCM, ICECAP

Map of US weather records for week ending 4/6/09 click image to enlarge or here for source. Map created by HAMWeather,
UPDATE: NOAA predicts the Red River Will Crest Again in Fargo-Moorhead in Late April here possibly again at records levels.
Just a week after the last major northern plains blizzard another significant snowfall occurred this weekend. Models did poorly with the location of the heaviest snow bands and generally overdid the magnitude. These models sometimes have difficult with the first 48 hours, but Susan Solomon and friends tell us you can depend on cruder models to predict the climate 100 years or even a thousand years in advance.
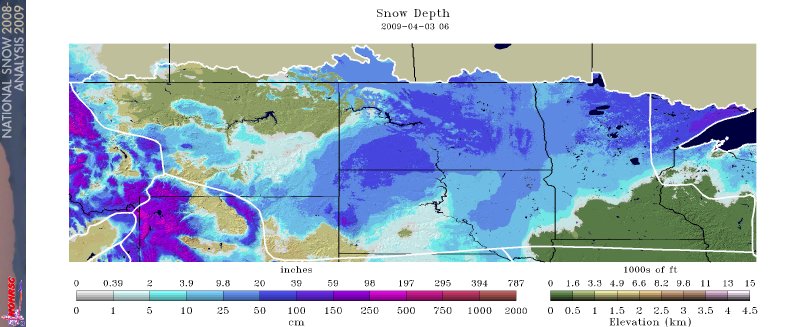
Several inches of snow fell in parts of Nebraska, South Dakota, Iowa, southern Minnesota into southern Wisconsin. This will include parts of the Red River Basin already in flood and with deep snowcover (click here to enlarge).

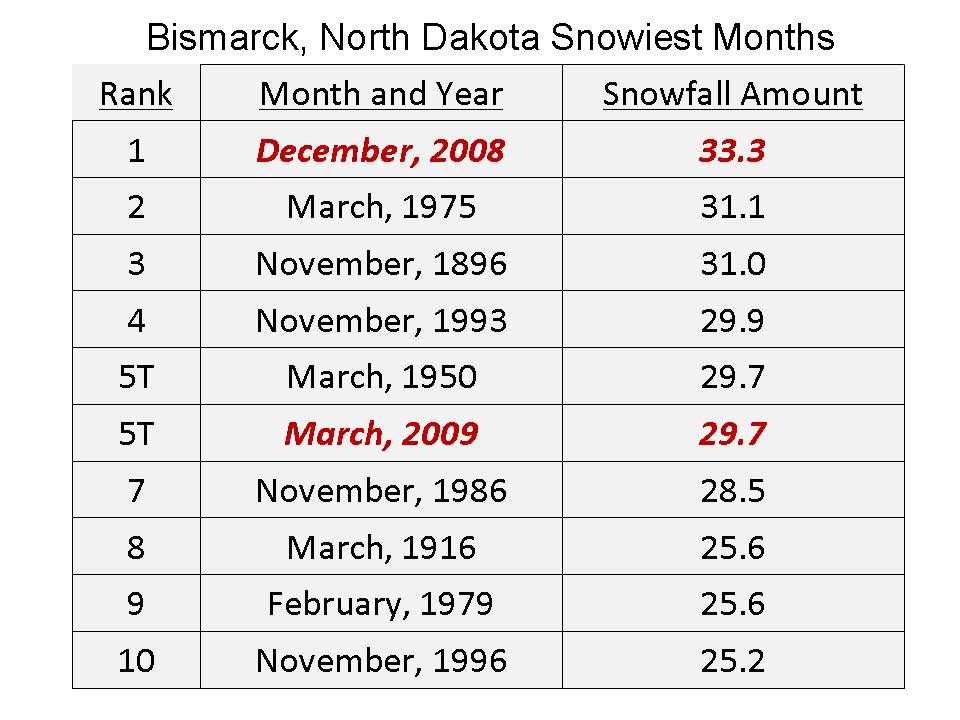
The northern plains has been hit hard this year. Fargo set a record for snowfall and precipitation for March, Bismarck also in North Dakota had record snowfall in December and the second snowiest March, the first year with with two monthly totals in the top ten enlarged here.

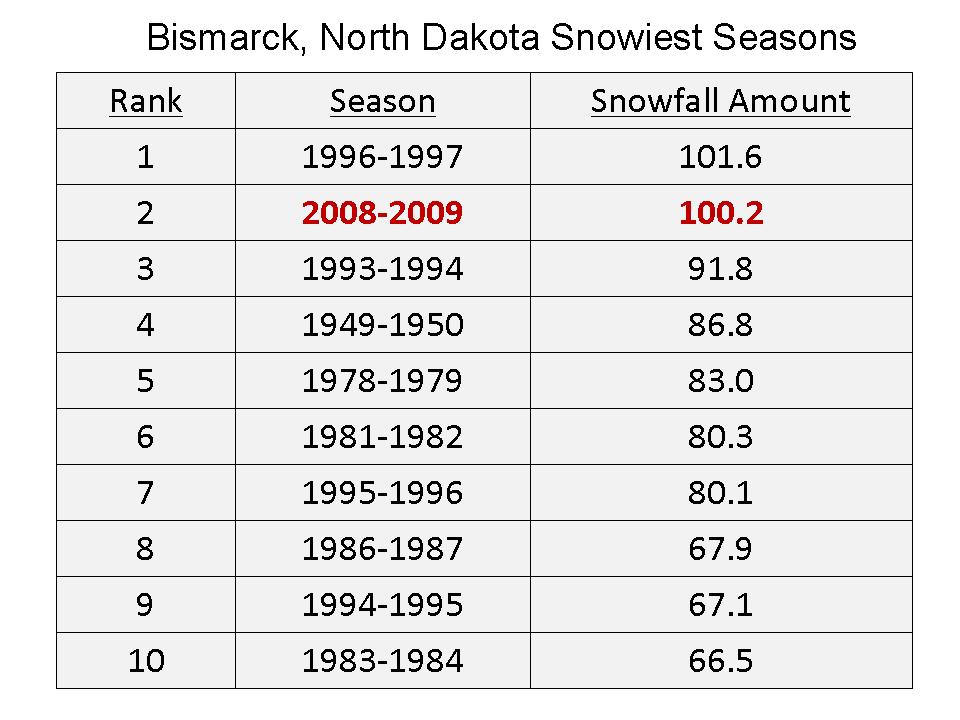
Bismarck is on the northern edge of this storm. If they get more than 1.4 inches of snow from this (or some later) storm, they will set an all-time snow record. See the enlarged listing shown below here as of April 1 after the big blizzard. See all the watches and warnings here.

The National Weather Service said International Falls, with the reputation as the nation’s icebox, recorded 124.2 inches of snow this winter. That tops the old record of 116 inches set in 1995-1996. The nearly 9-inch dump from this week’s snowstorm pushed International Falls over the edge. The Minnesota-Ontario border area has been pummeled with snowstorms this winter.
And from KOMO News Weary Spokane residents who are sick of snow can at least now be consoled by the fact that they were a part of history.
A snow storm on Sunday has made this the snowiest winter on record in Spokane. The National Weather Service said 93.6 inches of snow has been recorded at Spokane International Airport this winter, breaking the record set in 1949-50 by a tenth of an inch. It took snowfall of 3.9 inches of Sunday, a record for the date, to break the all-time record. This is the second-consecutive heavy winter in Spokane. Last year, more than 92 inches of snow fell on the Lilac City, third most since records started in 1893.
Spokane’s Top 5 Snow Years:
RANK WINTER SNOW TOTAL
1 2008-2009 93.6
2 1949-1950 93.5
3 2007-2008 92.6
4 1974-1975 89.0
5 1992-1993 87.3
Spokane is also mired in unseasonable cold. Normal high temperatures at the of March are in the low 50s, but this month has seen highs in the 30s and 40s.
See here how an amazing 358 lowest temperature records and 409 snowfall records were broken for the week ending Apr 2, 2009.
More snow in high latitudes/less snow… Whatever makes you feel better about paying higher taxes.
So how does NASA respond to the data? Latest headline: “Satellites Show Arctic Literally on Thin Ice”.
http://www.nasa.gov/topics/earth/features/arctic_thinice.html
From the article:
“The latest Arctic sea ice data from NASA and the National Snow and Ice Data Center show that the decade-long trend of shrinking sea ice cover is continuing.”
I’m not sure how you determine a trend is continuing when the latest measurement shows a change in direction:
http://www.nasa.gov/images/content/326209main_kwokfig4_226x181.jpg
Snow in Atlanta?
http://www.accuweather.com/news-story.asp?partner=rss&article=5
A little off topic… This from Jennifer Marohasy is very interesting and intuitive:
http://jennifermarohasy.com/blog/2009/04/role-of-water-vapour-in-climate-change/?cp=3
Maybe one of the engineers here can translate it into American.
John H.-55:
Ahhh, yes, I forgot the corrupting, contrarian climate chaos.
Chime in with another tax!
Has nobody noticed that 8 out of the top 10 snowfall years for Bismarck have been in the last three “warmer” decades? Maybe storm track comes into play here?
And since we are talking about snowfall records, Washington DC just finished a third consecutive winter season of single digit snowfall totals. That has never happened in the 100+ year climatological record.
OT: support SOHO at http://mission-madness.nasa.gov/mm/bracket.html
click on SOHO then submit vote !
Weather Report from Houston
As I tell all my Yankee firends, Houston has the morals of Los Angeles and the Climate of Calcutta. And that’s being unfair to Calcutta. We say that in the Fall the mold changes color.
Well, it used to be like that. The economy has put a slight dampener on the shenanagans, and this Global Warming stuff has been fantastic.
This part weekend was sunny and mild, with highs in the upper 70s and low 80s, bright sunshine and brisk northerly winds. Forecast for tonight is a LOW of 36 degrees (a few degrees off the record), with highs in the 70s the rest of the week.
The air this winter has felt like we suddenly gained about 3000 feet in elevation. Everybody’s been out walking their dogs in windbreakers and sunglasses (the people, not the dogs) with big grins on their faces (both people AND dogs).
I understand that Dallas and points north will be seeing record lows tonight, but by the time that Canadian air gets down here to the Gulf, it’s JUST RIGHT.
I think Al Gore needs to hold revival (tent) meetings back and forth across the midwest this summer. Our weather would be fantastic.
Some nice photos of the Mt. Redoubt eruption are found at the Boston Globe’s The Big Picture site.
http://www.boston.com/bigpicture/2009/04/alaskas_mount_redoubt.html
A little OT, but this article:
http://www.cgfi.org/2009/04/02/hemispheric-timing-shows-oceans-are-source-of-co2-by-dennis-t-avery/
Does a nice readable job of pointing out the backwardation of the CO2 effect from the AGW side (with pointers to the science in the footnotes). And this one:
http://www.cgfi.org/2008/03/03/hundreds-more-scientists-have-found-the-1500-year-climate-cycle/
Does a nice job of pointing, gently, to natural cycles (though I do wish he had at least mentioned Bond Events…)
“It took snowfall of 3.9 inches of Sunday, a record for the date, ”
And a foot of Saturday fell in Colorado… 😉 I think you meant “on”…
After a record 2007- 2008 for snowfall in a winter, Madison WI, had a record Dec. this season and was on pace for a new seasonal record until Feb. They’re making another assault on it over recent weeks, however.
Flanagan (22:54:14) : Global warming means more snow at northern latitudes and less snow/more rain around the tropics.
Fascinating. Absolutely fascinating. Such evident self delusion is hard to ignore. MORE snow equals warming? And last time I looked there wasn’t a lot of snow in the tropics to begin with… (Though last winter it did snow in southern Brazil in a way characteristic of winters from 30+ years ago…)
BTW, please look up the works of Milankovitch wherein he shows that the precursor event to the onset of an ice age (glacial) is MORE snow and ice at the north pole. Your thesis that more snow up north means warming is exactly and completely 180 degrees wrong.
(It’s like trying not to watch a car wreck… you know you ought to look away but you just can’t … )
Mike Lorrey (23:11:14) :
See, this is why the watchword is ‘climate change’ not ‘global warming’. Climate change is apparently the only kind of change Obama doesn’t have hope for. Any sort of change is the fault of CO2 pollution and must be fixed with lots of taxes and regulations, while the politically correct climate is one that doesn’t change, like that which exists inside the reality distortion field of Washington DC.
and Columbia University, surely!
“”” Flanagan (00:20:39) :
Graeme Rodaughan
Hotter polar regions means more melting AND more evaporation from the seas (even in the winter). So northern regions below the cloud level should undergo more precipitations (as opposed to very high mountains).
About the clouds: they play a double role. They can reflect part of the sun and altogether absorb IR coming from the surface. It all depends on their composition and/or color. “””
We are talking about climate change; not last night’s weather; so when you talk about clouds (more) you have to presume that you are talking about more clouds for some long enough period to be considered climate and not weather.
Yes, more clouds reflect more sunlight, increasing albedo; a cooling effect.
Yes more clouds absorb ground emitted IR; which warms the atmosphere of the clouds causing a convective updraft that carries that cloud material to higher altitudes where the thermal energy an be lost to space; also a cooling effect.
Yes more clouds block additional solar radiation from reaching the ground; which cools the ground; also a cooling effect,a dn one which lowers the temperature of the surface thereby reducing the emittance of IR from the suface (which those clouds may intercept) another cooling effect.
Net result is that nobody ever obseved the surface temperature to rise in the shadow zone, when a cloud passes in front of the sun; it always gets cooler at the surface; which is where ice and snow co-exist with humans and other living things, and where the catastrophically rising oceans are drowning millions of people ; well so they predict.
More clouds however formed leads to surface cooling; even with last night’s weather; if you have clouds in the sky (or not) of any kind, when the sun goes down the surface gets cooler, and the temperature goes down; it never gets warmer after sunset; unless for some weird weather reason (not climate) you get some Santa ana wind come roaring in with already heated air from somewhere else.
Clouds are ALWAYS negative feedback; particularly on climate time scales.
George
Flanagan (00:20:39) : About the clouds: they play a double role. They can reflect part of the sun and altogether absorb IR coming from the surface. It all depends on their composition and/or color.
Ooh boy… Would those be the blue clouds or the green ones? Or maybe the lavender rather than the chartreuse? …
Last time I looked, water vapor and water droplets were pretty much colorless / white … buy maybe you can show me some colored clouds someday… (And no, I don’t mean white clouds reflecting colored light from elsewhere nor do I mean water droplets acting as a prism… show me the clouds who have a different color such that they have differential light absorption – and this is not smog we’re taking about, it’s good old natural in the sky clouds from water; say in the South Pacific).
Here we go again: http://www.upi.com/Science_News/2009/04/06/NASA-says-arctic-literally-on-thin-ice/UPI-33861239035856/
It’s funny because when I look at the AMSR graph, the ice coverage is higher than average…. and with the predicted cold summer ahead, we should not expect the ice to reach the lower extend either.
DJ (01:27:11) : Meanwhile very long lived ice sheets keep falling off the Antarctic
Snow falls in the interior. It can’t melt because it’s too cold. After enough builds up, it pushes out to sea as a floating ice sheet. When this gets big enough (as it must) to become physically unstable, big rafts break off an float away to melt in warmer places. That is the normal cycle of ice in Antarctica.
It happens on geologic time (not your time, thousands of years time) so you can look at it and be wonderfully mystified or come up with lots of pins to stick into computer dolls / models but it will just do what it does.
If the ice did not break off, it would have to keep extending indefinitely. The clearly can not happen.
BTW, there is a 1500 year climate cycle that we have been in. We warmed over the natural course of that cycle, but it is now reaching it’s end. I had hoped that I could avoid living through the next Bond Event (they typically correlate with cold era’s and social unrest – called a Pessimum
GAK! At this point I was going to include a link to the wiki page on the “Migration Period Pessimum” and the “Iron Age Pessimum” but Migration era pessimum page has been deleted (probably as an embarrisment to AGW…) to I’ll just paste the text of it here (thanks to caching and The Wayback Machine you can not erase my history… nor the PDF on my archival disk…)
Begin Quote from old unmolested Wiki:
Migration Period Pessimum
From Wikipedia, the free encyclopedia
Temperature record of the last 2000 years
The Migration Period Pessimum (also referred to as Dark Ages Cold Period) was a period of cold climate in the North Atlantic region, lasting from about 450 to about 900 AD.[1] It succeeded the Roman Age Optimum and was followed by the Medieval Warm Period.
This Migration Period Pessimum saw the retreat of agriculture, including pasturing as well as cultivation of crops, leading to reforestation in large areas of central Europe and Scandinavia.[2] This period corresponds to the time following the Decline of the Roman Empire around 480 and the Plague of Justinian (541-542).[3] Climatically this period was one of rapid cooling indicated from tree-ring data[4] as well as sea surface temperatures based on diatom stratigraphy in Norwegian Sea[5], which can be correlated with Bond event 1 in the North Atlantic sediments.[6] It was also a period of rising lake levels, increased bog growth and a peak in lake catchment erosion.
[edit]References
Desprat, Stéphanie; Sánchez Goñia, María Fernanda; Loutre, Marie-France (2003). “Revealing climatic variability of the last three millennia in northwestern Iberia using pollen influx data”. Earth and Planetary Science Letters 213 (1-2): 63-78. doi:10.1016/S0012-821X(03)00292-9.
Andersen, S. T.; Berglund, B. E. (1994). “Maps for terrestrial non-tree pollen (NAP) percentages in north and central Europe 1800 and 1450 yr BP”. Paläoklimaforschung 12: 119–134.
Ambrosiani, B. (1984). “Settlement expansion—settlement contraction: a question of war, plague or climate?” In: Morner, N.-A.; Karlén, W. (Eds.), Climatic Changes on a Yearly to Millennial Basis. Dordrecht:Reidel Publishing Company, pp. 241–247.
Eronen, M.; Hyvärinen, H.; Zetterberg, P. (1999). “Holocene humidity changes in northern Finnish Lapland inferred from lake sediments and submerged Scots pines dated by tree-rings”. The Holocene 9: 569–580.
Jansen, E.; Koc, N. (2000). “Century to decadal scale records of Norwegian sea surface temperature variations of the past 2 millenia”. PAGES Newsletter 8 (1): 13–14.
Bond, G.; et al. (1997). “A Pervasive Millennial-Scale Cycle in North Atlantic Holocene and Glacial Climates”. Science 278 (5341): 1257-1266. doi:10.1126/science.278.5341.1257.
The Iron Age Pessimum page still exists, but just to be sure, here is the contents:
Iron Age Cold Epoch
From Wikipedia, the free encyclopedia
The Iron Age Cold Epoch (also referred to as Iron Age climate pessimum or Iron Age neoglaciation) was a period of unusually cold climate in the North Atlantic region, lasting from about 900 BC to about 300 BC, with an especially cold wave in 450 BC during the expansion of ancient Greece. It was followed by the Roman Age Optimum (200 BC – 300 AD).
[edit]References
Gribbin, John; Lamb, H. H. (1978). “Climatic change in historical times”. in Gribbin, J.. Climatic change. Cambridge: Cambridge University Press. pp. 68–82. ISBN 0521215943.
Plunkett, Gill; Swindles, Graeme T. (2008). “Determining the Sun’s influence on Lateglacial and Holocene climates: a focus on climate response to centennial-scale solar forcing at 2800 cal. BP”. Quaternary Science Reviews 27 (1-2): 175-184. doi:10.1016/j.quascirev.2007.01.015.
Swindles, Graeme T.; Plunkett, Gill; Roe, Helen M. (2007). “A delayed climatic response to solar forcing at 2800 cal. BP: multiproxy evidence from three Irish peatlands”. The Holocene 17 (2): 177–182. doi:10.1177/0959683607075830.
Van Geel, B.; Buurman, J.; Waterbolk, H. T. (1998). “Archaeological and palaeoecological indications of an abrupt climate change in The Netherlands, and evidence for climatological teleconnections around 2650 BP”. Journal of Quaternary Science 11 (6): 451-460.
Re: Pamela Gray (05:52:09) :
Your comments directed at DJ and Flanagan are spot on. In addition to other forces operating on Ice sheets, tides rise 50 feet or more at those latitudes. The up and down leverage applied to the bridge linking the sea ice sheets is enormous and a source of cleave/cracks in the ice.
Pamela, on another subject, I am compiling winter precipitation records for mountainous areas of the western US. I suspect you are privy to such information and may have personally compiled data too. If you are willing to share and/or provide sources to specific data sources I will most grateful. you can contact me at; paddy_wagon@comcast.net.
Now, after this detour to preserve history…
As I was saying, I’d hoped to not last through the next Bond Event, however, we have 3 nagging little points:
1) It’s a 1470 year or so cycle and the last one started about 1470 years ago… take a look at what was happening in about 530 to 540 A.D. It was cold, and dark, and the sun wasn’t very bright… In fact, they called it The Dark Ages.
2) The sun has gone very very quiet. Not pleasing in the context of #1.
3) We’ve had a sudden onset of more cold and more snow at the poles with the oceans cooling starting in 2003 (it takes a while to cool a few gigatons of water…)
Now to me it’s pretty clear that we have a very warm ocean (and will for a few more years) especially in the tropics, putting lots of water into the air – being by definition hot and humid, not snowy… That air then hits a very very cold polar region and dumps boat loads of snow. That than accelerates the run to the cold side…
So we will be in this ‘battle ground’ state for a few more years, but only as long as it takes to cool the ocean enough to make us really wish for the good old days of a warm climate with plenty of food to eat.
Please note: Your computer models don’t mean a darned thing if they can not explain Bond Events:
http://en.wikipedia.org/wiki/1500-year_climate_cycle
who’s wiki page also seems to still exist… at least for now.
It is my opinion that we are watching the early stages of an entry into a Bond Event (and will be for the next 30 years or so) and I can only hope that we find a way to mitigate the extreme cold that is headed our way with the attendant crop failures at northern latitudes. We ought to know in about 15 years… geological time is slow like that, even the fast whip of a 1500 year cycle takes decades to observer at the inflection points.
So welcome to “Bond Event Zero” (tm and copyright E.M. Smith) hold on to your hats, it’s going to be a bumpy ride…
FWIW, I’ve also put some of this text and the preserved Wiki pages up at:
http://chiefio.wordpress.com/2009/04/06/bond-event-zero/
where I will be expanding on this topic (and saving more history before the AGW Langoliers get to it…)
DJ (01:27:11) :
“Meanwhile very long lived ice sheets keep falling off the Antarctic…”
How many times in the last, oh say, 5000 years has that happened?
Take your time, no hurry.
If we know this:
“Thicker ice, which survives two or more years, now comprises only 10 percent of wintertime arctic ice cover, down from 30 percent to 40 percent.”
why are those Catlin people out there drilling holes to ‘prove’ the ice is getting thinner?
http://www.upi.com/Science_News/2009/04/06/NASA-says-arctic-literally-on-thin-ice/UPI-33861239035856/
It would appear that the AGW Langoliers have also deleted the Roman Warm Period:
“Roman Warm Period
From Wikipedia, the free encyclopedia
This page has been deleted. The deletion log for the page is provided below for reference.
17:29, 11 December 2008 Andrew c (talk | contribs) deleted “Roman Warm Period” (G7: One author who has requested deletion or blanked the page)”
Guess it’s time to go fishing in the Way Back Machine again…
Might I suggest that WUWT start a history preservation page to hold onto our climate (and cold period…) history while we can? I’m doing what I can, but it would be nice to have “many hands make light work’…
E.M.Smith (11:19:25) : About deletions in Wikipedia
All fanatic movements embark on “cultural revolutions” which try to rewrite history and previous data according to their so called “revolutionary principles”
I presume Fatty Al et Al. have already prepared an “Index”of books to burn.