By Joseph D’Aleo, CCM, ICECAP

Map of US weather records for week ending 4/6/09 click image to enlarge or here for source. Map created by HAMWeather,
UPDATE: NOAA predicts the Red River Will Crest Again in Fargo-Moorhead in Late April here possibly again at records levels.
Just a week after the last major northern plains blizzard another significant snowfall occurred this weekend. Models did poorly with the location of the heaviest snow bands and generally overdid the magnitude. These models sometimes have difficult with the first 48 hours, but Susan Solomon and friends tell us you can depend on cruder models to predict the climate 100 years or even a thousand years in advance.
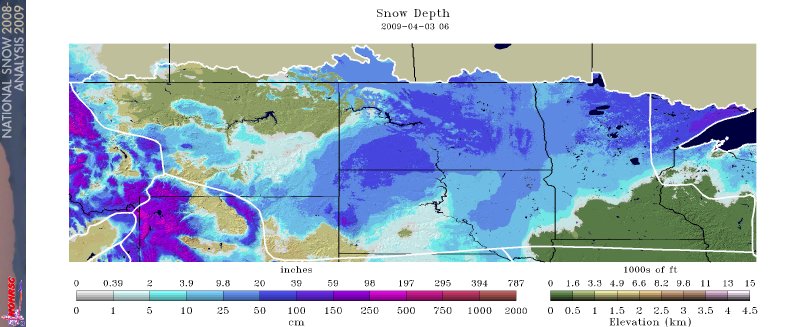
Several inches of snow fell in parts of Nebraska, South Dakota, Iowa, southern Minnesota into southern Wisconsin. This will include parts of the Red River Basin already in flood and with deep snowcover (click here to enlarge).

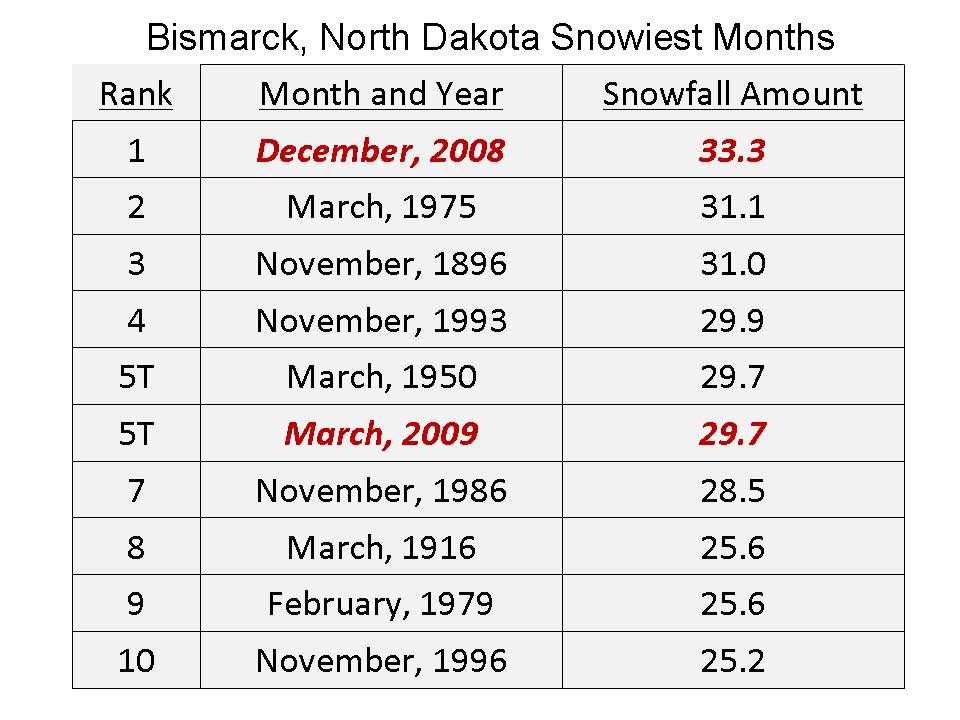
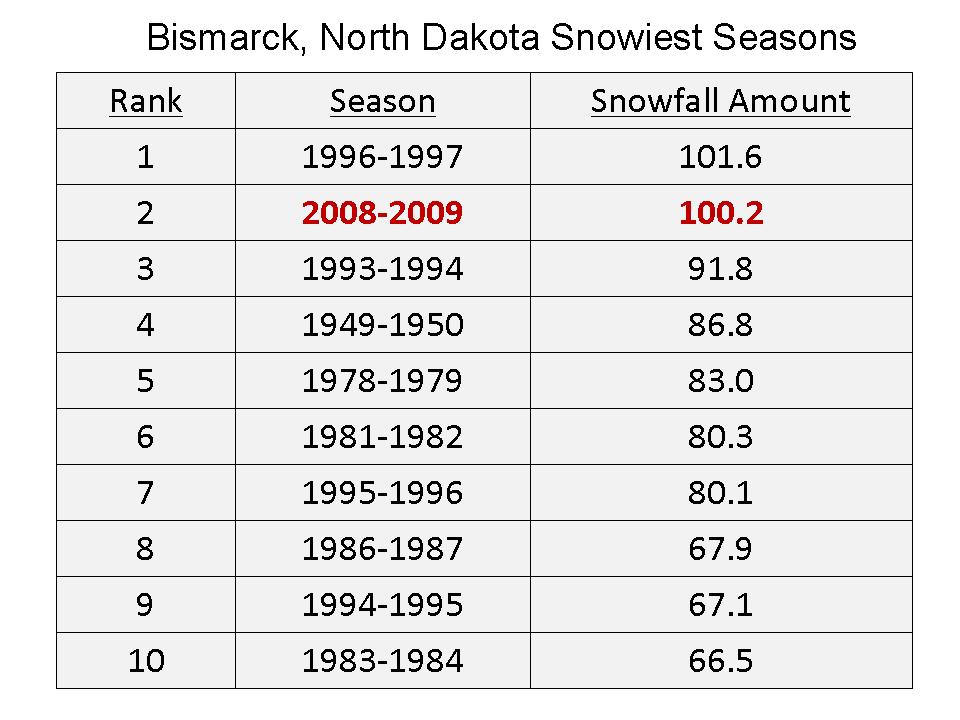
The northern plains has been hit hard this year. Fargo set a record for snowfall and precipitation for March, Bismarck also in North Dakota had record snowfall in December and the second snowiest March, the first year with with two monthly totals in the top ten enlarged here.

Bismarck is on the northern edge of this storm. If they get more than 1.4 inches of snow from this (or some later) storm, they will set an all-time snow record. See the enlarged listing shown below here as of April 1 after the big blizzard. See all the watches and warnings here.

The National Weather Service said International Falls, with the reputation as the nation’s icebox, recorded 124.2 inches of snow this winter. That tops the old record of 116 inches set in 1995-1996. The nearly 9-inch dump from this week’s snowstorm pushed International Falls over the edge. The Minnesota-Ontario border area has been pummeled with snowstorms this winter.
And from KOMO News Weary Spokane residents who are sick of snow can at least now be consoled by the fact that they were a part of history.
A snow storm on Sunday has made this the snowiest winter on record in Spokane. The National Weather Service said 93.6 inches of snow has been recorded at Spokane International Airport this winter, breaking the record set in 1949-50 by a tenth of an inch. It took snowfall of 3.9 inches of Sunday, a record for the date, to break the all-time record. This is the second-consecutive heavy winter in Spokane. Last year, more than 92 inches of snow fell on the Lilac City, third most since records started in 1893.
Spokane’s Top 5 Snow Years:
RANK WINTER SNOW TOTAL
1 2008-2009 93.6
2 1949-1950 93.5
3 2007-2008 92.6
4 1974-1975 89.0
5 1992-1993 87.3
Spokane is also mired in unseasonable cold. Normal high temperatures at the of March are in the low 50s, but this month has seen highs in the 30s and 40s.
See here how an amazing 358 lowest temperature records and 409 snowfall records were broken for the week ending Apr 2, 2009.
jeez (01:33:46): “Or a direct result of extra large ice sheets.”
Nice line, jeez!
Of course, down here in OZ it’s not politically correct to mention any anti-AGW weather events, but we did get news of the Wilkins Ice shelf break-up.
http://www.theage.com.au/environment/antarctic-ice-shelf-near-final-collapse-20090406-9tvx.html
Many local radio media outlets are reporting that the sea level will rise as a result of the already floating ice breaking away. Fortunately the attached article is more accurate on this point. And of course this is directly linked to global warming.
Of course no mention of the overall increased sea ice extent in Antarctica over the past decades, currently well above the 20 year average.
Flanagan,
Need to double check your data about increased snowfall in S America during an El Nino. Don’t think it has actually happened.
The more general theme of this web page is that the evidence for warming is weak. It hasn’t warmed recently, satelite data indicate it has cooled over the last 10 years, the temperature “proxies” showing warming are problematic (I’m being generous with this comment) and, as Anthony has documented, the ground based data is highly unreliabel. Finally, even this very questionable ground data appears to have been subjected to manipulation to get the desired results.
Flanagan (00:20:39) : “About the clouds: they play a double role. They can reflect part of the sun and altogether absorb IR coming from the surface. It all depends on their composition and/or color.”
Studies indicate that most clouds are very dark at night but also very effective at reflecting sunlight. This leads to generally cooler temperatures than those recorded under cloudy but brighter daylight conditions.
/sarc
DJ
“Meanwhile very long lived ice sheets keep falling off the Antarctic”
Of course they do, nothing lives/lasts forever, not even an ice sheet.
Flanagan and DJ,
Get rid of your electric blankets and get in touch with the real world.
Infact DJ if these ice sheets never broke off that could only mean one thing, they continued to grow, and I don’t think you or I would want to live in that world would we.
Flanagan (22:54:14) :
Steven: Global warming means more snow at northern latitudes and less snow/more rain around the tropics. Please stop bringing forward half-truths like these ones.
————-
Yep, that might be true. Which might mean that, in northern latitudes, albedo effects start occurring, glaciers start advancing and that may have a knock-on effect on climate there and, ergo, at lower latitudes.
I think we’re talking about evolutions. Glaciers advancing and retreating before starting to advance again. Temperatures going up and down around a mean, and occasionally having a step-change shift of the mean.
What I never see being discussed is whether we understand how to recognise the signals which precipitate a step-shift in mean vs the signals consistent with a stable state oscillation around a mean.
Is that because we don’t know them or because it doesn’t suit scientists to tell the truth to anyone else?
I just looked at that like to ‘The Age’
“Scientists have been warning of danger to the peninsula ice shelves since March 2002 when the collapse of Larsen B took away 3250 square kilometres of 220-metre thick ice in just 35 days.”
Is that true? 220-meters thick? In 35 days? I guess I’ll have to google that one but The Age did the due diligence already right?
Flanagan,
which IPCC assessment reports do you read?
In the 4th IPCC assessment report, Section 14 (North America) the word snow is mentioned 38 times. I did not find any comments about increase in snow in North America. However, I found a couple of other comments:
“In Canada, warming from 1900 to 2003 led to a decrease in total precipitation as snowfall in the west and Prairies”
“Rising temperatures will diminish snowpack and increase evaporation, affecting seasonal availability of water.”
“The North American snowmobiling industry (valued at US$27 billion) (ISMA, 2006) is more vulnerable to climate change because it relies on natural snowfall. By the 2050s, a reliable snowmobile season disappears from most regions of eastern North America that currently have developed trail networks…”
“Warmer or less snowy winters will likely reduce delays, improve ground and air transportation reliability, and decrease the need for winter road maintenance (Pisano et al., 2002).”
“Warming, and changes in the form, timing and amount of precipitation, will very likely lead to earlier melting and significant reductions in snowpack in the western mountains by the middle of the 21st century (high confidence.”
So which way it is (by IPCC assessment reports), more snow in North America or less snow.
From the article referred to by DJ at 01:27:11:
“Scientists have been warning of danger to the peninsula ice shelves since March 2002 when the collapse of Larsen B took away 3250 square kilometres of 220-metre thick ice in just 35 days.”
So, the ice we are talking about is 220 meters thick and we are supposed to think that the break-up is due to global warming induced melting?! Some other forces have to be involved…
Other guys with electric blankets:
http://www.newsmax.com/insidecover/climate_change_lobby/2009/04/02/199192.html
Ok so The Age ommitted the hedge. Very interesting langauge here too though ‘global warming had a major part… but is only one in a number of contributoryy factors…’ Reminds me of financial analysts who are so determined to make a call they’ll ignore anything that undermines them, however ‘major’.
“Professor Glasser acknowledges that global warming had a major part to play in the collapse, but emphasises that it is only one in a number of contributory factors, and despite the dramatic nature of the break-up in 2002, both observations by glaciologists and numerical modeling by other scientists at NASA and CPOM (Centre of Polar Observation and Modeling) had pointed to an ice shelf in distress for decades previously. “It’s likely that melting from higher ocean temperatures, or even a gradual decline in the ice mass of the Peninsula over the centuries, was pushing the Larsen to the brink”, said co-author Ted Scambos of University of Colorado’s National Snow and Ice Data Centre.”
Shoveled out about 7 inches so far this morning here in Michigan, and its still coming down. On the bright side, I promised my son that when I get home from work today, we get to make another Snow Bunny like we did last year on the Saturday before Easter.
Anthony, perhaps there would be some way for all of us to email our April Snow photos to and create a webpage about that?
P.S. Go Michigan State Spartans!
I did not miss your point, Steven Goddard.
The AGW High Command has decreed exactly as you stated it.
Add droughts, floods, hurricanes, etc.
Never mind that the Sun is comatose, well beyond anything seen in at least 200 years. The Globe is doing anything but warming, and the Sun is doing anything but being normal.
And oh, by the way, were it not for ice breaking off and sailing into the briny, the Titanic would have been just another ocean liner.
If it were 1912 again (aah… that cooling period) we could rename the ship the AGW HanGore, courtesty of IPCC lines.
Both the former and the latter take thier passengers to their doom.
Just pop on down to the seashore, folks, and have a quick look at your handy stick for measuring sea level. Please be sure to check that you have your micrometer packed. You’ll need it.
“Hotter polar regions means more melting AND more evaporation from the seas (even in the winter)”.
Yes Flanagan … lots of evapouration from the poles in winter … the polar areas are covered with ice in winter!!!
Or as a result of more snow at some time in the past, increasing the flow of glaciers that feed the icesheets, thus pushing more ice out further onto the sea.
Just because we’re witnessing such event currently, doesn’t mean that they’re extraordinary on a geological timescale.
Facts are very confusing and inconvenient. Why can’t we just stick with computer models? I’ve programmed mine for a very nice day tomorrow.
Flanagan
Ta’ for your reply. So to extrapolate, global warming (as per the IPCC I’m assuming) is forecast to result in more snow for both the northern and southern latitudes?
Perusing a map it appears that, as an earlier poster expressed, apart from the northern/central Andes (equador, peru, bolivia), the general topography of the tropics does not seem conducive to snowfall so I am not sure how applicable such a forecast is.
Hasn’t there been a long term trend in global warming? Aren’t the real questions why and are there really any runaway tipping points? Also, just wondering, if slightly warmer temps allow for more snowfall due to the slightly warmer air being able to hold more moisture, but it still being cold enough for snow, how is that a catastrophe? ( aside from those who have to shovel it 🙂 )
Re: Ice Sheets Falling
Ice sheets doing anything (cracking, expanding, dancing, reciting poetry, even just being there or not being there) at any particular time or place is the proverbial case of Anectdotal Evidence. Who cares?
Andrew
Off topic but just saw where Obama wants to put restrictions on Antarctic tourism .He says its to minimize oil spills and and to be for peaceful and guarantee freedom for scientific investigations.In other words they don’t want anyone to see how large the ice is or how far it has advanced.That would ruin global warming .
just a bit of advice, I live in England and it only really snows when it is cold (different type of latitude?) it certainly doesn’t snow when it s warmer i imagine parts of america experience similar conditions.
furthermore to you original point this year simply wasn’t warmer than many preceding ones and neither was last year the result has been heavy snowfalls- as far as i can tell the same in europe,
so as far as i can tell colder=snowier in many parts of the world……
(the desert of the antarctic is so cold that only the warmest air makes it there before precipitation ocurrs or there is a certain minimum moisture in the air that reaches those areas
DJ – “… a direct result of warming.”
And if you link actual data (instead of hype) here: http://nsidc.org/data/seaice_index/images/daily_images/S_daily_extent_hires.png
… you’ll see that this is in fact the only place on the entire continent that the ice sheet is inside the recent trend line. In fact, approximately 10% of the ice edge is inside the trend line but 90% of the ice edge well exceeds the ice line. And if you go here: http://nsidc.org/data/seaice_index/images/daily_images/S_timeseries.png
… you’ll see that current sea ice in Antarctica currently exceeds the average for this date by about a million square kilometers of ice.
So, please, tell us, is the article you referenced (presumably previously unbeknownst to you) a cherry-picked, alarmist piece of propagandist rhetoric about warming in Antarctica that focuses on 10% of the data and ignores the 90% that would tend to undermine its agenda or am I somehow mistaken?