
The DMSP satellite is still operating, but the SSM/I sensor is not
Regular readers will recall that on Feb 16th I blogged about this graph of arctic sea ice posted on the National Snow and Ice Data Center sea ice news page. The downward jump in the blue line was abrupt and puzzling.

Click for larger image
Today NSIDC announced they had discovered the reason why. The sensor on the Defense Meteorological Satellite Program (DMSP) satellite they use had degraded and now apparently failed to the point of being unusable. Compounding the bad news they discovered it had been in slow decline for almost two months, which caused a bias in the arctic sea ice data that underestimated the total sea ice by 500,000 square kilometers. This will likely affect the January NSIDC sea ice totals.
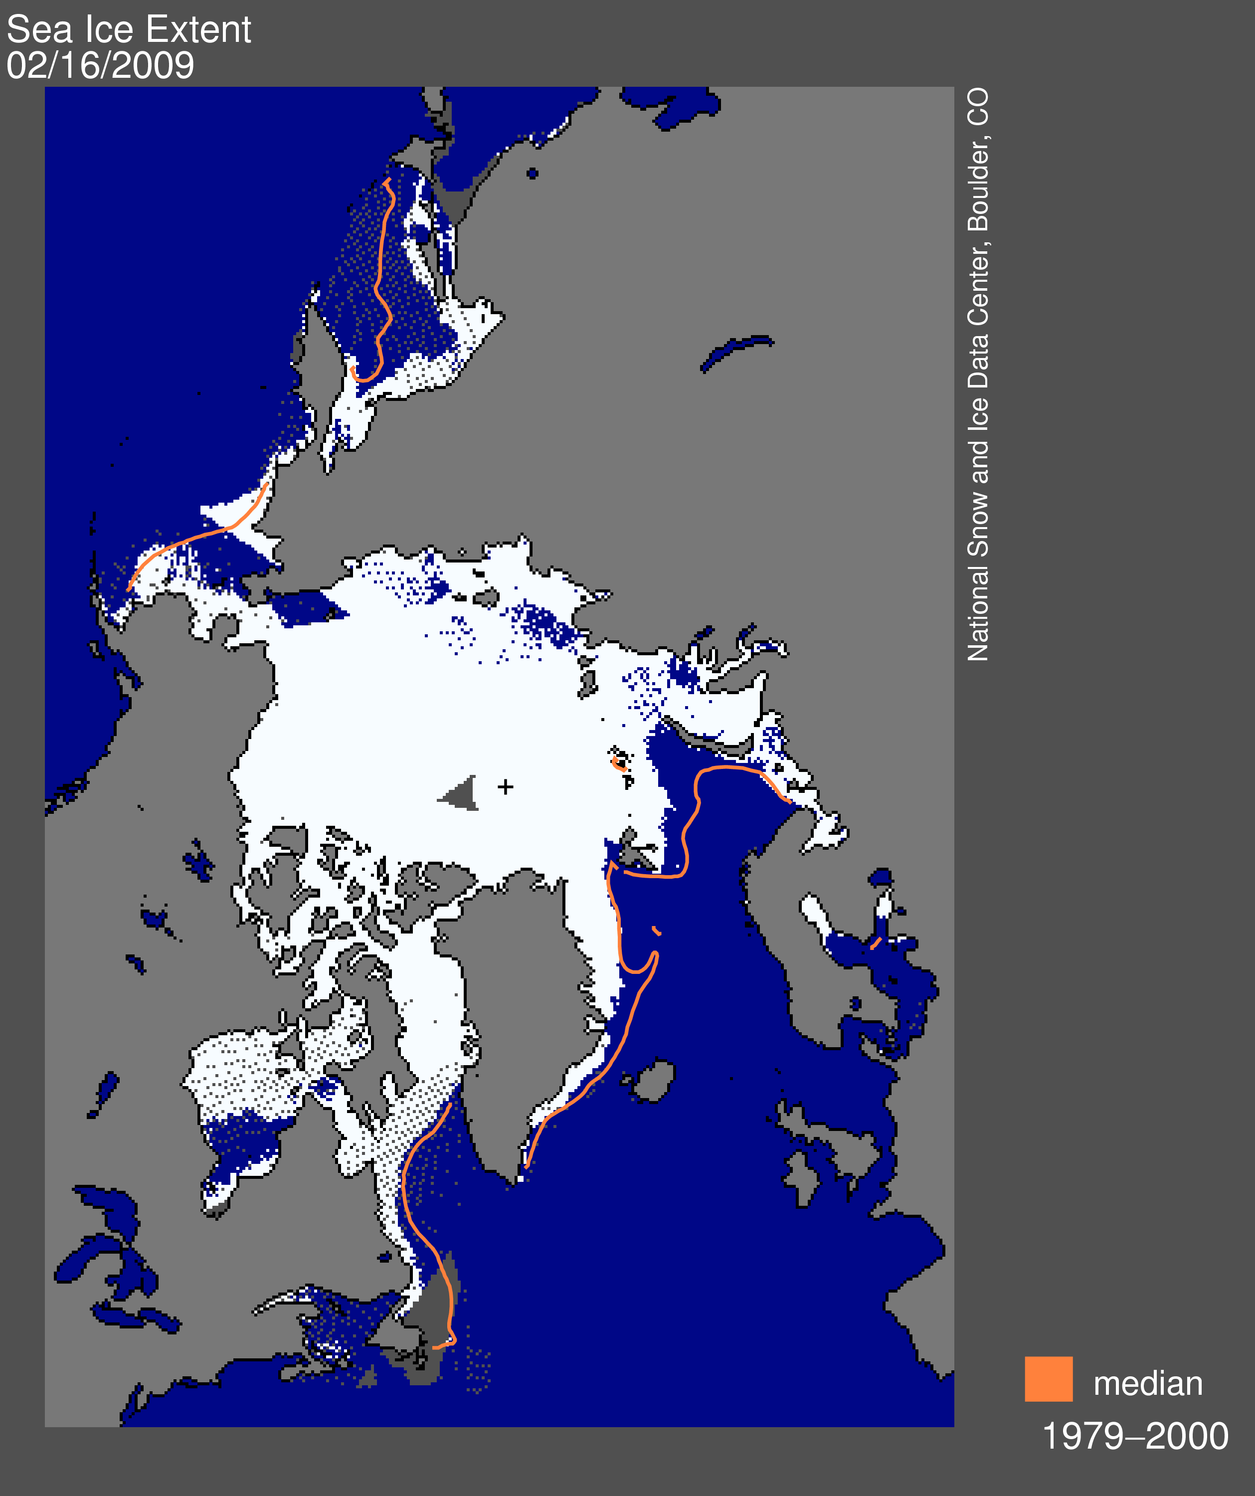
Figure 1. High-resolution image Daily Arctic sea ice extent map for February 15, 2009, showed areas of open water which should have appeared as sea ice. Sea Ice Index data. About the data. Please note that our daily sea ice images, derived from microwave measurements, may show spurious pixels in areas where sea ice may not be present. These artifacts are generally caused by coastline effects, or less commonly by severe weather. Scientists use masks to minimize the number of “noise” pixels, based on long-term extent patterns. Noise is largely eliminated in the process of generating monthly averages, our standard measurement for analyzing interannual trends. Data derived from Sea Ice Index data set.
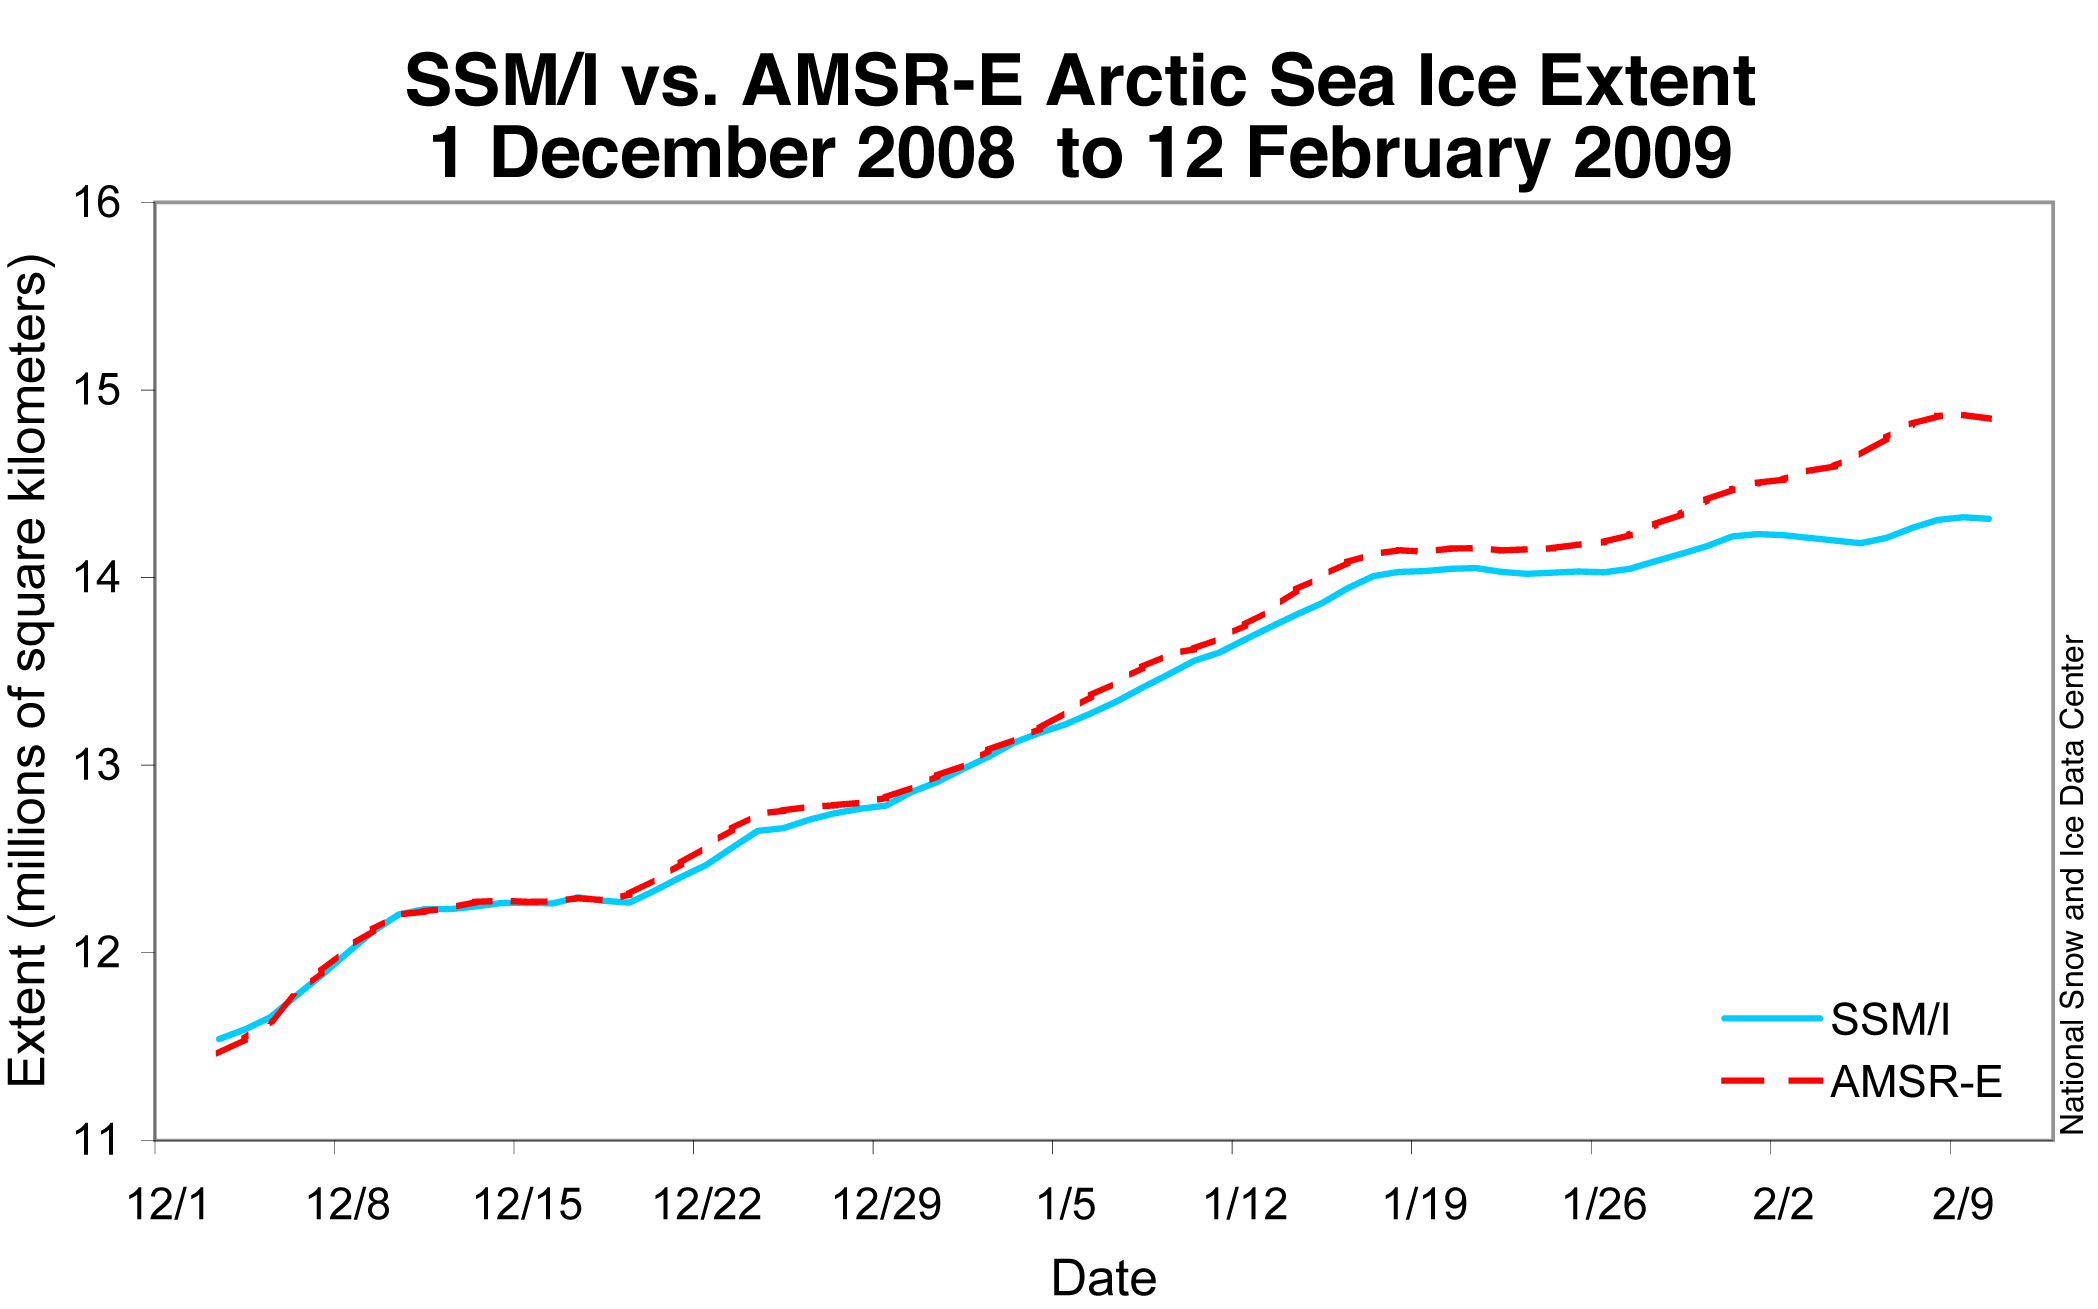
Figure 2.
High-resolution imageDaily total Arctic sea ice extent between 1 December 2008 and 12 February 2009 for Special Sensor Microwave/Imager SSM/I compared to the similar NASA Earth Observing System Advanced Microwave Scanning Radiometer (EOS AMSR-E) sensor. —Credit: National Snow and Ice Data Center
Dr. Walt Meier of NSIDC had planned to do a guest post here on WUWT, but this evening, with the magnitude of the problem looming, he’s asked to defer that post until later. I certainly can’t fault him for that. He’s got his hands full. Hopefully they have a contingency plan in place for loss of the sensor/space platform. I applaud NSIDC for recognizing the problem and posting a complete and detailed summary today. I’ve resposted it below in its entirety. Note that this won’t affect other ice monitoring programs that use the Advanced Microwave Scanning Radiometer (EOS AMSR-E) sensor, which is on an entirely different platform, the AQUA satellite.
UPDATE: 2/19 Walt Meier writes with a clarification: “One detail, though perhaps an important [one]. I realize that it is bit confusing, but it is just one channel of the sensor that has issues. And it isn’t so much that it “failed”, but that quality degraded to the point the sea ice algorithm – the process to convert the raw data into sea ice concentration/extent – failed on Monday.” – Anthony
From NSIDC Sea Ice News:
As some of our readers have already noticed, there was a significant problem with the daily sea ice data images on February 16. The problem arose from a malfunction of the satellite sensor we use for our daily sea ice products. Upon further investigation, we discovered that starting around early January, an error known as sensor drift caused a slowly growing underestimation of Arctic sea ice extent. The underestimation reached approximately 500,000 square kilometers (193,000 square miles) by mid-February. Sensor drift, although infrequent, does occasionally occur and it is one of the things that we account for during quality control measures prior to archiving the data. See below for more details.
We have removed the most recent data and are investigating alternative data sources that will provide correct results. It is not clear when we will have data back online, but we are working to resolve the issue as quickly as possible.
Where does NSIDC get its data?
NSIDC gets sea ice information by applying algorithms to data from a series of Special Sensor Microwave/Imager (SSM/I) sensors on Defense Meteorological Satellite Program (DMSP) satellites. These satellites are operated by the U.S. Department of Defense. Their primary mission is support of U.S. military operations; the data weren’t originally intended for general science use.
The daily updates in Arctic Sea Ice News & Analysis rely on rapid acquisition and processing of the SSM/I data. Because the acquisition and processing are done in near-real time, we publish the daily data essentially as is. The data are then archived and later subjected to very strict quality control. We perform quality control measures in coordination with scientists at the NASA Goddard Space Flight Center, which can take up to a year. High-quality archives from SSM/I, combined with data from the earlier Scanning Multi-channel Microwave Radiometer (SMMR) data stream (1979–1987) provide a consistent record of sea ice conditions now spanning 30 years.
Data error sources
As discussed above, near-real-time products do not undergo the same level of quality control as the final archived products, which are used in scientific research published in peer-reviewed journals. However, the SSM/I sensors have proven themselves to be generally quite stable. Thus, it is reasonable to use the near-real-time products for displaying evolving ice conditions, with the caveat that errors may nevertheless occur. Sometimes errors are dramatic and obvious. Other errors, such as the recent sensor drift, may be subtler and not immediately apparent. We caution users of the near-real-time products that any conclusions from such data must be preliminary. We believe that the potential problems are outweighed by the scientific value of providing timely assessments of current Arctic sea ice conditions, as long as they are presented with appropriate caveats, which we try to do.
For several years, we used the SSM/I sensor on the DMSP F13 satellite. Last year, F13 started showing large amounts of missing data. The sensor was almost 13 years old, and no longer provided complete daily data to allow us to track total daily sea ice extent. As a result, we switched to the DMSP F15 sensor for our near-real-time analysis. For more information on the switch, see “Note on satellite update and intercalibration,” in our June 3, 2008 post.
On February 16, 2009, as emails came in from puzzled readers, it became clear that there was a significant problem—sea-ice-covered regions were showing up as open ocean. The problem stemmed from a failure of the sea ice algorithm caused by degradation of one of the DMSP F15 sensor channels. Upon further investigation, we found that data quality had begun to degrade over the month preceding the catastrophic failure. As a result, our processes underestimated total sea ice extent for the affected period. Based on comparisons with sea ice extent derived from the NASA Earth Observing System Advanced Microwave Scanning Radiometer (EOS AMSR-E) sensor, this underestimation grew from a negligible amount in early January to about 500,000 square kilometers (193,000 square miles) by mid-February (Figure 2). While dramatic, the underestimated values were not outside of expected variability until Monday, February 16. Although we believe that data prior to early January are reliable, we will conduct a full quality check in the coming days.
Sensor drift is a perfect but unfortunate example of the problems encountered in near-real-time analysis. We stress, however, that this error in no way changes the scientific conclusions about the long-term decline of Arctic sea ice, which is based on the the consistent, quality-controlled data archive discussed above.
We are actively investigating how to address the problem. Since we are not receiving good DMSP SSM/I data at the present time, we have temporarily discontinued daily updates. We will restart the data stream as soon as possible.
Some people might ask why we don’t simply switch to the EOS AMSR-E sensor. AMSR-E is a newer and more accurate passive microwave sensor. However, we do not use AMSR-E data in our analysis because it is not consistent with our historical data. Thus, while AMSR-E gives us greater accuracy and more confidence on current sea ice conditions, it actually provides less accuracy on the long-term changes over the past thirty years. There is a balance between being as accurate as possible at any given moment and being as consistent as possible through long time periods. Our main scientific focus is on the long-term changes in Arctic sea ice. With that in mind, we have chosen to continue using the SSM/I sensor, which provides the longest record of Arctic sea ice extent.
For more information on the NSIDC sea ice data, see the following resources on the NSIDC Web site:
- Sea Ice Index
- Why is the Sea Ice Index product used to study sea ice?
- Do your data undergo quality control?
Jeff (09:46:00) :
Except that the graph in Dr. Meier’s post shows that the AMSR-E sea ice extent
was virtually the same as the SSM/I sea ice extent until sometime in January.
I agree, Jeff, and that’s all I meant – that there was probably something that Dr. Meier did not like at least right then in his above statement about AMSR-E, as derived simply from what he said right then in the quotation, without looking at anything else. I didn’t look, mostly because at first the graph wouldn’t download for me. I was just looking at words. As to what happens next, I just hope we don’t have to go through yet another round of Mannian reconstructions.
hunter (08:53:59) :
The pooint is that
1) the data source is no longer credible
Which data source would that be.
I repeat part of my earlier post looking at 2 data sources:
Please have a look at this comparison between AMSRE (JAXA site) and SSM/I (NSIDC) This compares monthly averages back to 2002. In general the AMSRE data is smaller than the NSIDC and the only significant time it is larger is in Sept 2008 when it is 170,000 sq km larger. A difference of 3.5% larger compared to AMSRE area at that time.
http://img16.imageshack.us/img16/9782/ssmiamsrerz8.jpg
There seems to be no significant drift visible in earlier data. There is an obvious difference in the algorithms used to genereate the 15% sea ice areas.
So its official – we can no longer trust any of the data.
i do not traduce the hard work of all involved – but we have been given data as fact and now we see how easy it is for that data to be so much junk.
Again, thank you for Dr. Meier for listening and taking action. I look forward to reading your guest post.
Anthony, someone commented about the possibility of restricting the length of comments. Please don’t. I learn so much from the longer, complex scientific comments. I wish I could add such relevant content myself, but my skills are limited to the tangible realm. If we do end up with another ice age, I’ll know which food crops to grow and how, and I’ll make sure we’re clothed and fed, that our homes are insulated properly and the flues draw.
thefordprefect (03:24:29) :
http://news.nationalgeographic.com/news/2000/12/122900inuits.html
Global Warming Melts Inuit’s Arctic Lifestyle
Lisa Krause (July 12, 2000)
Traditionally, the 130 members of the Inuit community of Sachs Harbor, located on the western tip of Banks Island in the Canadian Arctic, supported themselves through age-old patterns of hunting, trapping, and fishing. Recently, however, members of the community have taken on a new role: climate-change observers.
You’re data is outdated, see below. Apparently, as the polar bears moved north, they took 8 residents with them. Excuse me for being crass, but institute cap and trade for 122 people?
Sachs Harbour is a hamlet located in the Inuvik Region of the Northwest Territories, Canada. Situated on the southwestern coast of Banks Island in Canada’s Northwest Territories the population according to the 2006 census count was 122 people.[1]
Has it been confirmed whether the same sensor issue affects also Antarctica?
http://nsidc.org/data/seaice_index/images/daily_images/S_timeseries.png
It seems so to me….
What George Will wanted to say: “At the END of 1979 the size of the sea ice was equal to the size at the END of 2008”.
What he said: “At the beginning of 1979 …. at the beginning of 2009”.
The first version seems to be correct (an equal anomaly of about -0.5 million sq km).
The second is wrong.
the fordprefect,
We know that the land stations are not reliable.
That has been very well documented here.
We now know that the ice data is not reliable.
That is what this thread is about.
We know that GISS data has not been trustworthy for quite awhile.
The human interest story you posted is simply not credible, by the way.
The ice loss image now looks like an ink blot butterfly
http://arctic.atmos.uiuc.edu/cryosphere/IMAGES/arctic.jpg
bluegrue (08:04:38) :
You may want to have a closer look. I did not find the data, so I took the image, enlarged it and cut and pasted together the relevant parts. One day comparisons don’t prove a difference (the alleged “cherrypick” is the date of publication), but the data confirm the conclusion. Here’s 1979 and the last few years, blue is the sea ice area. Here is the collage:
http://i43.tinypic.com/rhlbat.jpg
I’d be interested to get your definition of “at the same level”, Philip_B.
——————————
Different Philip_B here, by the way..
The Daily Tech article came out on January 1st so, using the exact same logic as Cryosphere, they chose the data at that time – which was probably December 31st, 2008 or maybe within a week prior to that. As you can see from your enlargement, but better still, from the lower red trace on the same graph, the levels of sea ice were identical at that time. This seems pretty newsworthy to me, and is probably why the article was written.
hunter (12:30:15) :
the fordprefect,
We now know that the ice data is not reliable.
comparison between AMSRE (JAXA site) and SSM/I (NSIDC) shows no significant drift between the two. Are you suggesting 2 satellites 2 different detectors are drifting simultaneously?
Have they tried thumping it?
HasItBeen4YearsYet? (09:32:59) :
This is sea ice concentration for a given location, not area or extent.
It would be good, if Dr. Meier could address this aspect in his article, too.
Here’s how I read this. The sensors have a resolution of about 25km x 25km, IIRC. Each of these squared makes up one grid point. The 5%-10% error refers to the error in sea ice concentration for each individual grid point. This error does not translate one to one to error in area, as only those grid points that are at the threshold to be counted as ice or water are affected. So yes, there is an error in the area, but it is far less than 5-10%, as most of the grid points counted as ice have much larger concentrations than the threshold value.
MartinGAtkins (14:08:35) :
Have they tried thumping it?
Do you mean percussive maintenance? I can see it now; a robotic arm with a rubber fist fitted to all new satellites for just such an occasion. Of course it would need its own control system… maybe a Wii nunchuck?
@ur momisugly philincalifornia (13:36:56) :
Sorry, you are confusing two articles here. In the passage, you have quoted above Cryosphere Today addresses an op-ed by George Will in the Washington Post on February 15, 2009, see below for more. The “Statement related to Daily Tech article of January 1, 2009” is exactly that, addressing an article by Michael Asher entitled “Sea Ice Ends Year at Same Level as 1979”, published in Daily Tech on January 1, 2009.
The op-ed by George Will, was published in the Washington Post on February 15. A copy of Will’s op-ed can be found here. He writes
“Now” as in “today, February 15, 2009” or as in “this winter season”. Compare minimum extension and the point is made.
It is disingenuous to compare transients as Asher does, as in this case the timing of sea ice increase and decrease within the season plays a major role. It weakened “Cryosphere Today”‘s argument to fall into the trap of doing a single day comparison, however mid-February happens to be near the annual minimum of global sea ice area. Compare the minimum values and tell me we are back to 1979 levels. Always keep in mind, this is area, not volume. 1979 was thick multi-year ice, 2009 is for large parts thin, one-year ice.
@ur momisugly Anthony
As you can see above, once more I have managed to botch an HTML tag. There is a WordPress plug-in that gives readers a live preview of their post, so they/I can catch these errors much better.
http://wordpress.org/extend/plugins/live-comment-preview/
Could you consider to give it a try?
REPLY: for the thousandth time, this website is free hosted on wordpress.com. They do not allow me to install plugins. People, I know you want preview but get over it. Not gonna happen until I move off to a dedicated server…and I’m not ready to do that. I have enough work as it is without adding server management to it. – Anthony
I am sorry, Anthony, I missed that. My mistake.
bluegrue (15:05:50) :
@ur momisugly philincalifornia (13:36:56) :
Sorry, you are confusing two articles here. In the passage, you have quoted above Cryosphere Today addresses an op-ed by George Will in the Washington Post on February 15, 2009, see below for more. The “Statement related to Daily Tech article of January 1, 2009″ is exactly that, addressing an article by Michael Asher entitled “Sea Ice Ends Year at Same Level as 1979”, published in Daily Tech on January 1, 2009.
The op-ed by George Will, was published in the Washington Post on February 15. A copy of Will’s op-ed can be found here. He writes
According to the University of Illinois’ Arctic Climate Research Center, global sea ice levels now equal those of 1979.
“Now” as in “today, February 15, 2009″ or as in “this winter season”. Compare minimum extension and the point is made.
It is disingenuous to compare transients as Asher does, as in this case the timing of sea ice increase and decrease within the season plays a major role. It weakened “Cryosphere Today”’s argument to fall into the trap of doing a single day comparison, however mid-February happens to be near the annual minimum of global sea ice area. Compare the minimum values and tell me we are back to 1979 levels. Always keep in mind, this is area, not volume. 1979 was thick multi-year ice, 2009 is for large parts thin, one-year ice.
—————————————
I didn’t confuse the two articles. I was fully on top of them both. We don’t know exactly to which point George Will was referring in his article. It would seem from his conclusion that it was likely to be December 1979 and December 2008. I agree that the use of transients is not the best method, but I myself was struck by the essentially exact match of sea ice levels in those two years.
Can you point me to a good, real reference on ice volume, or is that statement just from a hypothetical or a model ?? Let’s face it when the planned studies on ice thickness and volume are completed (this year?) we know exactly what their “data” will say. I could probably write the abstract and preordained conclusions for them today, along with the newspaper headlines.
Anyway, perhaps our initial disagreement is mooted by the fact that the sensors appear to have been dysfunctional for who knows how long ??
Mike Borgelt (05:04:44) :
Beat off polar bears with shotguns? A shotgun is likely to only irk a polar bear. A .50 cal Barrett semi auto rifle is more like it.
Actually, yes, that is what they do. Use a shotgun to simulate a hive of bees attacking the bear (couple hundred shot hitting simultaneously), and the bears cut & run. I hear it’s quite effective.
Can ANYBODY tell me if there is any substance to the increase of cosmic rays (as in the levels reported by the Neutron Monitors) causing increased damage/shorter life span of space-borne instrumentation?
Carsten Arnholm, Norway (11:22:10) :
It appears to be the case. I only have a graph up to the end of January.
http://s599.photobucket.com/albums/tt74/MartinGAtkins/?action=view¤t=antarctic.jpg
Data Here:-
http://tinyurl.com/brv38c
I have spent my entire life working with extremely sensitive instrumentation, from ion chambers. photomultipliers, gamma spectrometers, IR analysers, magnometers, gas chronometers, cryogenic neutron detectors, scintillation detectors, and on and on. All of these devices require rigorous programs to detect and correct for instrument drift. Without an effective program, received data is only so much DANGEROUS garbage. This might be excusable, if the error existed for minutes, hours or possibly days, but for weeks, possibly months or more, is incredible. It is indicative of systemic incompetence which would seem incongruous with the space program. It would be akin, to blaming the recent nuclear sub collisions, on compass drift. Try explaining to a cop that you were driving at 120 mph in a 30 mph zone due to speedometer drift. I find the laissez faire attitude of the scientific community incredulous. What if this had been a missile launch detection channel.
I for one, will be demanding a full scale, transparent, investigation into what is going on and who is responsible. Dr. Walt Meier has much more explaining to do!
Robert Bateman (20:04:12) Here in western Colorado, the DOW hands out shotgun shells with rubber shot. At 10 yds a round to the tush works well from personal experiance. Actually, just yelling and making a lot of noise usually works. I ran into problems with ‘relocated’ bears that had caused problems elsewhere in more populated areas. They are tagged and sent to the sticks. They learn that trash cans and birdfeeders are food sources, and seek them out. I was getting bears with two tags that didn’t care a wit about noise. I wondered if the DOW was hoping that someone out here would just shoot them so they wouldn’t have to deal with them anymore.
philincalifornia (19:48:32) :
The op-ed was published on February 15. Any reader would have assumed that “now” is either today or this season, in the latter case it would have to be something significant like minimum extent or such. Why on Earth, should any reader not familiar with the data come to the idea, that “now” is meant to be the exact date December 31?
As long as there is an overlap in data range and a few weeks jitter in the freeze/thaw cycle, this is inevitable. Let me illustrate this with some made-up data, values for mid-month:
Year X Year Y
Sep 16 14
Nov 17 15
Dec 14 14
Jan 10 12
Feb 12 8
Mar 14 10
Year Y has lower maximum and lower minimum area. They still have exactly the same area in mid-December. The only difference is that year X had its minimum earlier. Would you consider this significant? Would you consider the description “area in year Y is at the same as the year X”? This is the kind of cherry-picking done by Asher, and possibly parroted by Will.
Area is smaller, thickness is less (from declassified submarine data). Hard to miss the conclusion of volume loss. You won’t go anywhere without at least some modeling. There’s an essay on NOAA on the topic. Or you could just go for primary literature by a search on scholar.google for “sea ice volume”. Has Arctic Sea Ice Rapidly Thinned? in Journal of Climate looks interesting, keep in mind it’s from 2002 and only covers data up to 1997. It finds that in 2000 volume was comparable to 1950s levels (it was up during the 60s and 70s), but shows a deep decline during the last two decades (16% to 25% from 1987 to 1997). From my reading of more current data, this trend should hold in this century, too.
It happens. Not to the egregious level you describe, but it happens. I was pulled over for doing 65 in a 55, when my speedometer read 56. Had it put on a dynamometer and the speedometer was off by 9 mph at 60 mph. Whether it was always that way, I don’t know. I would guess not since I hadn’t gotten pulled over a lot.