Guest post by Steve Goddard
UPDATE 1-15-08:
I tried an experiment which some of the null questioners may find convincing. I took all of the monthly data from 1978 to 1997, removed the volcanic affected periods, and calculated the mean. Interestingly, the mean anomaly was positive (0.03) i.e. above the mean anomaly for the 30 year period.
This provides more evidence that normalizing to null is conservative. Had I normalized to 0.03, the slope would have been reduced further.
Yesterday’s discussion raised a few questions, which I will address today.
We are all personally familiar with the idea that reduced atmospheric transparency reduces surface temperatures. On a hot summer day, a cloud passing overhead can make a marked and immediate difference in the temperature at the ground. A cloudy day can be tens of degrees cooler than a sunny day, because there is less SW radiation reaching the surface, due to lower atmospheric transparency.
Similarly, an event which puts lots of dust in the upper atmosphere can also reduce the amount of SW radiation making it to the surface. It is believed that a large meteor which struck the earth at the end of the Cretaceous, put huge amounts of dust and smoke in the upper atmosphere that kept the earth very cold for several years, leading to the extinction of the dinosaurs. Carl Sagan made popular the idea of “nuclear winter” where the fires and dust from nuclear war would cause winter temperatures to persist for several years.
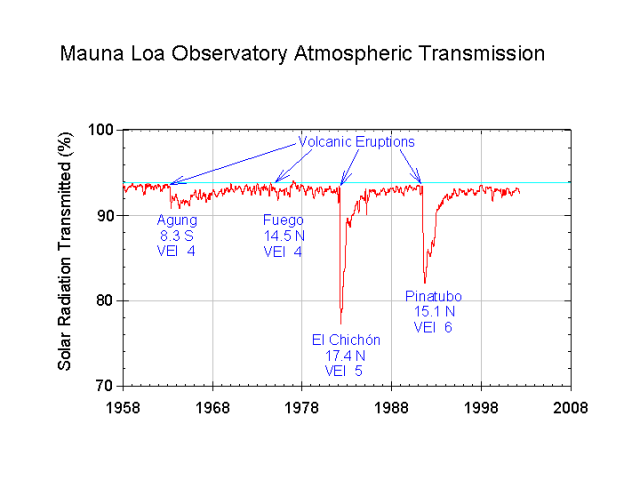
Large volcanic eruptions can have a similar effects. This was observed in 1981 and 1992, when volcanic eruptions caused large drops in the measured atmospheric transmission of shortwave radiation at the Mauna Loa observatory. These eruptions lowered atmospheric transmission for several years, undoubtedly causing a significant cooling effect at the surface. At one point in late 1991, atmospheric transmission was reduced by 15%. An extended period like that would lead to catastrophically cold conditions on earth.
In recent years, there has been a lot of interest in measuring how much warming of the earth has occurred due to increased CO2 concentrations from burning fossil fuels. This is difficult to measure, but one thing we can do to improve the measurements is to filter out events which are known to be unrelated to man’s activities. Volcanoes are clearly in that category. In yesterday’s analysis, I chose to null out the years where atmospheric transparency was affected by volcanic eruptions, as seen in the image below. Atmospheric transmission is in green, and UAH satellite temperatures are in blue.
Atmospheric transmission in green. Monthly temperature deviation in blue, with overlap periods nulled out.
The question was raised, why did I null out those periods?
I made that decision because the null level is the mean deviation for the period, and because that is the most conservative approach. As you can see in the image below, there is a large standard deviation and variance from month to month, which makes other approaches extremely problematic. There were also corresponding El Ninos during both of the null periods, which would have been expected to raise the temperature significantly in the absence of the the volcanic dust. Had I attempted to adjust for the El Nino events, the reduction in slope (degrees per century) would have been greater than what I reported. This is because the temperature anomaly during each El Nino would have been greater than zero (above the null line.)
Due to the large standard deviation and large monthly variance, any attempt to calculate what the temperature “should have been” in the absence of the volcanic dust would likely introduce unsupportable error into the calculation. One can play all sorts of games based on their belief system about what the temperature should have been. I chose not to do that, and instead used the mean as the most conservative approach.
There is no question that the volcanic dust lowered temperatures during those periods, and because of that the 1.3C/century number is too high. My approach came up with 1.0. A reasonable ENSO based approach would have come up with a number much less than that. If you take nothing else away from this discussion, that is the important point.
UAH, with non-nulled temperatures in green.
Furthermore, it is also important to realize that the standard approach of reporting temperature trends as linear slopes is flawed. Climate is not linear, which is why Dr. Roy Spencer fits his UAH curves with a fourth or fifth order function, rather than a line.
I’m really starting to think that the temp trends are much flatter than advertised, something I wouldn’t have imagined even a year ago.
What adds to the conclusion of this post is the discontinuity in RSS from my last post. If you look only at the trend of the sat records, removing the discontinuity the average for RSS and UAH is only about 0.011 C/year for the LT. This should be 1.2 times the ground data.
Dr. John Christy UAH read my last article and provided an additional paper from 07 which confirms this discontinuity is the primary point of disagreement between RSS and UAH. What’s more the disagreement is resolved by checking radiosonde data leaving UAH as the superior measure.
After review of the data and the effects of the discontinuity, it is pretty obvous to me now that the flatter UAH trend is at this point more correct. Just cutting out the section of disagreement and averaging the remaining slopes puts the LTroposphere satellite slope at only 0.011 C/year which is very close to UAH 30 year trend of 0.127 C/decade.
http://noconsensus.wordpress.com/2009/01/15/1853/
Just to quibble for a moment, but wasn’t Nuclear Winter disproven because Sagan et al had calculated it based on force exchange that resulted in nothing but ground bursts (which produce LOTS of particulates/fallout) using weapons in the mutli-megaton range? This despite the fact that only hardened military targets (bunkers etc) would be ground-burst targets as well as the doctrine shift to smaller blast yields (standard Soviet and American was somewhere in the range of 550kT IIRC) using more efficient targeting vehicles due to improved technology. The days of the Tsar Bomba were long over.
I still wondering about the logics behind the reasoning.
If you leave out a natural cooling effect from a series of temperatures that shows a upward trend, then I think you must end up with a faster increasing trend !
It sounds complete unlogical to me that our planet warms up slower when one could take away the natural cooling events ?
Although the mathematics in these articles do give the reported results, these results appear to me contradictionary to the common sense that skipping a cooling fase must lead to a faster warming.
Sorry, but I think applying the reported mathematics on a series of global temperatures is scientific not justifiable or defendable.
Steve Goddard
I’m not sure if you can answer this question, but what is the possibility to accurately model the volcano-affected years. I would have thought this would be relatively straightforward since NASA claim to have successfully modeled the Pinatubo cooling. In fact, the Pinatubo event is often used to justify GCM predictive skills.
The only other issue would be the ENSO effects which were positive either during or immediately after both eruptions. During 1982/83 there was a particularly intense El Nino, while ther were moderate El Ninos in 1991/92 and 1993.
In both cases, the affected periods would, without the volcanos, have likely included local temperature maximums, and, apart from the 1998 spike would leave the long term plot looking virtually flat.
Steve
Something else this analysis points out is that there is a better way to control global warming. If man-made global warming exists, and I emphasize IF, and it is deemed a serious problem by a true consensus of rational experts, then the way to correct the problem may be to effect the albedo of the earth rather than totally rearrange the world’s economies. Whereas the idea of injecting SO2 into the upper atmosphere may sound ridiculous, when placed alongside the current plan of spending trillions of dollars on a solution that is not really a solution, it sounds extremely logical.
‘Albedo’ is a word which eventually all citizens must come to understand. It is a fudge factor that will allow almost any interpretation to be placed on climate processes. It is fortunate that we have such things as discrete vulcanism to provide something on the order of a controlled experiment.
===========================================
Steve, your nulled out periods are still way too long. They need to be 1 and 2 yrs as per your Wiki chart.
Willem de Rode wrote:
I still wondering about the logics behind the reasoning.
If you leave out a natural cooling effect from a series of temperatures that shows a upward trend, then I think you must end up with a faster increasing trend !
It sounds complete unlogical to me that our planet warms up slower when one could take away the natural cooling events ?
If you remove the natural cooling in the past, then the remaining signal is warmer. To give a numerical example, if the natural cooling resulted in an anomaly of -5 of the “normal” in the past and the present temperature anomaly is +5 (for a spread of 10), removing the natural cooling signal results in 0 anomaly (i.e., “normal”) in the past and therefore a spread of only 5, instead of 10.
Willem de Rode (00:59:26) :
“It sounds complete unlogical to me that our planet warms up slower when one could take away the natural cooling events ?”
Willem, it is the effect of WHERE in the timeline the cooling events have been zeroed out. Since both eruptions take place early in the time line, the zeroing out has effect of “warming up the past”. Thus, the overall observed warming trend flattens out – it’s still ending up in the same place, but the starting point is now higher than it was.
Personally, I think this a perfectly valid exercise. If Steve had decided to give the zeroed out periods a value higher than zero (as other have pointed out, the eruptions would have been “masked” an underlying warming trend) then the result would be a further flattening of the observed warming trend, making it approach zero, which is closer to the truth.
John J (03:10:17) :
It is my firm belief, bolstered by many of the things I have read on this subject over the years, that there is nothing to fix. I cringe every time I read of some grand plan to fix global warming (which I contend is entirely a social delusion, and not a fact of science) such as dumping scrap iron in the ocean to help algae fix more CO2, or to put aerosols into the atmosphere to reduce shortwave radiation from the Sun, or spraying water (a powerful GHG) into the air to cool it. Fixing a problem that does not exist is a recipe for disaster. None of these schemes have been thought through enough. Like the attempts to fix wildlife “problems” by controlling one species to favour another, we prove time and again that we are not capable of grasping the balance of nature, and create problems worse than the ones we thought we were solving (see Yellowstone, Australia, or Macquarie Island).
Honestly, we live on an ice planet that has occasional and brief periods of warmth. It is a bistable chaotic system that is in a cold phase for longer periods of time than in a warm phase, and we have people worrying it is “too warm”. I say, enjoy it while it lasts, because it won’t last forever. If anything is sure, we WILL experience another ice age (probably not within our lifetimes), as sure as the sun rises each morning.
The better approach is to just leave the data out for the volcano years not make it zero. Making them zero will artificially lower the absolute magnitude of the slope as well as decrease the standard deviation of the data. A plot of the slopes versus the number of months/years dropped from the data may be interesting.
Willem de Rode ,
If we eliminate the effects of these two eruptions our starting point for temperature change is raised. This then reflects a lower rate of change to get to the temperatures we show today. If we accept this lower rate of change as real, then the AGW alarmists are wrong and we are not effecting the natural climate change as fast as they say we are.
What I don’t understand is why the AGW alarmists like to point out the so called “masking” of global warming by these eruptions. If that is correct and Steve is right then my first paragraph holds true and they fall on their own sword. Of course they do argue that using the lower temperatures created by the eruptions incorrectly lowers the average temperature for the chosen period. But I think they are mixing apples and oranges as one point addresses rate of temperature change over the period and the other addresses the average temperature over the period.
So, is the peanut gallery learning or do I need to sit quietly with muted fingers?
while on the topic of temperatures…
All In
http://sciencepolicy.colorado.edu/prometheus/all-in-4873
It is a bit early in the year to staking out a position in the race for boneheaded move of the year in the climate wars, but NASA GISS has done just that but doubling down on its prediction that 2009 or 2010 will be the warmest on record. One might think that the surprising 2008 global temperatures (i.e., surprising to folks making short-term predictions at least) would motivate some greater appreciation for uncertainty. Not so. Here is what NASA GISS says:
. . . in response to popular demand, we comment on the likelihood of a near-term global temperature record. Specifically, the question has been asked whether the relatively cool 2008 alters the expectation we expressed in last year’s summary that a new global record was likely within the next 2-3 years (now the next 1-2 years). . . Given our expectation of the next El Niño beginning in 2009 or 2010, it still seems likely that a new global temperature record will be set within the next 1-2 years, despite the moderate negative effect of the reduced solar irradiance.
did you notice that last part….
“despite the moderate negative effect of the reduced solar irradiance.”
i thought solar irradiance was irrelevant with respect to climate variation??? 😉
Willem de Rode (00:59:26) :
Although the mathematics in these articles do give the reported results, these results appear to me contradictionary to the common sense that skipping a cooling fase must lead to a faster warming.
Sorry, but I think applying the reported mathematics on a series of global temperatures is scientific not justifiable or defendable.
I’m not sure whether the posts which have addressed your query have clarified things for you, but you might do well to consider the possibility that the problem lies with your understanding rather than the mathematics.
I can follow the way of thinking that say that leaving out the vulcano induced cooling periods will bring up the start of the temperature line so that the trend towards the end becomes flatter (slower warming up)
But still I am not convinced that this way of doing is valid in this case. By simply ignoring the cooling events we also ignore the cumulative effect. If the world did not undergo a cooling effect during a certain period, then after that period the remaining temperature would be higher. The starting temperature after the cooling period will be higher without the actual cooling. And this is not taken into account by simply leaving out the cooling and not correction the temperature after that.
Let me better explain (sorry I am very bad in English) by simulating the world by a glas of water. If we take two glasses and fill them with water of the same tempeature. We place the two glasses into the same (high) temperature circumstances. The temperature of the water in both glasses will rise but will be identical.
Now we take one glass and put it for 1 hour in the fridge (to simulate the volcanic cooling). If we take the glass out of the refridgirator the temperature of the water will be lower than the temperature of the water in the other glass.
We now put again the two glasses in the same (high) temperature conditions.
The temperature of the water in both glasses will rise. But the glass that has undergone a cooling event will show during long time a lower temperature than the glass that did not undergo this cooling event.
Even if we try to calculate the (theoretical) temperature of the cooled glass we will end up lower than the actual temperature in the non-cooled glas if we just ignore the cooling and do the calcualtions with the temperature after the cooling being identical with the temperature just before cooling.
The non cooled glass did accumulate heat during the cooling period of the other. If we would like to simulate the temperature without the cooling phase by justignoring the cooling, then we must correct the other (younger) data as well because by not cooling the earth did not loose temperature and will be warmer. All following temperature influencing events will start with a warmer earth….
So to end…if El Chichon and Pinatubo did not errupt the global temperature would be higher than now. Yielding the same trend in warming only the same temperature will be reached a bit later.
So we are looking at the influence of two volcanoes. Two that we know about as they occured on 29% of the earth’s surface, the land.
So how many volcanoes occured under the sea in the other 71% of the earth’s surface and how much is their influence is built into the science and the models?
No bwainer:
Steve, your nulled out periods are still way too long. They need to be 1 and 2 yrs as per your Wiki chart.
It could be argued that there should be some kind of “step” for the 3 years…more cooling the first year, a bit less the second, etc. The 2nd eruption is so close to the mid point of the graph as to have little affect on the trend. This will be an interesting to look at in 5-10 years as these events move to the left end of a 30 year trend.
Maybe Lief can answer this, but can the temperatures be recalculated based on the atmospheric transmissions? Am I in the the wrong ballpark saying a drop of 10% will drop the temperature .1c?
A little anecdote on fixing the climate. Some time back the Vice Chair of the IPCC, the Russian academician Yuri Izrael, told the press that ‘global warming’ was over-hyped. He was part of the Russian science fraternity that advised Putin not to sign Kyoto because the science was dodgy (many solar scientists in Russia talked of imminent cooling). As we know Putin eventually signed – and Russia stands to make a lot of money selling carbon credits. Izrael went quiet. His Institute is now researching spreading sulphur at high altitude – perhaps a hefty grant from the Kremlin keeps him too busy to comment publicly these days.
OK, I am still confused. Why did my kids get sunburnt on completely overcast day?
Doesn’t any significant reduction in the “unexplained” warming trend make the relative contribution of other non-CO2 factors to any warming trend more significant and therefore they need to be explicitly included in the GCMs?
I maintain that simply substituting zero for the volcano periods is not a good choice, as it represents the mean temperature for the period 1978 to Dec 1998, which is obviously depressed by the volcanoes themselves and it does not cover the last decade of the trend period.
As an alternative I took the average anomaly for the three years before and after each of the volcano periods (where available) then averaged the 2 averages [IYSWIM] as a reasonable estimate of the uninfluenced temperature in the period, this gave infill values of -0.0946 for El Chicon and +0.046 for Pinatubo. Not a big difference, however substituting these in gives a trend of 0.12C / decade for the whole UAH record. This compares well with the IPCC modelled trend of 0.135 C / decade for the period 1990-2010 and the IS92a BAU scenario.
http://www.grida.no/CLIMATE/IPCC_TAR/WG1/552.htm
There is no perfect way of doing this but I think these choices are at least as legitimate, arguably more so, than just whacking in a zero.
BTW fitting a line to data does not necessrily imply that you believe the data has a linear trend; it just enables you to see if values are rising or falling, on average.
You can’t “remove years” from the analysis. That would make the slope artificially steep, and the data set meaningless.
Nulling does have the effect of flattening the slope, and is nearly identically to what a normal Gaussian distribution around the trend would have produced. If you look closely at the UAH data, you can see that the period from 1978-1997 had a small slope, and should be represented that way.
If earlier temperatures are artificially low, that increases the slope – just as artificially high temperatures later in the time period would do.
Brooklyn Red Leg (00:54:43) :
Just to quibble for a moment, but wasn’t Nuclear Winter disproven because Sagan et al had calculated it based on force exchange that resulted in nothing but ground bursts (which produce LOTS of particulates/fallout) using weapons in the mutli-megaton range?
You’re almost remembering correctly. The TTAPS team ran a variety of scenarios. Sagan picked the worst case of the worst cases to popularize in his appeal for unilateral U.S. disarmament. (Apparently he believed Soviet nuclear weapons wouldn’t contribute.) Subsequently, the rest of the TTAPS group distanced themselves from Sagan.
The technical flaws were:
1. The assumption that all particulates would go into the stratosphere.
2. Atmospheric persistence would be many years (I think 5).
3. All bursts would be ground bursts.
4. All target areas would have fuel equivalent to a mature forest or modern suburb.
5. Assumptions about the albedo of the particulates were too high.
The only beneficial outcome was funding for a lot of research into the persistence of particulates in the atmosphere.
In particular, and of relevance here, only the particulates in the stratosphere will have enough dwell time to affect weather. Turbulence of the tropopause and the physical size of the particulate determine dwell time. (Particulates below the tropopause settle out within hours.)
The maximum dwell for particulates above the tropopause is a few years. Particulates on the order of 100 microns settle out within a few days, on the order of 10 microns within a few weeks, and so on. All particulates will have settled out within 24 to 36 months.
Fallacy. No, it cannot imply faster warming unless you extend the graph back in time to contrast with earlier temperatures – and then you’d have to take away earlier volcanic cooling events that affected those temperatures too.
Overall, the trend would be flatter because these eruptions have a cooling influence – which is the party bag for you to take home.
Note that AGW proponents also claim AGW warming due to CO2 happened, and disproportionately so compared to earlier years, in the period under observation.
It is therefore significant according to AGW “unlogic” (unlogical is not a word, btw) if the removal of cooling due to volcanic activity would result in a flatter trend at this time in particular.
John Finn,
Good question about modeling the effects of the volcanoes. There are good radiative transfer models in existence which can fairly accurately model the SW and LW effects of aerosols at different levels in the atmosphere. Someone has probably applied those to the volcanic aerosols from these eruptions at one point or another.