The UAH Satellite Temperature Record With Volcanic Noise Outliers Filtered Out
A guest post by Steven Goddard
I’ve often wondered what the UAH global temperature record would look like if the cooling effects of the eruptions of El Chichón in April, 1982 and Mount Pinatubo in June, 1991 were removed. Large volcanic eruptions shoot fine ash up to very high altitudes, which makes the upper atmosphere less transparent, allowing less sunlight (SW radiation) to reach the lower atmosphere. This has a noticeable cooling effect on the lower atmosphere and the earth’s surface which can last for years, as can be seen in the figures below. Note how the lower troposphere temperatures were depressed during periods when the atmospheric transmission was also depressed.
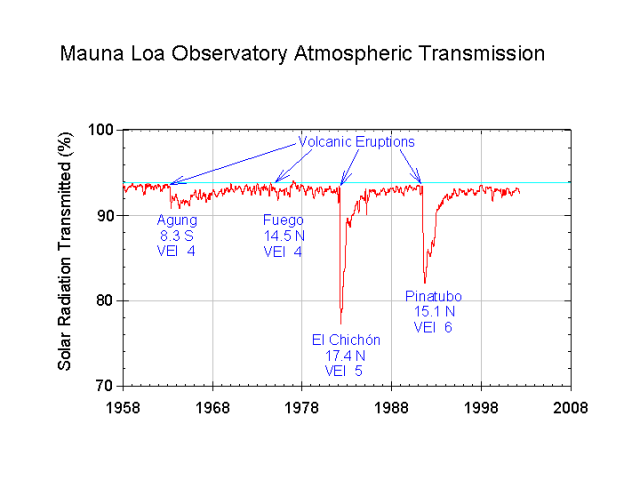
http://upload.wikimedia.org/wikipedia/commons/9/9c/Mauna_Loa_atmospheric_transmission.png
Next let’s look at the UAH satellite record:
http://www.woodfortrees.org/plot/uah/from:1978
Volcanic events are not related to man’s activities, and should not be included when calculating anthropogenic global warming trends.
My experiment was simple enough. I took the UAH monthly data and nulled out the periods of low atmospheric transmission (April 1982-December 1985) and (June 1991-December 1994.) In other words I set those months to zero anomaly. This is a reasonable approach, because zero anomaly is what UAH considers to be the mean temperature for the period. Using Google Spreadsheet’s linest() function, I then calculated the trend. With the volcanoes removed, the global warming trend dropped from 1.3 degrees per century to 1.0 degrees per century.
A far cry from the 6+ degrees at the high end of the IPCC scenarios.
What also becomes apparent from this graph is that recent lower troposphere temperatures have dropped back to near the 1978-1997 baseline. 2008 monthly temperatures averaged slightly lower than 1980 temperatures.
I do have a question. I was looking at http://www.volcano.si.edu/world/largeeruptions.cfm?sortorder=desc
its a list of Large Holocene Eruptions, why did you pick the eruptions you did to take out and ignore the others? I realize they were larger than the others but there are blocks of years without and the occasional ‘big one’.. interestingly enough there was a 6 year “break” between 1994 and 2000.. It would be interesting to see if blocks of years without eruptions sported higher temps then the surrounding time lines or if the carry over effects from El C. were enough to keep temps down. It would also be interesting to see how specific volcanos effect different parts of the world climate wise..
I do applaude you’re efforts though. Its nice to see a scientist thinking outside the GW box:)
What folly this has become. If we humans are responsible for only about 12 parts per million of the CO2 in the atmosphere, how then are we to reduce our emissions to get less CO2 by more than 25 parts per million (required by the Kyoto Treaty)?
If I use 40 gallons of gasoline per month, can I then reduce my use of gasoline by 100 gallons per month? If I consume 2 pounds of food per day, can I reduce my food consumption by 5 pounds of food per day?
It is indeed a pity that our public school system stopped teaching simple arithmetic so many years ago. All of these grand theories (actually, not even decent hypotheses, at best, wild eyed speculations) and it is clear that these “scientists” can’t comprehend simple arithmetic.
These natural events have been going on throughout history. There is no way that humans can in any way exert control over them. What CO2 we humans produce is no more than a fart in a windstorm relative to what nature produces.
Oh, I get it. These PhDs have no useful work they can be employed at. So then what? I guess that huge research funding needs to be provided so that studies can be made as to how to cap these erupting volcanoes and sequester the CO2 they produce. Madness indeed.
‘I am wondering about the effects of the precipiated ash, similarly to Bruce (09:12:47), but further, what happens when it falls onto the ground and water,…’
A long this line of questioning
This well is a very general question. Ash, like any organic solid particle, will absorb short wave radiation, block short wave radiation reaching the surface which cools the surface. If that layer the ash was in the upper atmosphere, would that show up as a “hot spot”? And, as that layer of ash descended toward the surface (assuming convection was shut off) wouldn’t that “hot spot”, at some point in time, be picked up by the surface weather stations?
No they don’t assume changes solely due to human influence, but they believe that human influence is overwhelming the natural variation.
LarryOldTimer says:
And, if pigs had wings then they could fly. However, in the real world, we are currently responsible for about 100 ppm of excess CO2 in the atmosphere above pre-industrial levels. And, in fact, we have emitted enough CO2 through the burning of fossil fuels to raise the concentration in the atmosphere by 200 ppm; fortunately, natural processes (mainly uptake by the oceans and plants) have absorbed about half of it.
Also, I am not sure how you calculated what the Kyoto treaty requires in terms of a reduction in CO2 levels. All that Kyoto requires is a certain reduction in emissions for the 2008-2012 timeframe relative to the 1990 timeframe. It will not reduce the amount of CO2 in the atmosphere but will, at best, slow the rate of increase (or maybe the rate of the rate of increase…depending on what the nations that don’t have limits under Kyoto do).
If you are coming to conclusions such as this, perhaps it should be a hint that the problem may lie more with your misunderstanding than with some inability of scientists to do arithmetic!
That graph clearly shows that the last 5 years have been much hotter than any other 5 year period in the record and it also shows that the most recent temperature are a long way above those at the start of the series (despite “la Nina” and a cold sun ATM). It is also evident that a trend line shows a very strong warming trend.
This post has succeeded in showing that the UAH data shows a warming planet.
Here’s how I would have done it:
http://i44.tinypic.com/fvlocm.jpg
But it looks like the results are the same as what Steven Goddard came up with, as far as overall effect on the trend is concerned.
My Dear Larry,
By the reasoning of the European Union here, and what seems to be the emerging Obama establishment, you do indeed have to reduce your present consumption of 40 gallons of petrol a month by 100 gallons. At least. Ah, the blessings of scientific government.
On topic, if a decent bang from a volcano produces enough ash high in the atmosphere to reduce the effect of sunlight, does that blanket of ash add, if only a little, to the so-called greenhouse effect?
It takes time for the ash ejected into the stratosphere to propagate across the entire hemisphere, and even longer for it to propagate across the equator.
Couldn’t you examine the temperature profiles for the hemisphere opposite the eruption and use that to establish an interpolation rule?
John Phillip is close to what I would (have) done. It is iterative. You set the slope for the excised data to equal the slope computed. I am assuming you are using OLS. Set the del to be 0.0001and reiterate until met or less than. Keep in mind that an assumption is that it is linear, etc.
However, I think that in and of itself, it is interesting that it should remind posters of certain attributes of trends. We have heard from several about “cherry picking” start and end dates. I agree. However, a more subtle point is what happens when the cooling occurs near the beginning and/or warming at the end of a time series by data manipulation, or vice versa. You can also, for example, say that natural forcings were according to a certain period and use that as a baseline, in which case the difference of assumed natural versus what is attributed to man also suffers from the same problems.
However, as posted above, the elimination or quantification of the natural signal such that the antropogenic signal can be determined is what the IPCC is allegedly doing.
Joel Shore (13:29:00)
‘…..concentration in the atmosphere by 200 ppm; fortunately, natural processes (mainly uptake by the oceans and plants) have absorbed about half of it.’
Good. More plant food. Less fertilizer needed by farmers.
Joel Shore (13:29:00)
None of that matters. Why? Because carbon dioxide is not harmful, it is beneficial. CO2 has been much higher in the past. The current extremely low levels are not a problem. At all.
Jeff Id says:
I do find it strange that a correction to resolve a discrepancy between the two satellite datasets lowers the trend in both. I suppose this is because you really resolved the discrepancy by relying on a 3rd data set (the surface temperatures), but color me skeptical of this result.
You may find it of interest to lookat this paper by Spencer and Christy: http://www.devilskitchen.net/dk_blog/2007_christy_tropics.pdf, who compared the RSS and UAH data sets for the tropics specifically (where the trend disagrees most dramatically). They also note that most of the difference in the trends can be accounted for by a shift between them that seems to be “broadly occurring in 1992”. (They then go on, not surprisingly, to make arguments as to why they believe that this shift is due to a problem in the RSS dataset and that their UAH dataset is more correct.)
Smokey says:
And, sea levels have been tens of meters higher too, which is also not any sort of problem…unless you are one of the hundreds of millions of people who live this close to see level. And, for that matter, there have been supervolcanoes and major asteroid impacts and all sorts of things…so apparently these aren’t anything to worry about either!
Basil (13:37:34) :
Here’s how I would have done it:
http://i44.tinypic.com/fvlocm.jpg
But it looks like the results are the same as what Steven Goddard came up with, as far as overall effect on the trend is concerned.
Removing the volcanoes changed the linear trend from 12.7C/decade to 9.9C/decade. Wow ! Get a cork (a big one).
This topic brings up (yet again) the problems associated with any warming or cooling effect. If volcanoes have a net cooling effect then over the centuries the earth would become a giant ice globe. Since this has not happened then one of two things is most likely true. 1) Volcanoes have any identical warming effect (what is the probability of this?). Or, 2) the earth’s climate has a thermostat (chaotic attractor).
I think 2) is far more likely because it also handles all the other potential warming and cooling effects. In other words, nature has built in feedbacks that prevent the earth from cooling too much or warming too much from this attractor state.
If this is true the concept of positive feedbacks to AGW is extremely unlikely. I would think climate scientists would start from this likely situation and try to determine exactly what these effects are. Outside of a few who have publicly disagreed with CAGW it appears few of the others are up to the task.
As for GCMs … they should also be built with this as a point of validity. Without it there is a distinct probability they are wrong and these developers are pretty much wasting their time.
Mike McMillan (14:55:43) :
Removing the volcanoes changed the linear trend from 12.7C/decade to 9.9C/decade. Wow ! Get a cork (a big one).
Yeah, she’s gonna blow.
Okay, let’s divide those numbers by 10.
Feel safer now?
No, divide by 100.
What time is it? I need some sleep.
Here’s my try at time aligning the charts –
http://i40.tinypic.com/2629x0x.jpg
Off topic but,
Science is clear and technology available,
The loss of 20-30% of ‘original’ forest cover by 1990 is responsible for nearly 45% of the increase in atmospheric CO2 observed since 1850 (Malhi et al., 2002).
http://www.globalcanopy.org/main.php?m=5&sm=24&ssm=68&artid=38
Let’s be clear about the timelines if there is any adjustments to be made.
If Mount Pinatuba erupted in June, 1991, there is no need to apply an adjustment to May 1991.
Here is the timeline of the major eruptions.
Krakatoa – August 1883
Santa Maria – October 1902
Novarupta – June 1912
Agung – two eruptions in March 1963 and May 1963 and smaller ones after
El Chichon – two eruptions in March 1982 and April 1982
Mount Pinatuba – June 1991
“And, for that matter, there have been supervolcanoes and major asteroid impacts and all sorts of things…so apparently these aren’t anything to worry about either!”
You better relax man, you’re gonna get ulcers worrying about all that stuff…
I guess we’re gonna have to raise alot more taxes!!
People, let’s get back to 5th grade science textbooks. All else being relatively the same (as in the Sun is still in the heavens) plate tectonics and axis tilt, combined with oceanic circulation, determines climate. It will warm a bit there. It will cool a bit here. But the overall climate will be about the same. Until the geography changes and the ocean circulation adjust to new locations of continents and subduction zones.
So let’s get real. Greenhouse gases cannot wipe out climate. Example: The Pacific Northwest will be relatively wet. The Inland Empire will be relatively dry. Land situated near a large body of salt water with an on-shore air flow and a subduction zone will always have the same climate relatively speaking. You will get clouds building up next to the mountain range and dry land beyond that. However, tilt and orbit wobble can turn your backyard climate into a very large BBQ or a deep freeze, depending on the wobble. If your backyard decides to move to a new latitude location, you will either have bananas or polar bears in your backyard. But greenhouse gases will not change climate, they will affect weather, just like volcanic ash does. Let me say it again: GHG cannot change climate.
People always talk about what climate was like bizillions of years ago and that GHG’s are such a powerful before- or after-effect (take your pick as to which side you are on). This is nonsense. Oceanic circulation and plate tectonics determine climate, just like your 5th grade science book explained quite clearly. All the rest is weather (which I love). End of lesson. Test Friday.
So if you are an AGW proponent, please tell me what mountain range grew overnight? If you are an ice-age proponent, when did we wobble and what continent moved?
Bill Illis (17:44:32) :
Bill, did I miss something…did someone “apply an adjustment to May 1991?”
Steven pegged the Pinatubo period as beginning at June 1991, and that’s where I peg the beginning for my second dummy variable.
Basil
Basil and Bill, my question to you has to do with the data you used. Isn’t it adjusted historically (both before and after) by the providers of such data for things like volcano effects (or other effects for that matter)? I know we have had posts here about how past data gets adjusted as time goes by. Is it possible to get the unadjusted anomaly data and then run your volcano filter?