A guest post by Steven Goddard
One of the most widely discussed climate feedbacks is the albedo effect of polar sea ice loss. Ice has a relatively high albedo (reflectance) so a reduction in polar ice area has the effect of causing more shortwave radiation (sunlight) to be absorbed by the oceans, warming the water. Likewise, an increase in polar sea ice area causes more sunlight to be reflected, decreasing the warming of the ocean. The earths radiative balance is shown in the image below. It is believed that about 30% of the sunlight reaching the earth’s atmosphere is directly reflected – 20% by clouds, 6% by other components of the atmosphere, and 4% by the earth’s surface.

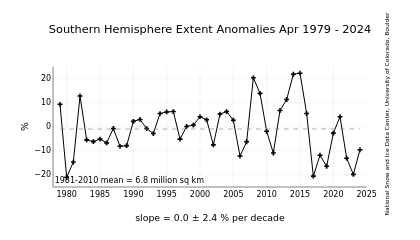
We all have heard many times that summer sea ice minimums have declined in the northern hemisphere over the last 30 years. As mentioned above, this causes more sunlight to reach the dark ocean water, and results in a warming of the water. What is not so widely discussed is that southern hemisphere sea ice has been increasing, causing a net cooling effect. This article explains why the cooling effect of excess Antarctic ice is significantly greater than the warming effect of missing Arctic ice.
Over the last 30 years Antarctic sea ice has been steadily increasing, as shown below.

December is the month when the Antarctic sun is highest in the sky, and when the most sunlight reaches the surface. Thus an excess of ice in December has the maximum impact on the southern hemisphere’s radiative balance. In the Antarctic, the most important months are mid-October through mid-February, because those are months when the sun is closest to the zenith. The rest of the year there is almost no shortwave radiation to reflect, so the excess ice has little effect on the shortwave radiative (SW) balance.
This has been discussed in detail by Roger Pielke Sr. and others in several papers.
So how does this work? Below are the details of this article’s thesis.


1. As mentioned above, the Antarctic ice excess occurs near the December solstice when the sun is highest above the horizon. By contrast, the Arctic ice deficiency appears near the equinox – when the sun is low above the horizon. Note in the graph below, that Arctic ice reaches it’s minimum in mid-September – just when the sun is setting for the winter at the North Pole. While the September, 2008 ice minimum maps were dramatic, what they did not show is that there was little sunlight reaching the water that time of year. The deviation from normal did not begin in earnest until mid-August, so there were only a couple of weeks where the northern hemisphere SW radiative balance was significantly impacted. Thus the water in most of the ice-deficient areas did not warm significantly, allowing for the fast freeze-up we saw during the autumn.
The 2008 peak Arctic ice anomaly occurred near the equinox, when it had the minimum heating effect on the ocean.
By contrast, the peak Antarctic ice anomaly occurred at the December solstice, when it had a maximum cooling effect, as shown below.
2. The next factor to consider is the latitude of the ice, which has a strong effect on the amount of solar insolation received. Arctic sea ice is closer to the pole than Antarctic sea ice. This is because of the geography of the two regions, and can be seen in the NSIDC images below.
Antarctic sea ice forms at latitudes of about 55-75 degrees, whereas most Arctic ice forms closer to the pole at latitudes of 70-90 degrees. Because Antarctic ice is closer to the tropics than Arctic ice, and the sun there reaches a higher angle above the horizon, Antarctic sea ice receives significantly more solar radiation in summer than Arctic sea ice does in its’ summer. Thus the presence or absence of Antarctic ice has a larger impact on the SW radiative balance than does the presence or absence of Arctic ice.
At a latitude of -65 degrees, the sun is about 40 degrees below the zenith on the day of the solstice. Compare that to early September negative anomaly peak in the Arctic at a latitude of 80 degrees, when the sun is more than 70 degrees below the zenith. The amount of solar radiation hitting the ice surface at those maxima is approximately 2.2 times greater in the the Antarctic than it is in the Arctic = cos(70) / cos(40) .
The point being again, that due to the latitude and date, areas of excess Antarctic ice reflect a lot of SW radiation back out into space, whereas deficient Arctic ice areas allow a much smaller quantity of SW radiation to reach the dark surface of water. Furthermore, in September the angle of incidence of the sun above the water is below the critical angle, so little sunlight penetrates the surface, further compounding the effect. Thus the Antarctic positive anomaly has a significantly larger effect on the earth’s SW balance than does the Arctic negative anomaly.
3. The next point is an extension of 2. By definition, excess ice is further from the pole than missing ice. Thus a 10% positive anomaly has more impact on the earth’s SW balance than does a 10% negative anomaly.
4. Due to eccentricity of the earth’s orbit, the earth is 3% closer to the sun near the December solstice, than it is during the June solstice. This further compounds the importance of Antarctic ice excess relative to Arctic ice deficiency.
All of these points work together to support the idea that so far, polar ice albedo feedback has been opposite of what the models have predicted. To date, the effect of polar albedo change has most likely been negative, whereas all the models predicted it to be positive. There appears to be a tendency in the climate community to discount the importance of the Antarctic sea ice increase, and this may not be appropriate.
NCEP/NCAR still ain’t prepared to compare past snow cover with whats happening now. They simply remove the historical record LOL http://moe.met.fsu.edu/snow/ unless they can explain of course…
Chris V –
My heat transfer advisor says that the theory of IR absorption is “unfounded” (he would never say crock of anything… too English). By the way – radiation heat transfer is one of the major areas that he has specialized in.
IR by CO2. That’s what you get when you type out a comment in a hurry. His exact comment was that he had reviewed the relevant literature and theories, and that based on his knowledge, that what has been advertised is unfounded.
Ric Werme:
I am afraid that you have lost me here.
“I think you should ask your geology professor why he thinks your meteorology professor is such an AGW supporter. After a stream of invective and suggestion that you ask your meteorology professor yourself, he might come up with a reasonable answer. (Again – don’t ask him “Why is Dr. M such an AGW supporter,” ask “Why do you think Dr. M is such an AGW supporter?”)”
My Geology professor does not know, nor is acquainted with my meteorology professor. I attend a large university.
I related only what my professors said to me. “Dr. M” himself told me that he is such a AGW supporter. The Geology professor told the class independently of anything that I ever suggested that AGW is a crock.
Ric, I am not sure what you are getting at. I would be happy to elucidate if you might tell me what you are asking.
Chris V. (19:08:39) :
Chris V.: If Al Gore said globaloney is gonna getcha, what would you say?
Brendan (19:41:27) :
What part of the theory does he think is unfounded? Does he think that CO2 doesn’t absorb IR?
jcbmack:
I do want to point out, however, that skin cancer, lung cancer, current weather anomalies have reached proportions that were not previously realized in human history and the warming looks to be the warmest in the last 100,000 plus years. (the thirty year trend)
Increased “proportion” skin cancer <– Sun exposure, primarily – possibly including Sun intensity.
Increased “proportion” lung cancer <– Inhaled tobacco product exposure, primarily, having nothing to do with CO2.
Please ask yourself first, what do these facts have to do with your other [very dubious] assertions?
“” Diogenes (22:55:57) :
It is correct to say that reflectivity increases dramatically with increased angle of incidence, however, as I understand it there is no critical angle for light travelling through air being reflected off water because the ratio of refractive indices is >1.
I would be curious to see the graph of reflectivity w.r.t. latitude and season used by the GCMs, it must be tremendously complex……. or maybe they just don’t bother with such things. “”
Aint necessarily so.
You have to consider whether the surface is an “optical” surface as calm water is at a small scale, or whether it is diffuse scattering.
The high grazing incidence reflectivity is generally a property of optical surfaces only.
for water witha visible light refractive index of 1.333, the normal incidence reflectance is ((1.333-1)/(1.333+1))^2 = 0.02; 2% For non normal incidence the reflectance is partially polarised and you have to use the full Fresnel polarisation formulae. For the polarisation component having the electric vector in the plane of incidence, the reflectance diminishes with angle reaching zero at the Brewster angle; which is arctan (n), which is 53.12 degrees for water or very close to one radian. That is the incidence angle at which your polarised glasses give the maximum extinction of surface reflections from water.. The other component with the electric vecor perpendicular to the plane of incidence, has the same 2% at normal incidence but it slowly increases as you approach the Brewster angle, being slightly more than doubled at the 53 degree angle for water.
The result is that the total reflectance off water, is almost constant at 2% up to the Brewster angle, and then both polarisation components exhibit
steeply increasing reflectance reaching 100% at 90 degree incidence.
The overall result is that for a diffuse light source refelcting off water, the total surface relectance ia bout 3% over the total 90 degree incidence cone.
Given that water is 73% of the earth’s surface, the ordinary Fresnel reflection off the water should account for a fairly fixed component of earth albedo, of 2.2%.
So if total earth surface reflectance of solar energy is 4%, that means that land ias well as snow and ice only account for about 1.8% of total earth surface contribution to albedo; which is why I believe that polar ice contribution to variations in earth albedo, is highly overrated.
Now the above water calculation is what applies to optical surfaces of which water is just about the only natural example on earth.
Snow, and to a lesser extent sea ice are anything but optical surfaces, infact snow tends to trap a lot of incident light and other solar energy components, which effect depends critically on the age of the snow. Freshly fallen snow can have a fairly high reflectance, but after just a few hours, the reflectance drops considerably, usually because the surface morphology of the snow changes as a result of surface melting. Once the snow becomes “icy” on a sall scale, the surface becomes optical (on a small scale) and much of the light is propagated into the interior of the snow, bouncing around so that Total Internal Reflectance traps a large portion of it. So aged snow isn’t all it is cracked up to be as a refelctor, and contributor to earth albedo.
The surface illuminance of the snow under direct saunlight is extremely high, and becasue of the small scale structure of the surface it is a diffuse scattering surface, so at almost any angle of view, snow looks extremely bright viually in direct sunlight, which is why it is an eye hazard.
But as I have said, as a contributor to the earth’s albedo, abnd to variations of that, it is somewhat overrated.
Once sea ice melts, it is true that the sea now becomes an absorber rather than a reflector, but remember that the latent heat required to melt the sea ice comes out of the water it is floating on, so ahuge amount of ocean water is cooled when the sea ice melts, which is why the arctic ocen sea level has been found to be falling at 2 mm per year. That may stop if the recent meltback of the arctic ice diminishes, and starts building back up again.
However, once the sea ice does melt leaving open water, the evaporation can increase, leading to an increase in precipitation of more snow, on surrounding lands.
It seems plausible to me that the recent increases in snow cover in the northern hemisphere, could be a direct result of the 2007 extreme meltback liberating a lot of water vapor in a region that is usually very low humidity.
The spectral reflectances of all kinds of terrestrial materials, including snow and ice, as well as rocks and all kinds of bio materials; have been widely measured, and can be found in “The Infr-Red Handbook” produced for the Department of The navy. Such information is crucial to military systems development.
I am not at my office desk, at the moment, so I can’t look upo some typical values for you right now.
By the way; the Arctic is normally consdered to be the area north of +60 degrees, and the Antarctic, that south of -60 degrees; and there is more land in the Arctic, and more water in the Antacrtic; which must be why they don’t have polar bears in the Antarctic; too much water so they all drowned eons ago.
I would look to cloud modulation as a source of albedo variations, rather than snow and ice cover.
Chris V, if so many meteorologists skeptical of AGW are discounted because they are not climate scientists, how come a meteorology professor is not similarly discounted in your eyes?
“” coaldust (23:00:23) :
Art (21:49:29) :
A quick read of the article reveals the following:
“The GKSS Research Centre asks: is it an accident that the warmest 13 years were observed after 1990, or does this increased frequency indicate an external influence?”
“…it is extremely unlikely that the frequency of warm record years after 1990 could be an accident and concluded that it is rather influenced by a external driver.” “”
Another red herring. This is like saying that some of the highest altitudes on earth are found up in the mountains.
Everybody knows that that we have had a warming period with some relatively high temperatures since cooler times in the mid 1970s and stopping around 1995, followed by a short plateau, and now a general falling trend.
Any 8th grade high school science student can explain to us, that when you have a maximum reached in a temperature graph, that the highest temperatures will tend to be clustered around that maximum.
So when are these people going to get a life; and stop reporting the obvious, as if it were a scientific mystery.
30 years from now, when the climate reaches a minimum temperature globally, and starts a new warming phase; the same idiots will be telling us that the last few years have been some of the coolest on record. !
Enough already, it is time to return control to the adults.
kkstewart:
This professor told me that I may not bring in any articles that discounted AGW, because that is “fringe science” and that the consensus on AGW is already fully established.
The Prof. is obviously threatened by contrary or critical thought on the topic of AGW, and probably on other matters as well.
Otherwise, he’d be able to easily handle “fringe science” and arguments confronting AGW on the question of what’s wrong with AGW hypotheses, its “science”, and its alleged “cure”.
You are dealing with someone who is very insecure and needs group approval or even group dictation as to what he “thinks” – potentially involving literally everyone. So if you threaten his groupthink bubble, you are going to pay for it by way of an irrational, punishing response. He has already essentialy delivered a personal threat to you as to his response, should you question his Dogma.
It’s your problem to figure out what you should do with your situation.
kkstewart (20:09:41) :
Sorry – I was assuming that the two professors knew each other, so never mind. It’s still worthwhile checking out the Bob Carter links, though.
It’s certainly [snip]!
Aww come on! I didn’t say anything snip-worthy!
REPLY: I know, but it was all in jest (he originally said “it was not for lack of trying”) and just too good of an opportunity to pass up – Anthony
I just find RealClimate’s position
TRULY
HILARIOUS!!!
Good evening all,
Sorry to be off-topic again, but this is interesting.
Someone else may have posted this news re ML CO2 here or elsewhere – thank you. I read it somewhere today.
Interesting CO2 data from Mauna Loa – dCO2/dt is near-zero over the past 12 months (December 2007 to December 2008): 383.9 to 384.1 ppm
Annualized Mauna Loa dCO2/dt has “gone negative” a few times in the past (calculating dCO2/dt from monthly data, by taking CO2MonthX (year n+1) minus CO2MonthX (year n) to minimize the seasonal CO2 “sawtooth”.)
These 12-month periods are (Year-Month ending):
1959-8
1963-9
1964-5
1965-1
1965-5
1965-6
1971-4
1974-6
1974-8
1974-9
Has this not happened recently because of increased humanmade CO2 emissions, or because the world has, until recently, been getting warmer?
I noted in a paper published one year ago that dCO2/dt changes contemporaneously with “average” global temperature, and CO2 lags temperature by ~9 months.
I do not have the time to update my spreadsheets, but this major decline in dCO2/dt seems reasonable, given the recent cooling.
For those who are interested, see my paper and spreadsheet at:
http://icecap.us/index.php/go/joes-blog/carbon_dioxide_in_not_the_primary_cause_of_global_warming_the_future_can_no/
Best regards, Allan
CO2 data from Mauna Loa:
ftp://ftp.cmdl.noaa.gov/ccg/co2/trends/co2_mm_mlo.txt
year, month, year.xx, CO2 ppm at Mauna Loa
2007 1 2007.042 382.91
2007 2 2007.125 383.87
2007 3 2007.208 384.51
2007 4 2007.292 386.38
2007 5 2007.375 386.54
2007 6 2007.458 385.98
2007 7 2007.542 384.35
2007 8 2007.625 381.85
2007 9 2007.708 380.73
2007 10 2007.792 381.15
2007 11 2007.875 382.38
2007 12 2007.958 383.9
2008 1 2008.042 385.37
2008 2 2008.125 385.69
2008 3 2008.208 385.91
2008 4 2008.292 387.16
2008 5 2008.375 388.57
2008 6 2008.458 387.88
2008 7 2008.542 386.39
2008 8 2008.625 384.14
2008 9 2008.708 383.07
2008 10 2008.792 382.98
2008 11 2008.875 384.11
2008 12 2008.958 384.11
I updated one graph of Mauna Loa dCO2/dt vs. Global Average LT temp anomaly.
Appears to be a 6-7 month time lag of CO2 after UAH LT temperature, using Mauna Loa CO2 (instead of 9 month lag using Global CO2, as in my paper).
The December 2008 CO2 reading corresponds to the May-June 2008 LT “low”.
Regards, Allan
Dear Mr Sowell,
Again, I can only advise you to take a few minutes and to use your engineering talents and calculate the scale of a storage infrastructure that would be needed to buffer a couple of windless days, should wind energy someday provide 10 or 20% of USA’s electrical need.
I’ll tell you right now that the biofuel proponents had the same hopes, dreams and visions – until they collided violently with reality. Today we all know the folly of biofuuels: deforestation, food shortages, absurd inefficiency and civil unrest, and that all caused by a biofuel industry that is only in its infancy!
In Europe, utilities are indeed backing up wind energy capacity with gas-fired turbines ONE TO ONE. There’s a reason for that. There’s no other technically or economically feasible way. I’ll be sure to send you a link to the report I mentioned once it is available. Things are looking great for natural gas, indeed.
I guess I should be a little more patient with people, as new ideas often look too good to be true. But the test is always economics. And wind and solar, and biofuels too, fail it BIG TIME. Fools’ Gold always looks real – until you weigh it yourself.
I suspect in about 20 years people will wake up and realise what a folly, like the mass housing projects of the 60s, this really is. Instead of dotting the landscape with 30-storey housing projects, we’re now doing the same with part-time operating windmills.
There was a note to say that the (mean / interpolated) values had erroneous propagated from November to December. Only on the publicly facing website. Anytime a value is completely out of whack or is same as month before one needs to consider an error is on hand. Nothing new, but for some it’s worth to create a whole blog topic to milk it and get more hits on the site. More hits, more revenue 😀
Brendan (16:32:27) :
I visited the pumped storage facility near Yankee Rowe (I think that’s the right name, and I think it was one of the first commercial nukes). They pumped water from the Connecticut River to a hill top reservoir and generated power during the day.
To do the same with wind would require a much bigger storage facility because it would have to hold several days to a couple week supply. Being a hilltop reservoir it was mostly out of sight, I think the area we even open to hiking and picnicing.
To Leif Svalgaard: I’m not clear on why we would want to go so far as to say that if solar cooling does come, that we can feel certain that warming will later return with a vengeance.
The satellite records for the past 3 decades show a trend of about 1.3 to 1.5 degrees C per century. This record includes the warming induced by GHGs, the warming induced by reducing sulfates since about 1990 (global brightening), any feedback effects from increased GHGs, and whatever solar trends have been going on in the last 30 years. It also includes, as per the first article today, whatever trends there are in El Nino. And it also includes black carbon emissions.
Don’t you have to separate out these influences? And if and when you do, given how small the temperature trend is, even with El Nino, global brightening, black carbon, I would guess that the feedbacks are far smaller than in the IPCC models. If the feedbacks are neutral, then a doubling of CO2 by itself produces about 1 decree C of warming.
So if there is a reasonable chance that this line of analysis is accurate, then how can we feel any degree of certainty that warming will return “with a vengeance”?
And isn’t it true that the feedbacks to CO2 increases are (1) the most important reason for the large IPCC temperature projections, and (2) are the least understood parts of the models (esp. clouds)?
Ric Werme,
And you’ve alluded to yet another drawback: Pumped storage facilities are limited by topography. I think implementing this in the Great (flat) Plains could be difficult.
” What is not so widely discussed is that southern hemisphere sea ice has been increasing, ”
I was cleaning up in the basement and happened into an old issue of Popular Science mag – February 1997. The cover shows a Zodiac motoring past a large ice-something (berg, glacier) and the cover story.. “Antarctic Meltdown? Controversial New Evidence for a Changing Climate.”
– Lief
Touche -TJ
John (05:33:42) :
why we would want to go so far as to say that if solar cooling does come, that we can feel certain that warming will later return with a vengeance.
First, there is no certainty [this is implicit in almost any statement about this]. Second, you have to see it within the context of the article that assumed [or suggested] that the warming was half [and increasing] AGW and half solar. Under those assumptions a return of high solar activity could reasonably be considered [and likely be advertised] as a ‘vengeance’.
The satellite records for the past 3 decades show a trend of about 1.3 to 1.5 degrees C per century.
or 13-15 degrees C per millennium. It is not advisable to extrapolate outside the length of the record, if you don’t know what causes the trend.