A guest post by Steven Goddard
One of the most widely discussed climate feedbacks is the albedo effect of polar sea ice loss. Ice has a relatively high albedo (reflectance) so a reduction in polar ice area has the effect of causing more shortwave radiation (sunlight) to be absorbed by the oceans, warming the water. Likewise, an increase in polar sea ice area causes more sunlight to be reflected, decreasing the warming of the ocean. The earths radiative balance is shown in the image below. It is believed that about 30% of the sunlight reaching the earth’s atmosphere is directly reflected – 20% by clouds, 6% by other components of the atmosphere, and 4% by the earth’s surface.

We all have heard many times that summer sea ice minimums have declined in the northern hemisphere over the last 30 years. As mentioned above, this causes more sunlight to reach the dark ocean water, and results in a warming of the water. What is not so widely discussed is that southern hemisphere sea ice has been increasing, causing a net cooling effect. This article explains why the cooling effect of excess Antarctic ice is significantly greater than the warming effect of missing Arctic ice.
Over the last 30 years Antarctic sea ice has been steadily increasing, as shown below.

December is the month when the Antarctic sun is highest in the sky, and when the most sunlight reaches the surface. Thus an excess of ice in December has the maximum impact on the southern hemisphere’s radiative balance. In the Antarctic, the most important months are mid-October through mid-February, because those are months when the sun is closest to the zenith. The rest of the year there is almost no shortwave radiation to reflect, so the excess ice has little effect on the shortwave radiative (SW) balance.
This has been discussed in detail by Roger Pielke Sr. and others in several papers.
So how does this work? Below are the details of this article’s thesis.


1. As mentioned above, the Antarctic ice excess occurs near the December solstice when the sun is highest above the horizon. By contrast, the Arctic ice deficiency appears near the equinox – when the sun is low above the horizon. Note in the graph below, that Arctic ice reaches it’s minimum in mid-September – just when the sun is setting for the winter at the North Pole. While the September, 2008 ice minimum maps were dramatic, what they did not show is that there was little sunlight reaching the water that time of year. The deviation from normal did not begin in earnest until mid-August, so there were only a couple of weeks where the northern hemisphere SW radiative balance was significantly impacted. Thus the water in most of the ice-deficient areas did not warm significantly, allowing for the fast freeze-up we saw during the autumn.
The 2008 peak Arctic ice anomaly occurred near the equinox, when it had the minimum heating effect on the ocean.
By contrast, the peak Antarctic ice anomaly occurred at the December solstice, when it had a maximum cooling effect, as shown below.
2. The next factor to consider is the latitude of the ice, which has a strong effect on the amount of solar insolation received. Arctic sea ice is closer to the pole than Antarctic sea ice. This is because of the geography of the two regions, and can be seen in the NSIDC images below.
Antarctic sea ice forms at latitudes of about 55-75 degrees, whereas most Arctic ice forms closer to the pole at latitudes of 70-90 degrees. Because Antarctic ice is closer to the tropics than Arctic ice, and the sun there reaches a higher angle above the horizon, Antarctic sea ice receives significantly more solar radiation in summer than Arctic sea ice does in its’ summer. Thus the presence or absence of Antarctic ice has a larger impact on the SW radiative balance than does the presence or absence of Arctic ice.
At a latitude of -65 degrees, the sun is about 40 degrees below the zenith on the day of the solstice. Compare that to early September negative anomaly peak in the Arctic at a latitude of 80 degrees, when the sun is more than 70 degrees below the zenith. The amount of solar radiation hitting the ice surface at those maxima is approximately 2.2 times greater in the the Antarctic than it is in the Arctic = cos(70) / cos(40) .
The point being again, that due to the latitude and date, areas of excess Antarctic ice reflect a lot of SW radiation back out into space, whereas deficient Arctic ice areas allow a much smaller quantity of SW radiation to reach the dark surface of water. Furthermore, in September the angle of incidence of the sun above the water is below the critical angle, so little sunlight penetrates the surface, further compounding the effect. Thus the Antarctic positive anomaly has a significantly larger effect on the earth’s SW balance than does the Arctic negative anomaly.
3. The next point is an extension of 2. By definition, excess ice is further from the pole than missing ice. Thus a 10% positive anomaly has more impact on the earth’s SW balance than does a 10% negative anomaly.
4. Due to eccentricity of the earth’s orbit, the earth is 3% closer to the sun near the December solstice, than it is during the June solstice. This further compounds the importance of Antarctic ice excess relative to Arctic ice deficiency.
All of these points work together to support the idea that so far, polar ice albedo feedback has been opposite of what the models have predicted. To date, the effect of polar albedo change has most likely been negative, whereas all the models predicted it to be positive. There appears to be a tendency in the climate community to discount the importance of the Antarctic sea ice increase, and this may not be appropriate.
So, in light of all this, just what can we take away from this article?
http://english.pravda.ru/science/earth/106922-0/
I am naturally suspicious of the source, but on further research I find that the article has the same sort of basis in “fact” as does anything coming from the AGW crowd… One can only hope they are wrong. I’m in the “bring on the global warming” crowd! 😉
Off post but very interesting. It seems that Exxon have started the move from the Dark Side and are now seeing the light.
“The boss of ExxonMobil, the world’s largest oil company, has called for a carbon tax to tackle global warming, marking a volte-face by the firm once described by Greenpeace as Climate Criminal No 1. Assailed from all sides by scientists and a new cadre of US politicians, led by the President-elect, Barack Obama, the landmark concession by Rex Tillerson represents a nod to realpolitik after years when the company denied the existence of man-made global warming.
Exxon had already dropped its funding of lobby groups which deny the science of climate change and begun to take a softer public line, but even Mr Tillerson admitted that propounding a carbon tax had stuck in the craw until recently.
For the whole story click here. http://www.independent.co.uk/news/world/americas/oil-giant-comes-in-from-the-cold-1297558.html
For the statement from the horses mouth read here_http://www.businesswire.com/portal/site/exxonmobil/index.jsp?ndmViewId=news_view&ndmConfigId=1001106&newsId=20090108006153&newsLang=en
Just an observation. Ice melts faster in slightly warmer water than it does in slightly warmer air. I think the combination of water temperature and wind could be a major double whammy to sea ice melt patterns and would venture to state the null hypothesis that ocean currents and wind patterns do not show predictable melt patterns along the sea ice edge. I state it thusly to back up my earlier statement regarding finding what you are looking for. Were I to pursue this line of research, I would perform a statistical study on daily ocean current temperatures and wind pattern data compared to sea ice edge melt data in order to determine what, if any, correlations exist.
Why is this so hard for AGW scientists to grasp? It is basic research design and I see it where? In not a single AGW-sponsored media published report or study have I seen even basic research on all the variables thought to be associated with Arctic sea ice melt. Is that because there are such studies but they can only be found in obscure journals and are never trotted out by AGW scientists for public news? Truly, if AGW scientists want me to believe that CO2 is the cause of sea ice retreat, show me the study with data on all the variables associated with sea ice melt and that demonstrates that CO2 is the strongest predictor.
This trip to the Arctic me thinks is another publicity stunt and not true research.
Slightly OT: Here is a link to a PRAVDA (the Truth) article about an impending ice age.
http://english.pravda.ru/science/earth/106922-earth_ice_age-0
DaveM,
I think what you can take away from the Pravda article, is that most Russians aren’t worried about global warming. That has been more or less the official line in Russia.
Sorry: didn’t notice that DaveM posted the link already
WRT “climate is not a random walk”, I should have put that in quotes – David Archibald said that (I seemed to remember it from somewhere, and should have simply googled it).
Re: critical angle
The discussion of critical angle pertains to open water near the North Pole close to the equinox, where the water is relatively still – not the Antarctic where there is excess ice covering the water.
RE:
http://english.pravda.ru/science/earth/106922-earth_ice_age-0
SOME GLOBAL COOLING PREDICTIONS (UP TO 2007 – SINCE 2008 THESE HAVE BECOME TOO NUMEROUS TO INCLUDE)
I believe that human influences on climate are minor compared to natural influences.
I also believe that global warming is much less threatening to humanity than global cooling.
Several credible parties are now predicting that global cooling will start by 2020 or sooner (see below). These predictions come from nine different scientific researchers/organizations including NASA and the Russian Academy of Sciences, and are derived from two scientific bases:
1. Studies of cycles, such as various Solar Cycles (Hale, Gleissberg, etc.) and climate cycles (Pacifac Decadal Oscillation, etc.).
2. Studies of solar physics and current solar activity trends.
Wouldn’t it be truly ironic if our society wasted hundreds of billions of dollars in a futile fight against global warming, only to conclude in the very near future that it is getting much colder, and we are not at all prepared for it, and we have squandered our scarce capital and resources to prevent a global warming crisis that did not exist?
Hope I’m wrong…
Best regards, Allan
_____________________________________________________________________
Excerpt from:
Kyoto hot air can’t replace fossil fuels September 1, 2002; Allan M.R. MacRae; Calgary Herald
Over the past one thousand years, global temperatures exhibited strong correlation with variations in the sun’s activity. This warming and cooling was certainly not caused by manmade variations in atmospheric CO2, because fossil fuel use was insignificant until the 20th century.
Temperatures in the 20th century also correlate poorly with atmospheric CO2 levels, which increased throughout the century. However, much of the observed warming in the 20th century occurred before 1940, there was cooling from 1940 to 1975 and more warming after 1975. Since 80 per cent of manmade CO2 was produced after 1940, why did much of the warming occur before that time? Also, why did the cooling occur between 1940 and 1975 while CO2 levels were increasing? Again, these warming and cooling trends correlate well with variations in solar activity.
Only since 1975 does warming correlate with increased CO2, but solar activity also increased during this period. This warming has only been measured at the earth’s surface, and satellites have measured little or no warming at altitudes of 1.5 to eight kilometres. This pattern is inconsistent with CO2 being the primary driver for warming.
If solar activity is the main driver of surface temperature rather than CO2, we should begin the next cooling period by 2020 to 2030.
___________________________________________________________
Other Excerpts, in chronological order:
In 2003, Dr. Theodor Landscheidt wrote a paper predicting serious global cooling: “Analysis of the sun’s varying activity in the last two millennia indicates that contrary to the IPCC’s speculation about man-made global warming as high as 5.8° C within the next hundred years, a long period of cool climate with its coldest phase around 2030 is to be expected.” http://mitosyfraudes.8k.com/Calen/Landscheidt-1.html
In 2005, Piers Corbyn predicted cooling by 2040:
On the 2nd February 2005, he gave this presentation to the Institute of Physics Energy Management Group. It contained the following:
In the next 5 or 10 years warming is likely to be maintained as a transpolar shift occurs. This will be followed by the magnetic pole moving away from the geographic pole, a decrease in solar activity, a southward shift in the Gulf stream and considerable world cooling by 2040 AD.
http://julesandjames.blogspot.com/2005/05/trying-to-bet-on-climate-with-piers.html
In 2006, NASA predicted that “Solar Cycle 25, peaking around the year 2022, could be one of the weakest in centuries”. http://science.nasa.gov/headlines/y2006/10may_longrange.htm
Global cooling could develop on Earth in 50 years and have serious consequences before it is replaced by a period of warming in the early 22nd century, a Russian Academy of Sciences’ astronomical observatory’s report says. http://www.mosnews.com/news/2006/08/25/globalcooling.shtml
–MosNews, 25 August 2006
The Kyoto initiatives to save the planet from the greenhouse effect should be put off until better times. The global temperature maximum has been reached on Earth, and Earth’s global temperature will decline to a climatic minimum even without the Kyoto protocol.
http://www.mosnews.com/news/2006/08/25/globalcooling.shtml
–Khabibullo Abdusamatov, Russian Academy of Science, 25 August 2006
If you look back into the sun’s past, you find that we live in a period of abnormally high solar activity. Periods of high solar activity do not last long, perhaps 50 to 100 years, then you get a crash. It’s a boom-bust system, and I would expect a crash soon. http://www.newscientist.com/unpwlogin.ns
–Nigel Weiss, University of Cambridge, 16 September 2006
Sunspot numbers are well on the way down in the next decade. Sunspot numbers will be extremely small, and when the sun crashes, it crashes hard. The upcoming sunspot crash could cause the Earth to cool.
http://www.newscientist.com/unpwlogin.ns
–Leif Svalgaard, Stanford University, 16 September 2006
*****************************************************************************
An 8th prediction of cooling from China in 2007:
THE COMING GLOBAL COOLING?
World Climate Report, 16 March 2007
http://www.worldclimatereport.com/index.php/2007/03/16/the-coming-global-cooling/
An article has appeared in a recent issue of Meteorology and Atmospheric Physics with a curious title “Multi-scale analysis of global temperature changes and trend of a drop in temperature in the next 20 years.” … …”Despite the increasing trend of atmospheric CO2 concentration, the components IMF2, IMF3 and IMF4 of global temperature changes are all in falling”… …”the effect of greenhouse warming is deficient in counterchecking the natural cooling of global climate change in the coming 20 years. Consequently, we believe global climate changes will be in a trend of falling in the following 20 years.”… …”The global climate warming is not solely affected by the CO2 greenhouse effect. The best example is temperature obviously cooling however atmospheric CO2 concentration is ascending from 1940s to 1970s. Although the CO2 greenhouse effect on global climate changes is unsuspicious, it could have been excessively exaggerated. It is high time to re-consider the global climate changes.”
Reference
Zhen-Shan, L. and S. Xian. 2007. Multi-scale analysis of global temperature changes and trend of a drop in temperature in the next 20 years. Meteorology and Atmospheric Physics, 95, 115-121.
********************************************************************************
And a 9th prediction of cooling from Finland
Timo Niroma:
http://personal.inet.fi/tiede/tilmari/sunspots.html
Alert note 31.10.2007 – A probable new Dalton minimum.
According to my theory about Jovian effect on sunspots, based on facts measured since 1700 and estimated since 1500 (Schove)
– The Jupiter perihelion and sunspot minimum never coincide and the nearing perihelion will slow the rise of the height of sunspot cycle, as happened to the cycle 23 and will happen still more dramatically to cycle 24.
– The Gleissberg cycle has almost reached its lower limit, which is 72 years.
— In fact this low it has not been ever after the Maunder minimum.
— So it must go up, the short cycles of the 20th century has created a debt that must be paid.
Now the next Jovian perihelion is in late March in 2011. I predict that the length of the cycle 23 is in the range of 12.2-13 years. This means a minimum earliest in October 2008 and latest in July 2009 (I use the minimum of 1996.6). This means that the cycle 24 is very low, in the range of 40-70, or a Dalton level. This means that the maximum will be reached only in 2014. All this means there will be a cooling for decades, probable one Gleissberg or nearly 80 years. (A sidestep: The rise of the CO2 in atmosphere from 0.03 to 0.04 % does not have any meaning in this play. The rise should be to more than 1 % to affect the complicated feedback system of Earth if the last 200 million history of Earth is used as a proxy of what has happened yesterday.)
Assuming that the last 500 years in solar behaviour can be used as a proxy for the normal behaviour of the Sun, the estimated probability of the first prediction is .91 and for the latter .96, making the total probability of this prediction to be true as 87%. (A sidestep: I’m a statistician and this is a statistical study, but a remark for those, who urgently for years have asked me about the physical reason: I find the Svensmark theory (2006) of cosmic rays oscillating to the rhythm of the Sun’s magnetic field as most promising. The CERN investigations in 2008 probably will settle the issue.)
You should all check out drudges link to pravda next ICE AGE!
http://english.pravda.ru/science/earth/106922-earth_ice_age-0
The world is on the brink of an ice age:
http://english.pravda.ru/science/earth/106922-0/
Les Francis (03:35:33) :
“Smokey, at the end of the poll the AGW alarmist crowd will claim that WUWT is not a science blog.”
Heh. Well, RC shouldn’t talk–[snip]
REPLY: I don’t like such suggestions, and I deleted this comment. However, I don’t want to fall into the sorts of comments that RC has allowed about myself and Steve McIntyre see http://www.climateaudit.org/?p=4814
– Anthony
This is my first posting on any blog.
I really enjoy this one and extend my thanks to Mr. Watts for his work.
I’m not sure where this post belongs; my apologies if it is in the wrong place.
I’ve noticed the new Mauna Loa CO2 data is out and the older data has been revised. I understand from other posts on this blog that it is a normal process for them to adjust the data.
The new trended data shows a decline from January 08 to December 08, from 385.07 to 385.03 ppm. Looking at their historical numbers, it appears random whether January data typically reports higher or lower than December data. If this January reports level or declining, then the global CO2 levels will have declined from one year to the next.
REPLY: Welcome Ed, I’ve been waiting for this to shake out a bit before posting on it. There will be a thread soon. – Anthony
Via IceCap:
A little perspective:
http://english.pravda.ru/print/science/earth/106922-earth_ice_age-0
shadyplants — Re ExxonMobil
ExxonMobil has done a lot of very interesting things lately, indeed, all along. Rex Tillerson is an impressive and amazing man. Rex was a couple of years ahead of me in undergrad, and we had some classes together.
As the largest and most profitable major oil company on the planet, they are the very best at much of what they attempt. It is instructive to observe their actions, particularly their research and their capital spending.
In research, ExxonMobil developed a high-strength steel that allows less steel to be used compared to earlier steels. They also developed a novel plastic membrane that will advance batteries for hybrid vehicle use. They also announced recently a novel synthetic rubber that holds air pressure with a thinner layer of material; this allows truck tires to be thinner and lighter thus reducing fuel requirements in trucking. Green things, IMHO.
On the capital investment front, they have invested, and are investing, heavily in LNG plants and the ships to transport LNG. They see the future, and it is natural gas.
ExxonMobil produces a very instructive document, their Energy Outlook. In my view, this should be required reading for all thoughtful people. It can be found at
http://www.exxonmobil.com/Corporate/energy_outlook.aspx
One key point about an integrated oil company is that the highest value-added, or profitability, comes from petrochemicals and lubricants, but not from gasoline. Therefore, it would suit ExxonMobil just fine for the demand for gasoline to decrease.
Full disclosure: I am not an employee of ExxonMobil nor have I ever been employed by them. ExxonMobil is not a client, and I currently do not own any stock. I previously owned some stock for brief periods.
Roger E. Sowell
Marina del Rey, California
Concerning Exxon / Tillerson etc.,
like T. Boone Pickens, the gas industry has quickly learned that there’s real gold in them thar windmills – especially for the natural gas industry.
Because wind energy output fluctuates so wildly, its installed capacity has to be backed up by natural gas turbines 1:1. That’s right! For every KW of installed wind power, there’s got to be 1 KW of gas-fired capacity as back-up.
That means when the wind blows, the gas-fired generators will simply sit their and do nothing (except cost consumers a lot of money). And when the wind turbines stop on windless days, the gas turbines will have to fire up to pick up the slack.
Just think of the money GE is going to make selling BOTH wind and gas turbines, sall ubsidised by the guv, and all at the consumers’ expense of course. Now Exxon is out to capitalise on all the increased wind-driven gas consumption, and of course get a share of all the nice subsidies that are about to be forked out to the wind industry too.
All of this is going to cost the consumer a big bundle. As I said there’s gold in them thar mills! (Though, not for the consumer).
It just doesn’t get any better. Exxon takes subsidies to build more windmills, so that it can sell more natural gas down the road.
For the consumer, we PAY the government to install a system that is going to require we PAY more in the future! Brilliant!
Basically it’s paying your doctor to make you sick, so that you can pay him later to cure you.
The whole thing is just a big bloody scam.
And as long as we have so many stupid, idiotic, clueless, duped masses out there, these things are just going to keep happening.
Hmmm, a quick look at the Arctic Sea Ice Extent graphs suggests that Arctic Sea Ice thinks it has gotta do some catching up.
I should have added: Go baby ice!
Anthony:
Mauna Loa posts .24 yearly rise in co2 for 2008, the smallest since recording began in 1959!!!
http://www.esrl.noaa.gov/gmd/ccgg/trends/
Hopefully they fully checked these numbers before posting!!
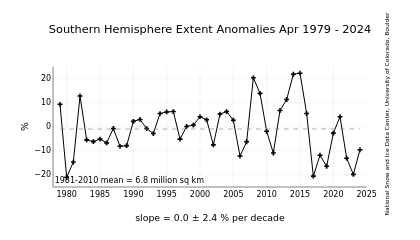
The graph in the opening post showing the “Southern Hemisphere Extent Anomalies December 2008” has a trend of 1.1 +/- 2.5% per decade.
The error bar (+/-2.5%) is larger than the trend itself (1.1%)
The real trend (with 90% confidence?) could be anywhere from +3.6% to -1.4%.
My statistics are a little rusty, but doesn’t that mean that you can’t say (with any statistical certainty) whether the S. Hemisphere ice trend is positive or negative?
Compare the S. Hemisphere with the N. Hemisphere Ice extent:
http://nsidc.org/data/seaice_index/images/n_plot.png
The N. Hemisphere trend is -3.3% +/- 0.7. I’m guessing that trend is statistically significant.
Interesting article about Greenland reportedly came out today.
http://www.google.com/hostednews/afp/article/ALeqM5jT2vWIgQBz7SF1lsG4MvVuAZJaDQ
Massive Greenland meltdown? Not so fast, say scientists
PARIS (AFP) The recent acceleration of glacier melt-off in Greenland, which some scientists fear could dramatically raise sea levels, may only be a temporary phenomenon, according to a study published Sunday.
Researchers in Britain and the United States devised computer models to test three scenarios that could account for rapid — by the standards applied to glaciers — melting of the Helheim Glacier, one of Greenland’s largest.
Two were based on changes caused directly by global warming: an increase in the flow of water that greases the underbelly of the glacier as it slides toward the sea, and a general thinning due to melting.
If confirmed, either of these explanations would point to a sustained increase in runoff over the coming decades, fueling speculation that sea level could rise faster and higher than once thought.
The stakes are enormous: the rate at which the global ocean water mark rises could have a devastating impact on hundreds of millions of people living in low-lying areas around the world.
But a team led by Faezeh Nick of Durham University in Britain found that neither of these scenarios matched the data.
“They simply don’t fit what we have observed,” said colleague and co-author Andreas Vieli in an interview.
Shadyplants:
I guess with Exxon switching sides, we now will be justified in accusing all AGW wonks of being paid stooges of Big Oil…….
Allan M R MacRae (08:50:37) :
Wouldn’t it be truly ironic if our society wasted hundreds of billions of dollars in a futile fight against global warming, only to conclude in the very near future that it is getting much colder, and we are not at all prepared for it, and we have squandered our scarce capital and resources to prevent a global warming crisis that did not exist?
Hope I’m wrong…
I hope so too!
Unfortunately, it’s likely that you’re not. I’m not sure about a coming ice age but cooling is definitely on the cards & after preparing for warming, something we won’t be prepared for.
DaveE.