A guest post by Steven Goddard
One of the most widely discussed climate feedbacks is the albedo effect of polar sea ice loss. Ice has a relatively high albedo (reflectance) so a reduction in polar ice area has the effect of causing more shortwave radiation (sunlight) to be absorbed by the oceans, warming the water. Likewise, an increase in polar sea ice area causes more sunlight to be reflected, decreasing the warming of the ocean. The earths radiative balance is shown in the image below. It is believed that about 30% of the sunlight reaching the earth’s atmosphere is directly reflected – 20% by clouds, 6% by other components of the atmosphere, and 4% by the earth’s surface.

We all have heard many times that summer sea ice minimums have declined in the northern hemisphere over the last 30 years. As mentioned above, this causes more sunlight to reach the dark ocean water, and results in a warming of the water. What is not so widely discussed is that southern hemisphere sea ice has been increasing, causing a net cooling effect. This article explains why the cooling effect of excess Antarctic ice is significantly greater than the warming effect of missing Arctic ice.
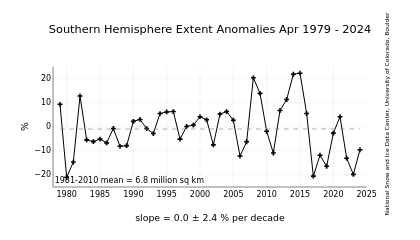
Over the last 30 years Antarctic sea ice has been steadily increasing, as shown below.

December is the month when the Antarctic sun is highest in the sky, and when the most sunlight reaches the surface. Thus an excess of ice in December has the maximum impact on the southern hemisphere’s radiative balance. In the Antarctic, the most important months are mid-October through mid-February, because those are months when the sun is closest to the zenith. The rest of the year there is almost no shortwave radiation to reflect, so the excess ice has little effect on the shortwave radiative (SW) balance.
This has been discussed in detail by Roger Pielke Sr. and others in several papers.
So how does this work? Below are the details of this article’s thesis.


1. As mentioned above, the Antarctic ice excess occurs near the December solstice when the sun is highest above the horizon. By contrast, the Arctic ice deficiency appears near the equinox – when the sun is low above the horizon. Note in the graph below, that Arctic ice reaches it’s minimum in mid-September – just when the sun is setting for the winter at the North Pole. While the September, 2008 ice minimum maps were dramatic, what they did not show is that there was little sunlight reaching the water that time of year. The deviation from normal did not begin in earnest until mid-August, so there were only a couple of weeks where the northern hemisphere SW radiative balance was significantly impacted. Thus the water in most of the ice-deficient areas did not warm significantly, allowing for the fast freeze-up we saw during the autumn.
The 2008 peak Arctic ice anomaly occurred near the equinox, when it had the minimum heating effect on the ocean.
By contrast, the peak Antarctic ice anomaly occurred at the December solstice, when it had a maximum cooling effect, as shown below.
2. The next factor to consider is the latitude of the ice, which has a strong effect on the amount of solar insolation received. Arctic sea ice is closer to the pole than Antarctic sea ice. This is because of the geography of the two regions, and can be seen in the NSIDC images below.
Antarctic sea ice forms at latitudes of about 55-75 degrees, whereas most Arctic ice forms closer to the pole at latitudes of 70-90 degrees. Because Antarctic ice is closer to the tropics than Arctic ice, and the sun there reaches a higher angle above the horizon, Antarctic sea ice receives significantly more solar radiation in summer than Arctic sea ice does in its’ summer. Thus the presence or absence of Antarctic ice has a larger impact on the SW radiative balance than does the presence or absence of Arctic ice.
At a latitude of -65 degrees, the sun is about 40 degrees below the zenith on the day of the solstice. Compare that to early September negative anomaly peak in the Arctic at a latitude of 80 degrees, when the sun is more than 70 degrees below the zenith. The amount of solar radiation hitting the ice surface at those maxima is approximately 2.2 times greater in the the Antarctic than it is in the Arctic = cos(70) / cos(40) .
The point being again, that due to the latitude and date, areas of excess Antarctic ice reflect a lot of SW radiation back out into space, whereas deficient Arctic ice areas allow a much smaller quantity of SW radiation to reach the dark surface of water. Furthermore, in September the angle of incidence of the sun above the water is below the critical angle, so little sunlight penetrates the surface, further compounding the effect. Thus the Antarctic positive anomaly has a significantly larger effect on the earth’s SW balance than does the Arctic negative anomaly.
3. The next point is an extension of 2. By definition, excess ice is further from the pole than missing ice. Thus a 10% positive anomaly has more impact on the earth’s SW balance than does a 10% negative anomaly.
4. Due to eccentricity of the earth’s orbit, the earth is 3% closer to the sun near the December solstice, than it is during the June solstice. This further compounds the importance of Antarctic ice excess relative to Arctic ice deficiency.
All of these points work together to support the idea that so far, polar ice albedo feedback has been opposite of what the models have predicted. To date, the effect of polar albedo change has most likely been negative, whereas all the models predicted it to be positive. There appears to be a tendency in the climate community to discount the importance of the Antarctic sea ice increase, and this may not be appropriate.
Leif,
I believe the climate simulations use only 4 to 6 time steps a day, and parameterize their surface interactions using “white sky” albedos. They aren’t all “high top” (stratsphere) models yet, and some still apply solar forcing smoothed of all cycles. I don’t think just solar insolation will be responsible for the coupling. The 5 to 7% variation in the UV over the course of the cycle has significant impact on stratosphere chemistry, especially producing ozone which is a greenhouse gas. The models underrepresent the precipitation increase observed in the recent warming by a factor of three. The models usually spin up their oceans to the years somewhere between 1850 and 1880 and then assume them to be in equilibrium then. Of course, there may already be an energy imbalance since the actual oceans were spun down so long by the maunder minimum.
So models that have documented biases against solar, maybe 4 times larger than the 0.8W/m^2 energy imbalance (Hansen’s figure for 1998) that they are supposed to attribute, are being tuned and parameterized to match the recent warming. They are matching the missing energy somehow, perhaps with increased sensitivity to GHGs, given that they are increasing and solar isn’t during the recent warming. Their projections are even worse, as in out decades they will catch up with the earlier temperate zone snow melt (in the observations) and with the arctic melting, adding the missing energy what every warming trend they were following anyway. That probably explains the mid-21st century temperature excursions in the projections.
The “physics equations” solved in the models will be the fluid flow and mass balance equations. All the other physics from radiative transfer, to albedo to clouds and precipitation to sea ice and snow melt, etc. are parameterized.
Martin Lewitt (11:53:37) :
I believe the climate simulations use only 4 to 6 time steps a day,
We will have to disagree on this. I know [having directly asked Gavin Schmidt] that the time step is of the order of minutes. The models have a much higher degree of sophistication than your post admits. A good introduction to the subject is Jacobson’s ‘Fundamentals of Climate modeling’ Cambridge Univ. Press, 2nd ed., 2005. As a small example I quote from page 262 [about how to calculate the temperature and moisture in vegetated soil]: “T is found by solving iteratively a foliage energy balance equation that considers a net solar flux at the top of the foliage, a net thermal-IR flux at the top of the foliage and at ground level, and sensible and latent heat fluxes of the top of the foliage and at ground level”.
There are, of course, several models in existence with various resolution in time and space. Some models are deliberately simplified to see if they can capture the essential features. Clearly, models have made great strides and will continue to do so, as they have a long way to go. One should not consider them as ‘oracles’ in any way.
crosspatch (11:47:32) :
Don’t most models have a variable for particulates/aerosols? Could that be used as a proxy for solar changes?
The models use the ‘actual’ solar changes, not proxies. For the future, predicted solar changes or ‘scenarios’ can be used.
There is not just ‘one’ variable for aerosols. Variables that are considered include sea spray [the most common aerosol BTW], soil dust, pollen, spores, volcanic outgassing, natural biomass fires and anthropogenic sources such as fossil-fuel combustion and wind uplift of soil over eroded land. Many of these sources are not precisely known and are often parameterized and are hard to predict, but does depend on the model result e.g. on moisture. But again, scenarios can be made, e.g. for the effect of volcanoes.
What I’m trying to say is that the best models are very sophisticated. They still don’t do well enough to be trustworthy, but progress is being made. There is also a difference between weather models and climate models. In the latter, some suppression of weather effects occur.
Leif Svalgaard (12:27:23) :
M. Jacobson’s ‘Fundamentals of Atmospheric Modeling’, 2nd ed. 2005. Typo.
Leif,
You’re right, it looks like AR4 timesteps are in the 15/day to 15 and 30 minutes. My bad.
Martin Lewitt (13:40:15) :
You’re right, it looks like AR4 timesteps are in the 15/day to 15 and 30 minutes. My bad.
Models improve all the time. Still a long way to go, though. And I really think they should try to vary the solar input and make a plot that shows how much warming/cooling as a function of solar variability they predict. Why they don’t is a puzzle.
“Polar sea ice changes are having a net cooling effect on the climate” – A current look at the ice coverage shows extensive sea ice all across the Arctic and all the way down to the south of Greenland, (the southern tip is outside the Arctic Circle, compare with this map of the Arctic here: http://www.athropolis.com/map2.htm)
http://arctic.atmos.uiuc.edu/cryosphere/NEWIMAGES/arctic.seaice.some.000.png
On the western side of Greenland the North West Passage is totally solid.
Svalbard is currently ice bound on three sides and Franz Josef Land is totally ice bound, also shown in these current ice charts:
http://iup.physik.uni-bremen.de:8084/amsr/Svalbard_nic.png
http://retro.met.no/images/image_000128_1231858879.jpg
http://retro.met.no/images/image_000130_1231858918.jpg
I was wondering what sort of temperatures we would have to realise in order to melt this lot in the next five years?
http://www.yr.no/place/Norway/Svalbard/
Resolute- minus 34C
Churchill – minus 30C
Barrow – minus 25C
Pevek,
Russia – minus 45C
“scenarios can be made, e.g. for the effect of volcanoes.”
Forgive me for my ignorance but I am wondering about difference in magnitude of solar radiation reaching the surface between something like a Pinatubo event vs the change in TSI between now and, say, 1980.
I hear that changes in solar radiation aren’t much and shouldn’t have much impact. Just out of pure curiosity, I am wondering how these variations in solar radiation compare to changes caused by volcanic events, or maybe even power plant emissions. I seem to remember a while back some model or another said one source of warming might be due to increased transparency of the atmosphere due to improved emission control of power plants and reduction of other pollutants.
And I am not asking anyone to get that information for me, simply pointing me in a direction where I can dig it out myself would be fine.
“Ice has a relatively high albedo (reflectance) so a reduction in polar ice area has the effect of causing more shortwave radiation (sunlight) to be absorbed by the oceans, warming the water. Likewise, an increase in polar sea ice area causes more sunlight to be reflected, decreasing the warming of the ocean. ”
Ah, but would not the immediate effect of one exceptionally cold year of new ice re-formation and extended snow cover (Canada was 100% covered for X-mas day) result in a complete immediate cancellation of the existing year over year increasing effects of open water that we had experienced. In other words, in the Arctic – where the effect has had the opportunity to continue to feed upon itself year after year, here – could not this come to an abrubt end; therefore, the cooling effect from this one part of the puzzle can set in almost immediatley. It leads then – ice cools faster than water warms.
Leif Svalgaard (09:30:26) :
To make the graph more understandable, plot the data in an X-Y scatter plot, with X being, say, Rmax and Y being Angular momentum.
If you understood the theory you would know that you cant use an X-Y scatter plot.
To Leif Svalgaard (06:25:22)
Leif, thanks for bringing up the Lean et al study — this is beginning to be the kind of calibration I had in mind.
With regard to their data inputs, you suggest the possibility of a quibble, and indeed there is a reasonable quibble to be made, namely that they fail to use decreasing sulfate levels post 1990. In contrast, Streets, DG et al (GRL, 2006, “Two-decadal aerosol trends as a likely explanation of the global dimming/brightening transition”) show a marked decrease in total global aerosol optical depth post 1989, driven primarily by reductions in sulfate, first in the FSU and Eastern Europe, then to a lesser extent in the US and Western Europe. The increases in Asia are not great enough to cancel these decreases. Other studies make similar findings. See Fig. 3 in Streets et al.
Additionally, I don’t see that Lean et al include the effects of black carbon on Arctic sea ice and glaciers; few studies do. Those that do include this effect find the effect is large: Mark Jacobsen (Stanford) published a paper on the subject in 2004, and among several other recent papers, there is also Flanner, MG et al (JGR, 2007, “Present-day climate forcing and response from black carbon in snow”). Scientific American wrote the following article about the results of Flanner et al:
http://www.sciam.com/article.cfm?id=impure-as-the-driven-snow
To the extent that Lean et al failed to recognize that sulfate was declining post 1990, and didn’t include black carbon effects on Arctic sea ice, warming in recent decades then gets attributed in their regressions to something else. That something else is largely GHGs. If they had included proper recognition of these two non-GHG forcings, their modeled GHG forcing would have been lower.
I agree with your point about the PDO.
nobwainer (Geoff Sharp) (17:32:05) :
If you understood the theory you would know that you cant use an X-Y scatter plot.
Nonsense, you can always make a scatter plot. If need be you can make the symbols for the data points of different color or shape. For example, you can make the points that don’t fit a different color [red], and then explain why all the red points are out of whack. If your only support is eye-balling, you’ll have a hard time convincing anybody.
M Sowell
“I disagree, as I know that it is happening, with men of sound judgement and prudent investing standards.”
When one looks at the extravagant subsidies offered for renewable energy sources by governments, you’d have to be a FOOL not to invest! Guaranteed profits and success! Full protection from competition…compliments of the US government! All paid for by the duped taxpayers.
And for what?
To save the planet from global warming, when in fact it is cooling. Sorry, but is just doesn’t get more folly than that.
Renewalbes are competitive only when massively subsidised. Without the huge massive subsidies, the renewable industry collapses in an instant.
Rodger E Sowell
re your “the Engineers are on it”
Having lived in Italy for more than 25 years and being an engineer I have yet to see a windmill in Italy, I hope that the trend continues, Italy has for decades been using excess energy to pump water into man-made lakes as high as possible in the mountains, when a demand for more energy is called for the water in the lakes is released into pipes which in turn drive turbines at the lowest point possible, the water is then collected in another lake to await an energy excess to be pumped back up to the high lake, all that water makes for good fishing, water sport, camping, natural beauty as the man said, wind turbines are a bottomless pit, we had trouble at work with a new model truck, the EU licensing authority said that it had to much drive-by noise, I asked one of the inspectors if he had stood 500 meters away from a wind turbine?
Leif Svalgaard (19:56:11) :
Nonsense, you can always make a scatter plot. If need be you can make the symbols for the data points of different color or shape. For example, you can make the points that don’t fit a different color [red], and then explain why all the red points are out of whack. If your only support is eye-balling, you’ll have a hard time convincing anybody.
A scatter plot is a waste of time, its a weak attempt at changing the subject. I am still waiting for an answer to my original question:
“Or perhaps that you dont understand the graph.
Perhaps you could tell me your understanding along with where you think it falls down?”
DennisA (14:08:44) :
I was wondering what sort of temperatures we would have to realise in order to melt this lot in the next five years?
In a normal summer about 75-80% of that lot will be gone by september.
nobwainer (Geoff Sharp) (05:00:56) :
A scatter plot is a waste of time, its a weak attempt at changing the subject. I am still waiting for an answer to my original question:
“Or perhaps that you dont understand the graph.”
I think you have wasted more time trying to avoid such a plot than it takes to make one. And I can answer: “I don’t understand the graph, because you have not discussed it”. What I see by just looking is that there is no correlation.
“I disagree, as I know that it is happening, with men of sound judgement and prudent investing standards.”
If ADM thought they could make money processing that bean, they would already have the processing plants under construction and farmers would be clamoring for seed. Farming is a business.
It will be what it is. If it is cost efficient to produce it, it will be produced.
Ron de Haan (23:38:46) :
“Start reading and heal yourself.”
Hi Ron,
I read this site every day. You missed my point, or perhaps I was too terse. I was simply pointing out that the prediction made in the 1997 article did not come to pass. That’s why I quoted the line stating that souther hemisphere ice has been increasing, not decreasing. I’m old enough to remember when the consensus was a new ice age and millions of starving people etc etc.
-Burch
Pierre Gosselin (03:09:03) : re the subsidy argument.
Some perspective on subsidies:
No doubt, there are some subsidies. Many, many, industries have subsidies. AKA tax breaks. Farming, to name just one. Nuclear power plants get massive subsidies. Chrysler was bailed out a few years ago. Now many companies on Wall Street got massive subsidies — or is it bail out money? Yet some companies were allowed to fail…the Fed playing favorites?
As a matter of fact, the California tax credits (subsidies) for many renewables expired in 2008 – but there is a carryover provision for some of them.
Currently, California has 26 different tax credit categories for individual tax payers. There are also 24 tax credit categories repealed this year. Very few of them are in renewable energy.
Countering the state’s elimination of tax credits, there are more Federal tax credits thanks to Congress and President Bush.
Perhaps you are not in favor of a patent or the patent system, either? That gives the inventor the exclusive right to make and sell his invention for 20 years! Not very competitive, is it? Copyrights also give authors exclusive rights for much longer than a patent! The copyright exists for life of the author plus 70 years! Not very competitive, is it? (there is also a form of copyright that lasts for 95 years, another for 120 years). Trademarks can last virtually forever…not very competitive, is it?
And I do not believe it (tax credit) is at all motivated by saving the planet from global warming. More likely economic, as in trying to reduce dependency on foreign oil. And btw, we do not send $700 billion annually overseas to unfriendly nations to purchase oil. Nowhere near that.
Now, where the true save-the-planet thinking occurs is in California, with their AB 32 Climate Warming Solutions Act of 2006, as I have commented on before in WUWT.
The governments have frequently dabbled in incentives, tax credits, subsidies, tax breaks, and giveaways of many forms. Welfare is one. Food stamps another. College funding is another. Some say the trucking industry was unfairly subsidized when the government built the interstate highways, to the disfavor of the railroads. Others say nope, the railroads were given land grants to build their tracks, so it works to balance out.
Subsidies are nothing new. Why should anyone be unhappy with those particular subsidies for renewables, but not the others?
Roger E. Sowell
Marina del Rey, California
Alan Chappell — re wind power
From World Wind Energy Association:
“By the end of the year 2008, 120 Gigawatt of wind power capacity were installed worldwide, after 94 Gigawatt by the end of 2007. Already today wind provides more than 1,5 % of the global electricity consumption and the wind industry employs half a million people. Currently, 80 countries are using wind energy on a commercial basis, with the main shares in Germany, USA, Spain, China and India which still account for three quarters of the global wind installations.”
I cannot comment on what Italy is doing and why. I worked there off and on on consulting assignments, from Milan down to Taranto and in Sicily. But from the above statement, and I have not confirmed its accuracy, 80 countries are in the wind-power game. Perhaps Italy has insufficient wind resources? Perhaps Italy has adequate base-load power and pumped-hydro resources? The geography of Italy is likely unique, with a mountain range running down the middle of the entire country, and the Alps across the northern portion.
My “engineers are on it” statement refers to the energy storage problem.
Roger E. Sowell
Marina del Rey, California
The percentage breakdown for the energy balance has to be highly variable depending on the season. For more than 6 months there is no incoming radiation and outgoing IR continues at a constant rate until ice capped. (The graphic appears to apply only to an open water scenario). After September there will be a lot of heat off open water sent off to the outer planets never to return. So, on balance, which has the more negative energy input, sea ice albedo or outgoing IR?
Can anyone suggest where I can get the plot points for ’79-’00 (ant)arctic ice extent averages?
“By the end of the year 2008, 120 Gigawatt of wind power capacity were installed worldwide,”
Beware of these “capacity” figures as wind capacities were found to be overstated by more than 2x from reality recently in the UK. The figures being presented as generating potential from the turbines are fantasy. Lets see how much power was actually generated from them for the year, not what their potential “capacity” is. I believe you will find actual generation was much below their “capacity” to generate.
They all seem to be proud of their “capacity” numbers but has anyone seen any actual generation figures? Every single article and paper I have seen shows nothing but theoretical capacity numbers. I haven’t seen anything that shows actual generation numbers. Believe me, every utility knows exactly how much actual power they have generated from wind, but none of them seem to be very proud of that number as none of them publish it, instead publishing only their “capacity” increases, not actual generation numbers.
The weather in the UK has kept the wind generation greatly under capacity this winter with calm days reducing output and ice buildup causing units to be taken offline. It would greatly surprise me that with 120 Gigawatts if more than 40 gigawats were actually generated.
It also appears that some articles on production are simply using the stated “capacity” to figure TWh generated rather than using actual metered output of real power generated.
In short, I don’t think anyone knows how successful or unsuccessful wind has been.
Or if it’s heavily subsidized…