I got to thinking from discussions with Steve Mosher and others at Climate Audit about just what sort of adjustments might be made to a place with a good record and little in the way of station moves, and that had changed little in 100 years.
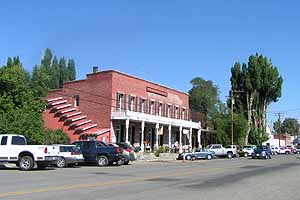
One place came to mind that I’ve visited; Cedarville, CA
It has it’s issues, such as the Stevenson Screen being encroached upon by things being built around it, like a new concrete pad for the Forest Service office.
Click for larger image and other photos from surfacestations.org
But as the town goes, it has changed very little in 100 years. There is no Interstate highway nearby, its off essentially in the middle of nowhere by itself, a self contained agrarian community, mostly hay farmers. The small main street has many of the original buildings from 100+ years ago:
This is the sort of view (below) you can see to the east of the town, open land as far as the eye can see. It is definitely rural.

Image above from the Surprise Valley website
Here is a Google earth view. The weather station is at the far north end of town.
According to US census data:
As of the census of 2000, there were 849 people, 381 households, and 249 families residing in the ZCTA of 96104. The population density was 3.2 per sq mi. There were 457 housing units at an average density of 1.6/sq mi.
There are only 3 missing years all the way back to 1894, so it seemed like a good candidate. 1894 is a partial record, 1915 and 1957 are also partials with not enough data to complete the yearly average.
So this seemed like a really good candidate to test for what adjustments GISS might make to it.
I plotted the GISS provided USHCN data and the homogenized data from the GISTEMP website and the graph for that is shown below:

click for a larger image
Note the missing year at 1957, 1915 should have not plotted also, but for some reason my program insists on doing so.
But the important thing is that once again, GISS has made the past colder and the present is unchanged. Even more odd, the far past prior to 1900 is adjusted upwards, warmer.
Yet it is the recent past to present when the most change has occurred in Cedarville, such as the addition of a concrete pad to the Forest Service building, etc. If anything, pre 1900 data should likely be colder because exposure of thermometers was not standardized until after the US Weather Bureau was formed in 1892.
They seem backwards. Why does GISS do this? We’ll find the answer.
Why does GISS do this? We’ll find the answer.
Anthony, my first reaction is to apply the old adage, “follow the money”, but I suspect it’s a whole lot more complicated than that. I think Bob Carter came pretty close in his email to me last fall (which I posted here a while back), when he said:
While, for some, it probably is all about money, for others I’d be willing to bet it’s nothing more than winning the debate, or, more appropriately, not losing.
Anthony,
If that’s the raw data it hasn’t had the USHCN adjustments for TOB and instrument changes. Could that be part of the difference?
check nightlights
nightlights is 0. hmm. Check the giss data for combining with other
stations, second option at giss temp. It should match the raw.
It looks to me like the adjustments over the ENTIRE seires is exactly backwards. They’ve adjusted down when it should have been up, and up when it should be down.
This leads me to 2 possible conclusions:
1) The person(s) responsible for the maintainence of this data is/are incompetent.
2) It has been done deliberately to show “flatness” in the temp trend for 100 years, with an artificial hockey stick uptick starting in the 1990s.
Who is in charge of this data? GISS?
REPLY: Dr.’s James Hansen and Gavin Schmidt at NASA Goddard Institute for Space Studies (GISS)
So then, both of my conclusions are plausible…..
I have read that James Hansen was awarded a $1,000,000 dollar Dan David Prize for his work in science. I don’t know what year that was, but this year the million bucks goes to Lonnie Thompson.
That sort of incentive will buy plenty of deliberate incompetence.
We’re obviously on the wrong side.
Anthony, I have a couple of questions.
-When did these step-function adjustments (like Miami) begin to appear? Have these ALWAYS been in the record?
-If they have not always been in the record, did thier appearance in the record coincide with Hansen’s work in the mid-late ‘1980s?
Sorry for the multiple posts, but I have one more question.
If these adjustments have not always been in the record, is there any documentation at all as to when and why they were done? I’m guessing not, since the main question here is “why?”
I have a better question: Why does GISS not want us to know they are making changes to the historical record by not documenting these changes?
In the case of the Miami series, they have -.4C adjustment in 1920, going to zero adjustment today.
How much did we warm in the 20th century? .5C? Is this “warming” nothing but slight-of-hand manipulation by GISS?
REPLY: Too many questions, not enough Anthony to go around, help please?
Wow, a millyun bucks for hiding data, making calculation errors, and being a general [snip]. I can do that!
Can someone explain to me why between 1920 and 1955 this station was reading 1 deg C too low such that sometime in the 1990s someone was able to discover the error and knew how to correct it? I’d have gotten kicked out of school or fired for this kind of backdating. CEOs have gone to prison for less blatant curve fitting. Instead we base national policy on the adjustment?
N.B. Of course “too low” meaning adjusted lower the readings being too high. Sorry for the vague language.
Anthony:
I asked the other day whether these stations were actually included in the GISS (US or Global) average anomaly calculations. If you have already answered, I did not find it.
REPLY: Another person did, yes they are. The fact that they are 1) USHCN stations, and 2) In the GISS database, answers the question.
Thanks. I would think that GISS would use a little common sense in selecting it data. Something perhaps a little more than robust than “USHCN records this data so it must be OK”.
Its a shame we are not likely to get an answer fro GISS about the questions raised here.
REPLY: Well I’m going to try. They deserve the chance to answer the questions and to explain why this is either valid or a flaw.
One thing that raising pre-1910 data did, in addition to more or less smoothing the pre-1990’s record to allegedly make way for a hockey stick, was to wipe out the evident (if you squint) long-term upward trend, perhaps recovery from LIA. This would tend to emphasize posited recent, anthropogenic influences and de-emphasize natural ones.
“and the hockey stick reappears like magic”
Got to LOSE that pesky PDO, Russ?
“Well I’m going to try. They deserve the chance to answer the questions and to explain why this is either valid or a flaw.”
I would be very interested indeed to know what they say. (I doubt any of the rest of us would even make it past the gatekeeper.)
What concerns me most is that we will get a replay of past response. There has in the past been at first a reaction of pooh-pooh … as if the person offering the critique could not possibly understand all that was involved and that somehow what the person has found “does not matter” in the overall scope of things. And then something is changed but it is never documented exactly what changed and why. Data gets replaced and the new data is different and the old criticism now doesn’t make sense but the new data isn’t right either. It just appears to be a never-ending game of cat/mouse. More like “hide the pea” really, where one side gets to change where the pea is hidden at will.
And finally to top it all off, some big “name” will come along (Gore, et al) and “stand behind” the results and cast anyone who would doubt it as being a weirdo or something.
It is sad, really, to see what used to be science at one time turn into nothing more than a political marketing campaign.
[…] Cedarville and GISS adjustments I got to thinking from discussions with Steve Mosher and others at Climate Audit about just what sort of adjustments […] […]
Hey, congrats to the Rev!
He’s hitting the top tier, and with just the right buckshot.
There may be a better place to post this question, so my apologies in advance for not knowing where that is. On the subject of surface temperatures, someone recently commented on the urban designation of Las Vegas, and that got me to thinking about my visits to that area over the decades. The weather there seems to be warmer now. Although my personal experiences have limited scientific value, there is an empirical observation worthy of note. The Las Vegas area has had a dramatic increase in lawn watering, irrigation, water attractions, and vegetation. Is it possible that these development lead not only to increase humidity, but also to increased temperatures since water vapor is such a powerful greenhouse gas? Water vapor appears to be a local phenomenon. I recall a couple of years ago seeing temperature trends for a valley in California. The mountains had no temperature trend, but the valley which featured irrigation and vegetation development had increased temperatures. That is not consistent with my understanding of GCMs output. Could local water vapor – from human activities – be an additional reason for temperature trends beyond typical UHI considerations?
REPLY: You are thinking of John Christy’s paper, where he shows that Tmin has been affected by irrigation, I’ll see if I can find it, I have it somewhere.
I was looking at a posting on the elder Mr. Pielke’s site today when a thought came to mind. If I have a station whose output is such that I must look at surrounding rural stations in order to adjust it to be “less bad” then I am probably better off simply discarding the data from that station than “adjusting” it. While I might be able to create something that approximates the climactic conditions at the site, it will probably still be wrong and wrong information would bias the result. So I would be better served to simply discard that data.
I am not convinced that simply having more stations for the sake of having more stations is a good thing. If many of them are biased by local microclimates, then I am better off not using them at all than in attempting to use a bunch of mathematical bailing wire to get the thing to “fit” the surrounding measurements.
Reply: Bingo!
GISS has got to get rid of those warmer 1930s. So, cool them down and raise pre 1930s, then the whole series starts to look flat once smoothed and combined, and the hockey stick reappears like magic.
Warm 1930s, check. Strange “glitches” near or at the ends of both world wars, check.
Late WWII: Massive particulates and aerosols? City firestorms? Massive aerial bombing Full War production Comtrail hell? Could all that have caused a blip?
Evan, a blip, perhaps, which might have lasted a couple years, like a good volcano. But long-lasting effects? Nah.