Popular claims that CO2 changes drive temperature changes currently or throughout the distant past “are based on imagination and climate models full of assumptions.”
A comprehensive new study details a stochastic assessment determination of the sequencing of CO2 variations versus temperature variations since the 1950s, over the last 2,000 years (the Common Era), and throughout the last 541 million years.
The robust conclusion is that the causality direction – with the understanding that causes lead and effects lag – clearly shows the temperature changes lead and CO2 changes lag on yearly, decadal, and centennial/millennial scales. In other words, “the reverse causality direction [CO2]→T should be excluded.”
The claim that CO2 increases drive temperature changes is thus a “narrative” only, as the claim that “humans, through their emissions by fossil fuel burning, are responsible for the changes we see in climate” can be regarded as a “non-scientific issue.”

Image Source: Koutsoyiannis, 2024
The author has had a series of peer-reviewed scientific papers published supporting this same T→CO2 conclusion (Koutsoyiannis et al., 2022, Koutsoyiannis et al., 2020, Koutsoyiannis et al., 2023, Koutsoyiannis, 2024, Koutsoyiannis, 2024) in just the last few years.
Since these papers challenge the prevailing anthropogenic global warming (AGW) narrative so acutely, Dr. Koutsoyiannis has understandably been the recipient of antagonism bordering on vitriol from AGW proponents. This includes comments from peer-reviewers. So, in an apparent effort to foster transparency, he has made the peer reviewers’ comments on this latest paper public. Here is the link to these commentaries:

Peer reviewers’ exchanges with Koutsoyiannis in “Stochastic assessment of temperature–CO2 causal relationship in climate from the Phanerozoic through modern times.”
“Since these papers challenge the prevailing anthropogenic global warming (AGW) narrative so acutely, Dr. Koutsoyiannis has understandably been the recipient of antagonism bordering on vitriol from AGW proponents.”
Dr. K is a heretic and a thought criminal. This is an unforgivable sin against The State and Big Brother. Lock him up. /sarc
I can only like this comment once, not the 1,984 times I’m tempted to.
Dr. Koutsoyiannis is a fool.
And RG is a moronic anti-science idiot.
Dr. Koutsoyiannis has several magnitudes more comprehension of science than RG will ever have.
And he is able to back up what he says with evidence…
.. something RG is completely unable to ever do.
You chose to be a buffoon instead of publishing a cogent rebuttal.
Epic Fail!
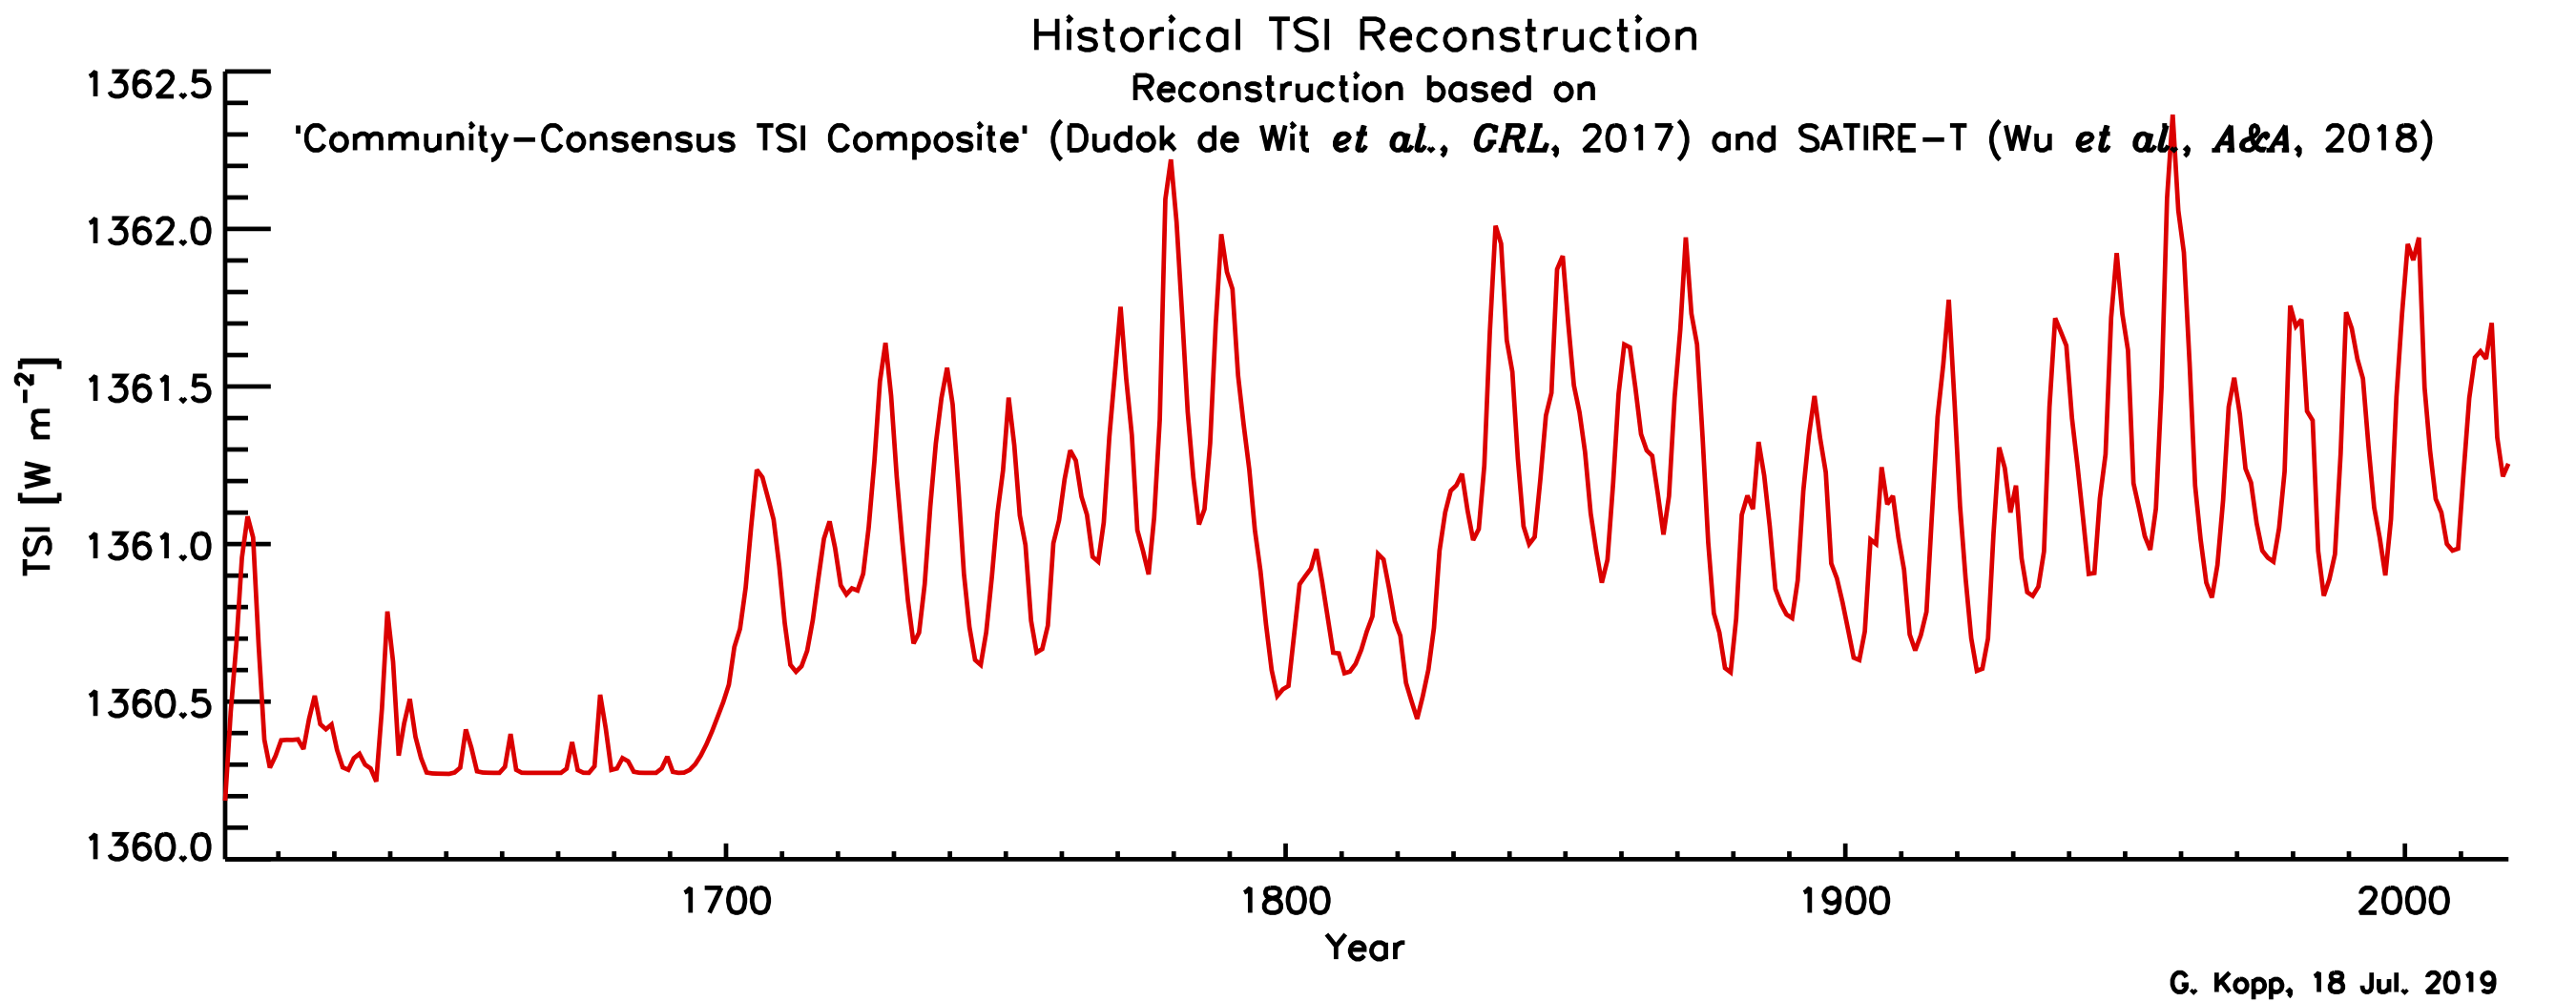
The Sun’s output has been at its highest level over the past 100 years of any time in the past 400 years.
https://lasp.colorado.edu/lisird/data/historical_tsi
The Sun warms the oceans that can hold heat for more than 100 years and the extra heat keeps accumulation,and the oceans warm the atmosphere.
And only the Sun can warm the ocean. Back radiation from CO2 cannot penetrate the oceans surface. And don’t forget Earth’s declining Magnetic field strength giving the Earth less protection from that stronger Sun.
Story tip:
https://www.zerohedge.com/energy/biggest-us-solar-storage-project-launches-nevada
How long does that 1.4GWh last the people of Nevada?
The problem with all these quoted ‘up to’s ‘ is they are only possible for fleeting periods of time. For solar it’s on cloudless days for a couple of hours, for wind it’s only if the wind speed is just right. Unless they show a proper comparison to proper power production they are meaningless. In the UK the average onshore wind production is 16% of the quoted ‘up to ‘ and now even more are planned.
“can”
“up to”
But never will
Never mind, let’s waste the money anyway, reliable energy will come to the rescue
Nobody expects the peer review inquisition…
My old school motto was: Mores facit homo – manners maketh man.
Winchester?
Elliott. Secondary modern, Putney
Yes we had mottoes back then. Now it’s mission statements
The “well reasoned scientific response” amounts to “Don’t give me no lip”?
This explains how Shula and Ott (https://www.youtube.com/watch?v=JtvRVNIEOMM) can demonstrate that the GHE has never been observed in nature, but only modeled in software.
Arrhenius had the GHE all worked out in 1896. Without software.
RUBBISH,
Arrhenius had zero clue about the action of CO2 in the atmosphere.
He couldn’t even get his dimensions on his formulas.
His model was totally juvenile and not remotely based on anything real.
He invented a baseless conjecture.. and that is what it still remains.
Lookie here, Stokes is pushing Erronius…
Nearly immediate debunking by Angstrom (whose work was based on observation, and bears up under scrutiny), Arrhenius never observed his theory in nature or experiment. But watch the video on Tom Nelson’s channel, linked above, since Shula defends their work much better than I could ever hope.
“whose work was based on observation, and bears up under scrutiny”
His observation was of transmission in a cylinder in the lab. And he got it wrong, where even Tyndall forty years earlier could do it. A and Å were both scrutinised; no-one accepts the Ångstrom version.
Arrhenius never made any observations on the atmosphere at all.
He just invented a BOGUS conjecture on a BOGUS atmosphere, using BOGUS maths.
Nobody cares if you and your climate cultists don’t comprehend Ångstrom’s version.
Ångstrom had FAR more correct than Arrhenius.
Read and learn, don’t be a brain-washed twit all the rest of your life.
https://scienceofclimatechange.org/wp-content/uploads/Clark-2024-Nobel-Prize-Errors.pdf
Wrong Angstrom, Nick. There were three generations of them, all very prolific in the field of radiation. I believe that the inventor of the pyranometer, Anders Knutson Angstrom, actually measured the radiation from the sun, and found it in contradiction to the theoretical work of Arrhenius.
Grandpappy Anders Jonas Angstrom was improved by Kirschoff, who credited Angstrom’s earlier work.
This is muddled. Grandson Anders was born in 1888. He would have been too young for this controversy. That was his father, Knut.
If being off by 400% is having the GHE “all worked out,” then, yes. 🙄
The MAIN point is: CO2, much less, human CO2 (2 orders of magnitude SMALLER than natural sources and sinks of CO2), has no data proving that it can cause meaningful warming. Moreover, given the current saturation of CO2 in the atmosphere (See William Happer, Australia lecture, 2023), any additional human CO2’s warming effect is negligible.
Don’t confuse maintaining homeostasis with warming.
The vast majority of [net warming] is contributed by water vapor. Together with cloud, it accounts for 98% of the greenhouse effect.
***
Arrhenius’ estimate of 5-6˚K for the accompanying increase of surface temperature (Sec. 1.2.4) [due to added CO2] then translates into ~4˚K. Yet, the observed change of global-mean temperature since the mid nineteenth century is only about 1˚K (Sec. 1.6.1). The discrepancy points to changes of the Earth-atmosphere system (notably, involving the major absorbers, water vapor and cloud) that develop in response to imposed perturbations, like anthropogenic emission of CO2.
Physics of the Atmosphere and Climate, at 249, Murry L. Salby (2016)
“If being off by 400% is having the GHE”
Crap maths. Arrhenius predicted 4˚C per doubling, at equilibrium. Looks like we’ve reached 1.5˚C increase after 0.6 doublings. But much of that increase is recent, so it is far short of equilibrium.
“any additional human CO2’s warming effect is negligible.”
According to Happer’s paper, calculated with a 1D model, it is 2.2˚C per doubling, same as other’s get by these methods (which leave out a lot of feedbacks). Here is his table:
Maximum by radiative process calculation, under a non-Earth atmosphere conditions.
Thing is, radiative process are massively over-ruled by other atmospheric in the real atmosphere.
Do you have any measured evidence of CO2 warming in the atmosphere.
Or it so TINY that it is immeasurable 😉
Nick wrote, “Looks like we’ve reached 1.5˚C increase after 0.6 doublings.”
Let’s go ahead and do the arithmetic.
If you don’t cherry-pick an unusually warm year for your endpoint, a better estimate would be 1.2 ±0.2 ˚C. WHO says 1.15 ±0.13°C, and NCA4 says 1.14 ±0.13°C since the “preindustrial” LIA, but there’s been a smidge of additional warming since NCA4, and IMO those confidence intervals are overly confident.
However, even if you attribute all the warming to human influence (a very dubious assumption!), not all of it was from CO2.
AR6 estimates that 76% of the warming is from CO2. (CO2 accounts for only perhaps 60% of the forcing from non-condensing GHGs, but aerosol/particulate pollution etc. reduces total warming, thereby increasing CO2’s percentage of the total.)
That means we got about:
76% × 1.2˚C = 0.91˚C of realized warming from CO2
Since we’ve had log2(423/280) = 0.595 doublings, that makes “practical climate sensitivity” equal to:
(76% × 1.2˚C) / 0.595 = 1.53˚C / doubling
If realized warming is halfway between TCR and ECS, and if ECS = 1.5× TCR,
then ECS = 1.2 × 1.53 = 1.84˚C
and TCR = 0.8 × 1.53 = 1.22˚C
Caveat: Those figures have pretty big uncertainties, perhaps ±30%.
Even so, they’re obviously far below the IPCC’s central estimates, and far below the built-in assumptions in almost all climate models.
Nick,
Having just worked through the first hour of the Shula and Ott reference from commenter dk_ above, can I please recommend that you also study it.
It is the first comprehensive, observation based dissertation I have found, after much searching, that puts the common Establishment story in context and shows it to be unsupportable.
It rejects that Arrhenius did what you said, a claim that I hope you are capable of withdrawing from.
Geoff S
No, Geoff, I am not going to watch 1hr 53min of crank video, especially when it is introduced with so obviously false a claim. If you can write down the main arguments, please do.
so you know it’s crank without looking at it, impressive
Only “crank” here is Nick.
He has reach peak anti-science AGW cultism. (if such a peak exists)
Nick wants to remain DELIBERATELY IGNORANT.
His senile mind cannot accept or cope with anything else.
Every claim Nick has made recently is PROVABLY just mantra BS. !
If you were actully interested in accuracy, you could read transcript or presentation at Tom Woods’ substack.
But this would require both curiosity and literacy. You should show at least a little interest because you are indirectly mentioned: Shula quotes
which one(s) are you?
“They are Noble Lies, Political Lies, Ignorance, Stupidity, and Greed.”
Nick is a combination of all 5.
Your quote cofirms that it is crank stuff, not science.
This is a simplified presentation that you might finally understand:
Mid 2024 More Proof Temp Changes Drive CO2 Changes
LINK
Every time El-Nino comes along the CO2 emissions increases, when it goes away it drops back down.
Nick’s comments confirmshe is one of the cranks.
He has no science.. he is devoid of it and determined to avoid any actual science at all..
.. no matter how incredibly low his credibility sinks into the sewer.
Will Happer is correct about Nick on at least the first 4 points.
Which you determine without reading it. How scientific of you.
HA HA HA that is why you are falling behind because you can’t articulate a counter to it yet you call it a crank without watching it my my your prejudice is big today.
Is Arrhenius above criticism? He got it perfect?
If there is a criticism, let’s see it in writing.
He used a totally BOGUS model of a totally BOGUS atmosphere.
What he put forward was pure conjecture based on a very limited understanding of the atmosphere…
On top of that the dimensions on his equations don’t match. NOT SCIENCE.
Wannabe et al continued on with that BOGUS model of the atmosphere.
So you quote Arrhenius 1896 and not his subsequent effort of 1906. That in itself is telling.
And Arrhenius dialed it back in the 1906 paper even showed it to Nick who then proceeds to LIE about it even when I made several large quotes showing that he significantly reduced the CO2 effect.
Arrhenius though increase in CO2 was good for us to a fact Nick and his foggy crow never mentions.
I quoted below his 1908 book “Worlds in the making”
“If the quantity of carbonic acid [ CO2 + H2O → H2CO3 (carbonic acid) ] in the air should sink to one-half its present percentage, the temperature would fall by about 4°; a diminution to one-quarter would reduce the temperature by 8°. On the other hand, any doubling of the percentage of carbon dioxide in the air would raise the temperature of the earth’s surface by 4°; and if the carbon dioxide were increased fourfold, the temperature would rise by 8°.” (p. 53)
That just restates the figure calculated in his 1906 paper, and is the figure usually quoted today.
His “calculations” were based on near zero understanding of the atmosphere.
He used simplistic model on a BOGUS non-Earth atmosphere, and applied BOGUS, dimensionally-unbalanced formulas.
That is what modern climate NON-science is still based on.
Really Nick. listen to the Shula video, and try to come back into the real world…
… instead of that little mindless fantasy AGW world your mind is currently stuck in.
Don’t choose to be continually stupid.
But cited 1896 instead. Got it. 😉
I said
“Arrhenius had the GHE all worked out in 1896. Without software.”
He did. And he continued to write about it.
If he had to amend it, it wasn’t “all worked out”.
He had worked out the effect. He got some new data.
Absolutely anti-science rubbish
Arrhenius had never done any atmospheric measurements and was totally clueless about most of how the atmosphere operates.
His little model was simplistic, and used BOGUS maths, BOGUS modelling and a totally BOGUS non-Earth atmosphere.
That you think it was anything else, shows just how simplistic your understanding still is.
At best, Arrhenius demonstrated that CO2 was capable of absorbing IR and re-radiating IR. He came nowhere close to demonstrating that the net effect of numerous feedback loops was an increasing global temperature. That is what the extant software models attempt to do, but demonstrably end up running significantly warm in all models but one. Arrhenius did not speak to the processes of cloud formation increasing albedo, nor did he have any grasp of the seasonality of atmospheric CO2, demonstrating that the seasonality is driven by biogenic sources, even today. You are giving him too much credit. If he had it all worked out, what was his temperature sensitivity to a doubling of CO2?
“what was his temperature sensitivity to a doubling of CO2”
4˚C. Set out trenchantly in English in his 1908 book “Worlds in the making”
“If the quantity of carbonic acid [ CO2 + H2O → H2CO3 (carbonic acid) ] in the air should sink to one-half its present percentage, the temperature would fall by about 4°; a diminution to one-quarter would reduce the temperature by 8°. On the other hand, any doubling of the percentage of carbon dioxide in the air would raise the temperature of the earth’s surface by 4°; and if the carbon dioxide were increased fourfold, the temperature would rise by 8°.” (p. 53)
He used a totally BOGUS model of a totally BOGUS atmosphere.
What he put forward was pure conjecture based on a very limited understanding of the atmosphere…
… and really was totally ANTI-SCIENCE gibberish.
I have often maintained that the greatest ‘sin’ in science is to be right for the wrong reason. It demonstrates luck, rather than skill or understanding. However, when one isn’t even within 10%, it isn’t even luck.
In other words, despite your claim that “he had the GHE all worked out,” his calculation for sensitivity was 133% higher than the theoretical value commonly accepted for the last 30 years (which appears to be too high based on historical records). If your financial advisor promised you a return on investment that was twice what you actually received, would you consider him/her to be skilled in finances? Would you brag to your friends that you had a financial advisor who “had it all worked out?”
His calculation is well within the IPCC range. He allowed properly for water vapor feedback; I think you are comparing to the no feedback value (which he calculated as 1.6 C/cen).
IPCC: the platinum standard of science that rarely uses error bars, and when they are used they only rarely specify whether they represent 1-sigma or 2-sigma. The same organization that supports the idea that one can take many measurements of a variable and claim higher precision just because there are lots of samples of different things being measured with different measuring instruments.
“The same organization that supports the idea that one can take many measurements of a variable and claim higher precision just because there are lots of samples of different things being measured with different measuring instruments.”
The error bars they use are “sampling error” and not “measurement error”.
I have yet to see anyone in climate science or in defenders of climate science recognize the fact that the variance of the distribution is a metric for uncertainty. The wider the variance the shorter and more broad the hump around the average is. As the hump gets shorter and broader the probability that the average is the correct value gets closer and closer to the probability of surrounding values actually being the average – the definition of uncertainty.
I can’t find *any* climate science paper that I’ve downloaded that calculates the variance of the temperature database components let alone propagate that variance up the “averaging” chain.
I can’t recall any of the climate science defenders here on WUWT ever even mentioning the variance of temperature data distributions.
The statistical descriptor known as the “average” is *NOT* a complete description of a distribution. Not even close. Unless you are a climate scientist.
About what history shows us to be the case, even though WV feedback is obviously present. In other words, what he had worked out isn’t useful for predictions — much like today’s GCMs.
“He allowed properly for water vapor feedback;”
LOL.. which he knew absolutely nothing about.
So could not possibly have “allowed properly” for.
You truly are talking fantasy gibberish, Nick !
You should read this and try to let your grid-locked little mind accept some reality.
https://scienceofclimatechange.org/wp-content/uploads/Clark-2024-Nobel-Prize-Errors.pdf
I listened to the presentation and agree with a lot of what they said. In fact, it’s part of my own personal description of why CO2 does not cause warming. However, there’s one part that could be a showstopper.
They claim CO2 does not emit energy until quite high in the stratosphere. This seems to contradict Feldman et al 2015 where they have claimed to have measured increases in downwelling IR from CO2 that match the increases in CO2 concentration. It would seem they need to explain what Feldman got wrong.
I also believe CO2 emissions have been measured at various altitudes. Those would also appear to be impossible.
In addition, they seem to accept that CO2 absorbs surface IR very low in the atmosphere. I’m not an expert of the physics of absorption, but I understand Kirchhoff’s Law. It would seem to me that if emission is stifled by constant interaction with other gases, absorption would be stifled also.
Finally, radiation models don’t appear to agree with their claims.
This area needs further development or they will run into a brick wall.
Shula is opened questions. I assume Ott is also. Contact information is at Tom Woods substack and YouTube.
I can’t speak for them, nor defend their claims as well as they probably can.
“ Feldman et al 2015″
Used supercooled sensors, effectively changing the net radiative flux from the atmosphere to the sensor.
He also started his measurements at the base of a La Nina and finished at the height of an El Nino..
“radiation models don’t appear to agree with their claims.”
There is far more to energy transfer in the atmosphere than radiative models.
Balloon data analysis shows the atmosphere is controlled by the gas laws.
This was a really good video and raised some great points. It would be good to see this paper put on Watts Up for an open discussion (a point one of the authors of the paper also wanted to do).
Why would peer reviewers review the person and not the paper?
Fortunately, the answer to your question is obvious to anyone with an open mind.
That is a fallacy. That CO2 historically has responded to temperature change does not preclude the inverse. There has never been a mechanism to inject mass quantities of CO2 into the atmosphere on short timescales before, and there is now. CO2 is a greenhouse gas, by the laws of physics, and produces warming when the concentration in the atmosphere is increased.
The hubris on display in the authors testy replies to the paper’s reviewers is not befitting someone claiming to be participating in the scientific process.
No, it is not ‘by the laws of physics’. It is called the ‘Greenhouse hypothesis’ which is below laws and theories on the proof scale. To date, no one has been able to actually prove the greenhouse hypotheses except in real greenhouses. SMH.
Models all have the same, erroneous results BECAUSE they write the hypothesis into their models. Not ONE of hundreds of these models has been able to run backwards to prove anything. If your model says ‘Co2 causes warming’, your model is wrong and will always be so.
It is not a hypothesis, it is well supported by experimental and observational evidence. That a greenhouse effect exists is manifest in the fact that the earth near its surface is a temperature suitable for human life and not well below freezing, which would be the case in the absence of an absorbing atmosphere given the solar irradiance. That this phenomenon is the result of the so-called “greenhouse gases” is known from more than a century of radiative physics.
Which climate pseudoscience and trendology know next to nothing about.
Again .. the mindless AGW mantra.
Warming by atmospheric CO2 has NEVER been observed or MEASURED anywhere on the planet
Sorry, but you are wrong. Even NOAA calls it a hypothesis. What is a hypothesis? It is something that can be proven wrong, even if it has not yet been proven. If it can be proven, it can rise to a theory. Laws are absolutely true. Some theories can be disproven, but not many. Hypotheses come and go. This one will eventually go, because it isn’t responsible for the temperature of the earth.
“the earth near its surface is a temperature suitable for human life and not well below freezing,”
It is the atmospheric mass and its ability to hold energy that does that, bozo !
Nothing to do with CO2.
This is untrue. If it was true, you would be able to explain why cloud has reduced at all latitudes except just north of the equator:
 ?ssl=1
Reflected short wave globally is down 2.4W/m^2 this century while OLR is up only 1.3W/m^2. So the dominant cause of greater heat retention is a reduction in cloudiness with reduced reflected sunlight more than increased OLR. That is the result of less cloud. But it is reversed just north of the Equator. How is CO2 so selective where it is warming or cooling?
The observed changes in the radiative energy balance are clearly the result of changes in cloud. So what is the connection between CO2 and clouds and why is the process reversed for a few degrees of latitude just north of the Equator?
AlanJ,
Please study the link to Shula and Ott. It is material I have wanted to see for years to extend my knowledge of molecular spectrometry, which has been developing for much of my post-grad years.
It is not light reading, but if you need help just ask and I will try to answer. If I get no response from you I shall have to infer that you did not read it because you did not want to learn.
Same applies to any other reader.
Geoff S
the real mystery is just how much of any warming is due to carbon emissions vs. other influences- nobody knows- until they know definitively, the science ain’t settled- so the preaching should end
The increase in temperature from CO2 is unmeasurable. The energy regulating process is a function of the atmospheric mass and the properties of water. Additional anthropogenic carbon is a negligible contribution to the atmospheric mass so negligible contribution to the energy balance.
There are two significant factors driving average global temperature increase. The precession cycle is shifting the peak sunlight from the SH to NH. That transition began around 1500. The NH has a higher thermal response than the SH due to the higher proportion of land so the average temperature is increasing.
The sun output is heading toward a modern optimum, under similar orbital conditions that prevailed during the peak of the Roman Empire. The increased solar irradiance at Earth from 1714, at the end of the little ice Age, now totals 738ZJ. The solar irradiance at 1AU has been reconstructed based on sun spots. It increased from 1360.1W/m^2 in 1714 to 1362W/m^2 in 2023.
Most warming is occurring on the Greenland plateau in January. Up a staggering 10C in the past 70 years from minus 35C to minus 25C – and that is supposed to be dangerous warming.
Most of the measured warming is narrowing of the annual range. Minimums are increasing more than maximums.
Alan J wrote “It is not a hypothesis, it is well supported by experimental and observational evidence.”
And the fact that the minoan, Roman and Medieval warm periods were all warmer than now WITHOUT MAN’S CO2 is also well supported.
Please explain what caused this 1000 year cycle of warm periods and why that cause magically QUIT CAUSING WARM PERIODS in order to make room for man’s CO2 to be the cause of our current warm period. Right on schedule.
Don’t waste your time trying to educate the Climate Science Nutters here. Find an easier challenge. Such as teaching a three year old child to read the Wall Street Journal.
No-one can educate gormless brain-washed AGW-cultists like you RG.!
You are an empty AGW-cult ranter, with absolutely nothing to back up your extremely limited scientific understanding of anything to do with climate.
Alanj, everyone on this board believes polyatomic gas molecules have vibrational states. Radiative energy is transformed into vibrational energy, which sets off convective forces. What proportion of radiative energy is reemitted before the transformation into kinetic energy depends on the altitude. The radiative energy reemitted from polyatomic molecules can only heat the Earth’s surface if it is of a higher frequency than the radiation emitted by the surface. What wave lengths do you think get reemitted that heat the Earth’s surface?
“If your model says ‘Co2 causes warming’, your model is wrong and will always be so.”
If your model says CO2 does not cause warming then you are stupid and claiming almost100% of scientists since 1896 have been wrong. Apparently, there has been an extremely effective global conspiracy of scientists, for the past 127 years, to promote a greenhouse effect that does not exist? Is that what you believe? If so, YOU are stupid.
Do you have any empirical scientific evidence of warming by atmospheric CO2…?
… or is this just another totally empty Tourettes-style rant from a rabid climate kook.
LOL, you didn’t counter a single thing of his paper then you make a rant that everyone here has seen for the last 20 years, it is clear you have nothing against the paper.
YOU are the one displaying HUBRIS as you made a stupidly arrogant statement while you didn’t make a counterpoint or any kind of “scientific process” in your empty post.
You are pathetic!
There is too much wrong with the paper to address succinctly. The very basis of the author’s investigation into the modern era is simply wrong on its face – humans are responsible for the observed rise in the concentration of CO2 over the past century. That the author’s method indicates that the opposite is true is a damning condemnation of their method. I suspect part of the issue is that the author has neglected to exclude seasonal effects from his determination of correlation over the modern period.
You guys can do better. You can be skeptical of anthropogenic global warming without uncritically accepting every single piece of shlock generated that seemingly endorses your position.
Another empty and mindless mantra anti-science rant.
We expect nothing else from you.
“Another empty and mindless mantra anti-science rant.”
That is not appropriate. We all know BeNasty is in charge of the Empty and mindless mantra anti-science rant department here, and contributes a massive amount of climate nonsense for our amusement. His promotion from Website Village Idiot was justified when he came out of the closet as an EL Nino Nutter.
AL climate change is caused by El Ninos according to the El Nino Nutters:
Warming trend
Cooling trend
Flat trend
All caused by El Ninos?
La Ninas do not exist according to El Nino Nutters.
BeNasty might be paid by leftists to make silly anti-science comments that cause conservatives to be viewed as fools by all leftists.
Your pretence at science is getting totally ridiculous.
Show us the effect of La Ninas in the UAH data…
You have FAILED utterly so far.
Just like you have FAILED utterly to produce any empirical evidence of CO2 warming.
We are still waiting for something other than a 5-yearold ADHD style tantrum.
“humans are responsible for the observed rise in the concentration of CO2 over the past century. That the author’s method indicates that the opposite is true is a damning condemnation of their method.”
This statement is not supported by any valid analysis but rests on a series of very suspect assumptions. I think the work of Harde, Salby, Berry and others clearly falsifies it.
Harde, Salby, Berry are The Three Stooges of climate science. Three CO2 is 97% Natural science fraud Nutters.
Measurements mean absolutely nothing to you RG.
You have none for warming by atmospheric CO2..
Must be a deep-seated jealousy. !
Any of Harde, Salby, Berry has magnitude more scientific credibility than you will evah have. !
The works from folks like Harde contain egregious errors, such as conflating atmospheric residence time with adjustment time, and contradict direct estimates of the amount of carbon humans have burned since the industrial era and observations of the oceans acting as a net sink of carbon during the same period. See, e.g., the published comments on their work from scientists with relevant expertise in the field. I’ll reiterate that you are not obligated to uncritically accept every claim made by an AGW skeptic just because they’re saying things you want to hear.
The comments of AJ contain nothing but whinging and whining.
They show a total lack of understanding of scientific concepts.
No-one is obliged to accept anything he type as anything but baseless mantra regurgitation.
“There is too much wrong with the paper to address”
ie, AJ cannot counter a single darn thing. !!
Why should he exclude one of the strongest pieces of evidence that, at least short-term, temperature is driving the increase in biogenic CO2 and swamping any effect of essentially constant anthro’ emissions?
Because it isn’t evidence that temperature is driving CO2 across the modern era, it is evidence that the growing season causes an annual cycle in atmospheric CO2. You have concisely, though inadvertently, articulated why the analysis is misleading.
You have zero evidence that CO2 is driving anything but enhanced plant growth.
When investigating inter-annual and longer changes to the CO2 cycle, it is standard industry practice to use the published data (e.g. by Scripps CO2 program) that has had the (average) annual cycle removed from it. See Keeling et al 2017, for example.
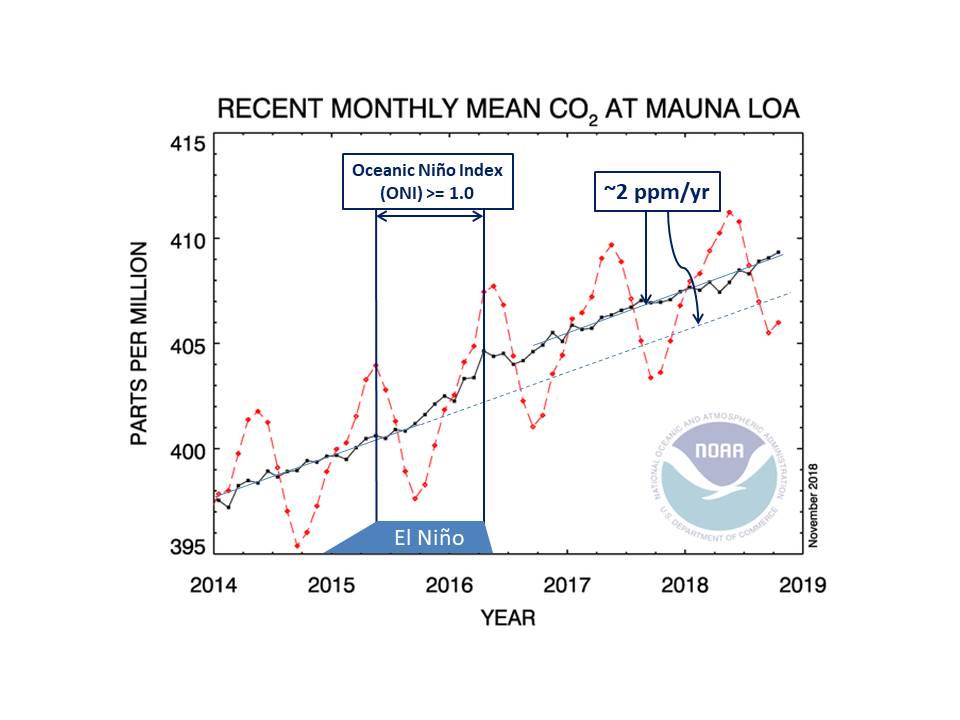
NOAA uses a similar approach and the following figure shows how the removal process highlights the change in rate of atmospheric CO2 growth (in response to the 2015-2016 El Niño). The rate of growth increases from around 2ppm/yr to 4ppm/yr. This change can also be seen in the ‘raw’ monthly data as an increase in the extent of the autumn/winter part of the seasonal cycle as mentioned below by Clyde Spencer but, in my opinion, is better highlighted by the removal of the regular seasonal cycle contribution.
Jim, this chart showing 12 month CO2 changes vs ocean atmospheric temperature clearly indicates that the ocean temperature drives the rate of CO2 increase.
There is a spike in the CO2 rate at El Nino events as you show above.
There is also an increase in the CO2 growth rate in line with the step change in the ocean temperature from an El Nino event.
Fluctuations in the El Niño-Southern Oscillation (ENSO), as reflected in the sea surface temperature (SST) values in the Niño-3.4 region in the equatorial Pacific Ocean, are clearly a major driver of changes in both global atmospheric temperatures and the growth rate of atmospheric CO2.
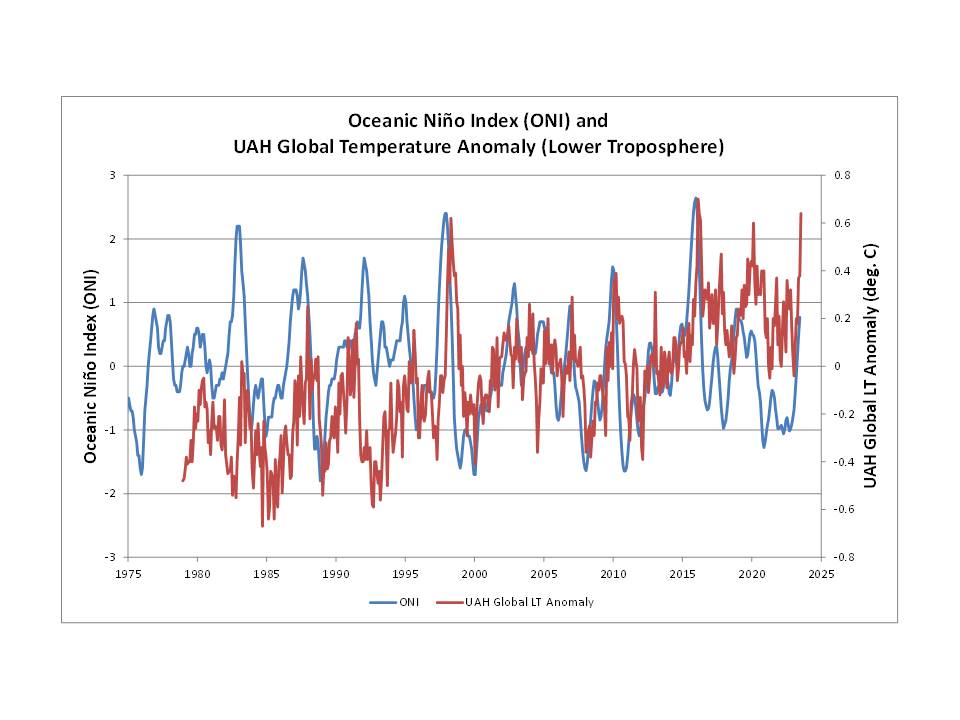
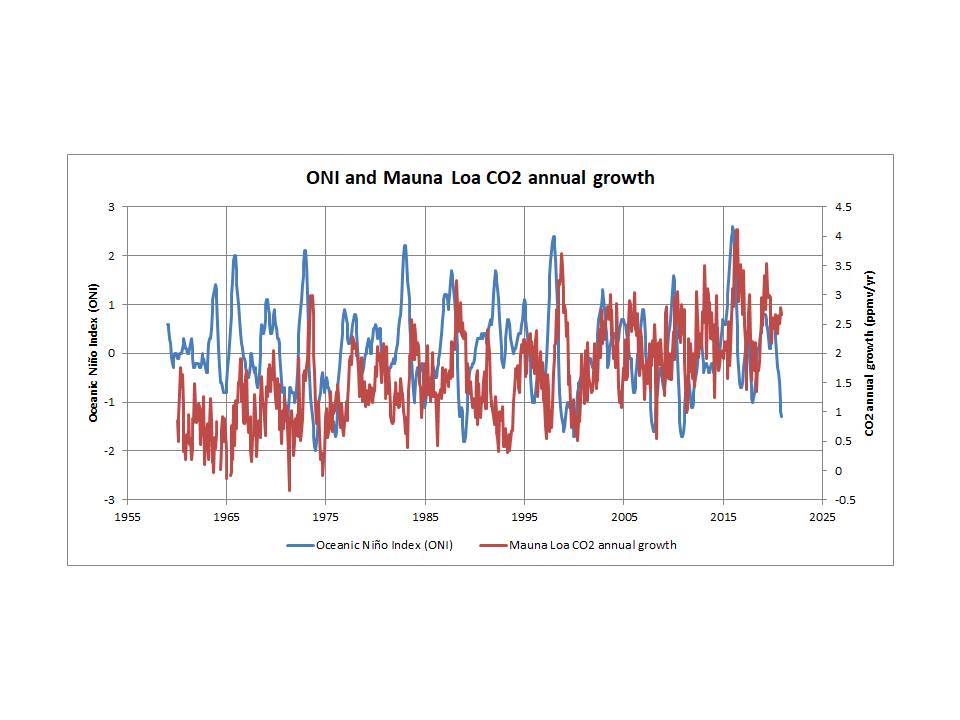
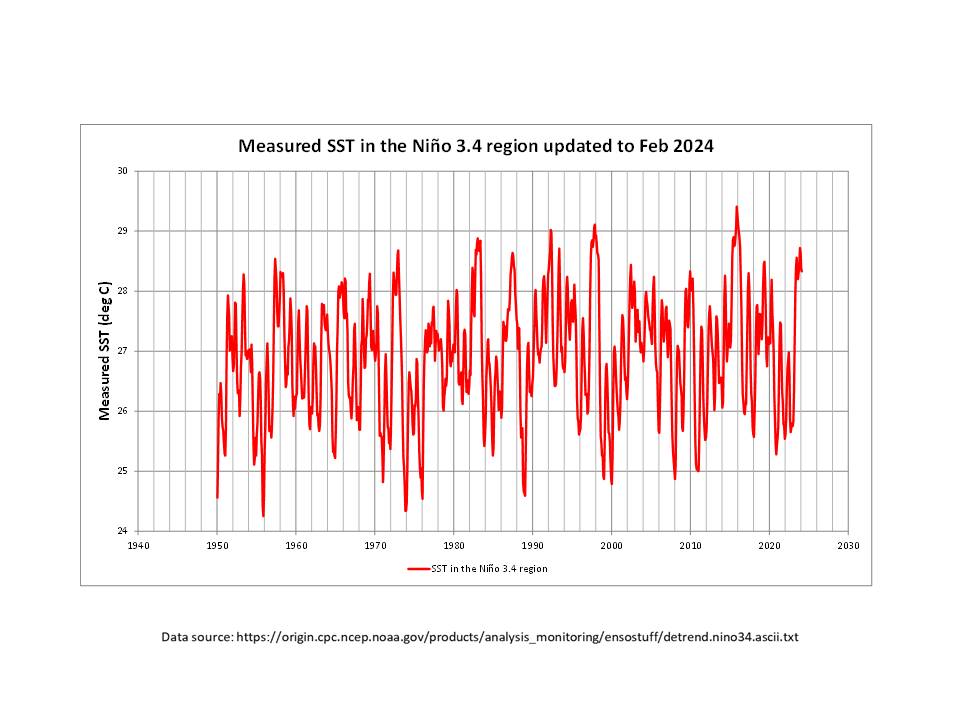
Note that in both relationships, Pinatubo over-rides the ENSO effect.
It is also necessary to keep in mind that the Oceanic Niño Index (ONI) values are actually de-trended using a moving 30-year average applied to successive 5-year periods. So, they appear to be neutral over time. However, based on the following SST plot (which has not been de-trended) it is evident that, since 1950, both minimum (La Niña) and maximum (El Niño) SST values in the Niño-3.4 region appear to have increased by at least 0.5C and perhaps as much as 1C (which would equate to 0.14C/decade).
It isn’t the “growing season” that is driving the increase. It puts a temporary stop to the increase in CO2 concentration and even decreases the concentration because of photosynthesis. On the other hand, the growth of biogenic CO2 is driven by increasing temperature, especially in the Winter. The northern hemisphere peak in CO2 in May has been increasing for decades. The problem is, even though photosynthesis is a powerful sink for CO2, it can’t operate long enough to compensate for the increasing peak.
Something else to keep in mind is that the incremental atmospheric CO2 has a different average 13C/12C ratio from that of the regular photosynthesis/respiration cycle. There are two distinct processes involved in terms of the net effect of atmospheric CO2 growth variations due to different source/sink combinations. This is clearly demonstrated by the use of ‘Keeling plots’ which are based on mass balance principles. Since both 13C and 12C are stable isotopes, both must be compliant. The relevant equations lead to a plot of atmospheric δ13C (which reflects the 13C/12C ratio) against the reciprocal of atmospheric CO2, where the intercept reflects the average net value of the δ13C of the incremental CO2.
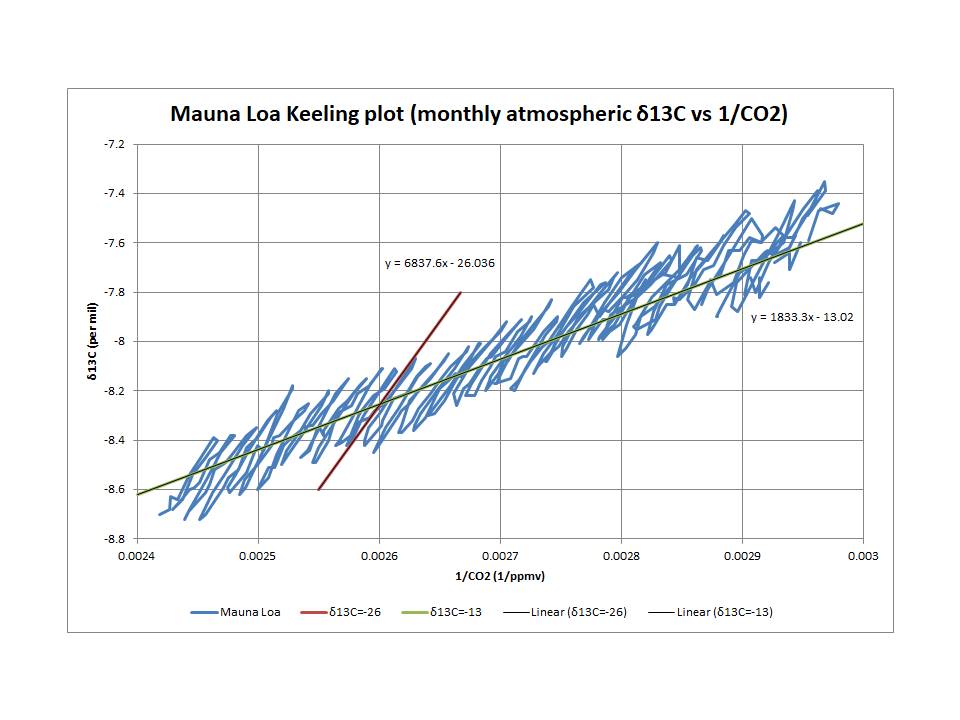
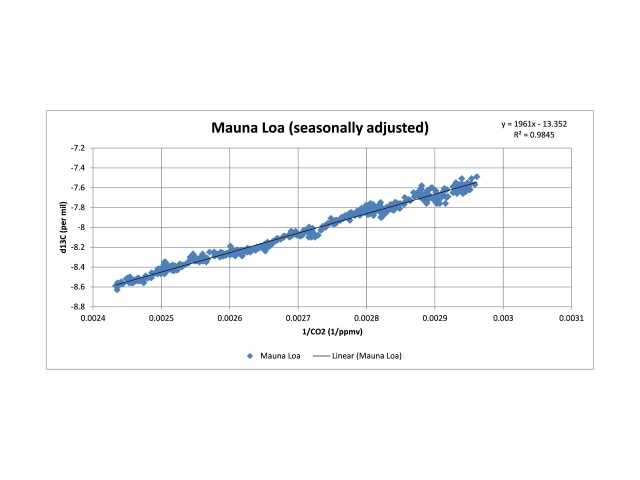
As shown, the annual cycle reflects a roughly -26‰ δ13C, which is consistent with photosynthesis/respiration, while the longer term trend reflects a significantly higher δ13C value of -13‰. In order to get a direct estimate of the ratio for the longer term trend it is essential to use the data that excludes the seasonal cycle. This latter trend dominates over the longer term (more than a few years) and incorporates δ13C variations due to ENSO and Pinatubo.
It was my observation of the very long term continuity of the average net value of -13‰ for incremental atmospheric CO2 that led to Demetris’s previous paper where he confirmed my analysis and then delved into a lot more detail.
Do those numbers take into account the isotopic fractionation of CO2 outgassing at the surface? Does it take into account that upwelling water from the depths is enriched in 12C because much of the CO2 is the result of bacterial decomposition of photosynthetic plankton?
Clyde,
Yes they do. These data reflect the net effect of all source/sink interactions on atmospheric CO2 beyond the average annual cycle.
The critical point it is that the 13C/12C ratio of the incremental atmospheric CO2, i.e. the growth in atmospheric CO2 (expressed in the standard nomenclature of δ13C), has been -13‰ ever since direct atmospheric measurements began in the late 1970s. If you accept the Law Dome data, it has been the same all the way back to 1760, or thereabouts. The values are the net effect of all the sources and sinks acting on the atmosphere and they are averaged over time periods of a few years, sufficient to compensate for fluctuations related to ENSO and Pinatubo. This consistency over time of the 13C/12C ratio would seem to preclude any hypothesis involving significant change in source/sink relationships (unless you believe in coincidences).
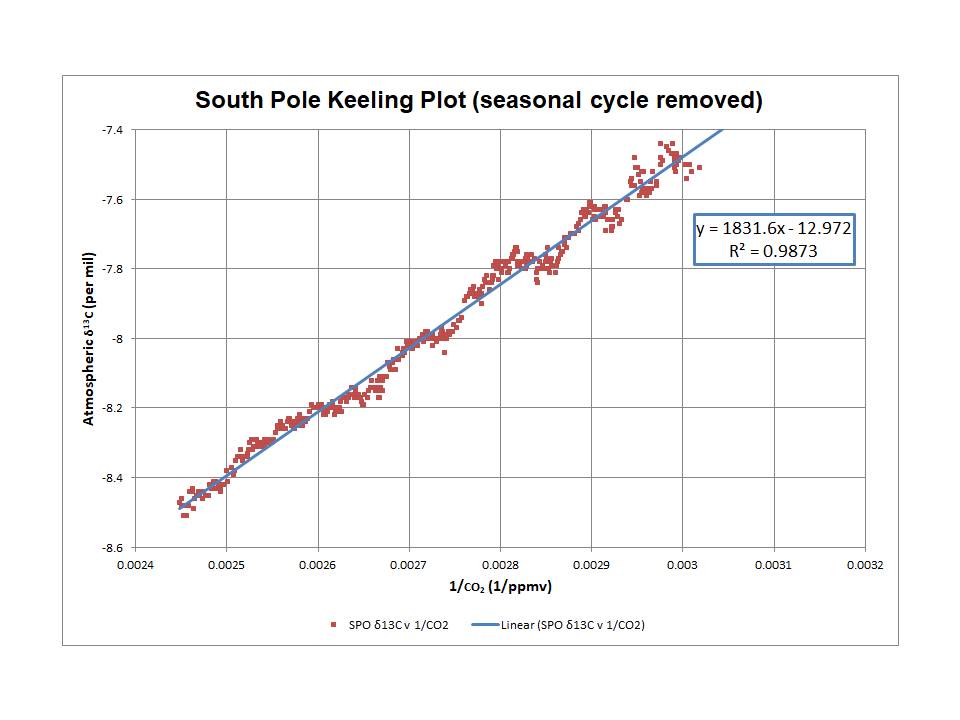
If you are concerned about the process used to remove the annual cycle, the answer is to use the South Pole data (my preference) because the annual cycle is almost non-existent and has only a minimal effect on the adjusted data.
When it comes to hypotheses to explain the δ13C value of -13‰, it is the fluctuations above and below the strong linear trend (and hence the need for averaging over periods of a few years) that become important. It is my view that since these variations can be seen at Mauna Loa and Barrow as well as at the South Pole, they are not simply noise. They indicate that strong or very strong El Niño events coincide with a significant decrease in the 13C/12C ratio along with the higher CO2 growth, whereas La Niña events (and Pinatubo) coincide with an increase in the ratio above -13‰ together with lower CO2 growth. I will leave it there for now, but there is much more that could be covered.
Can you provide me with a source for the isotopic fraction of CO2 out-gassing from upwelling bottom waters?
Are you suggesting that the El Niño events are driving increased biogenic CO2?
Sorry, no time today. Will try to respond tomorrow.
Clyde,
I’ll take the second question first and then respond separately to your first question (probably not today).
My goal has always been to focus on analysing the data (observations, physical measurements) rather than speculating about potential hypotheses; my guiding principle is “listen to the data”. The data analysis does not prove any particular hypothesis, but it does provide a constraint on any proposed hypothesis. An appropriately constrained hypothesis reflects a single non-unique model representing one possible explanation of the data.
Before getting into too much detail regarding possible hypotheses about these fluctuations in δ13C trend, it is necessary to consider the longer term average of net δ13C content of -13‰. There are multiple possible source/sink combinations that could lead to such a value, but the key constraint is the constancy of the average over time. This strongly suggests a single source or, at most, a simple (and unchanging) combination of sources and sinks. I would suggest that this should be the primary constraint that must be addressed. In addition, of course, this does need to be investigated in the context of the evidence for ENSO-driven positive and negative fluctuations around the average.
So, am I suggesting that the El Niño events are driving increased biogenic CO2? Not explicitly, no. What I am saying is that any hypothesis must be consistent with incremental atmospheric CO2 having, on average, a net δ13C of -13‰, which then decreases to lower values during strong or very strong El Niño events, but increases to higher values during strong La Niña events, all as an internally consistent physical process. Given the well-established relationship between ENSO fluctuations and inter-annual changes in CO2 growth rate, I would have expected to see greater academic focus on the inter-annual variations in the atmospheric δ13C observations in response to the following 2013 paper which concluded that:
“But the year-to-year variability in the isotopic disequilibrium flux [in our model] is much lower (1σ=±1.5 PgC ‰ yr−1) than required (±12.5 PgC ‰ yr−1) to match atmospheric observations, under the common assumption of low variability in net ocean CO2 fluxes.” and,
“Alternatively, 13C budget terms other than terrestrial disequilibrium fluxes, including possibly the atmospheric growth rate, must have significantly different [interannual variability] in order to close the atmospheric 13C budget on a year-to-year basis.”
van der Velde, I. R., J. B. Miller, K. Schaefer, K. A. Masarie, S. Denning, J. W. C. White, P. P. Tans, M. C. Krol, and W. Peters (2013), Biosphere model simulations of interannual variability in terrestrial 13C/12C exchange, Global Biogeochem. Cycles, 27, 637–649, doi:10.1002/gbc.20048.
https://agupubs.onlinelibrary.wiley.com/doi/full/10.1002/gbc.20048
Regarding your first question: no, I have not seen such a value, though there are models that should be incorporating such an estimate; this is one reason why I focus on the net values. I do not pretend to have investigated these models in detail. Given the presence of older oceanic waters at depth, and the comments in the van der Velde et al paper, it would be reasonable to postulate a value that is higher than the surface average where such upwelling occurs.
The relatively recent paper by Keeling et al in 2017 (access available via: https://www.ncbi.nlm.nih.gov/pmc/articles/PMC5625891/) was focussed on matching the general decline rate in atmospheric δ13C, having discovered that their “standard model run” failed to match actual observations following a data update. It proposed an increase in carbon isotopic discrimination of land photosynthesis in order to ‘correct’ the model decline rate. The authors highlight in the abstract that: “Using updated records, we show that no plausible combination of sources and sinks of CO2 from fossil fuel, land, and oceans can explain the observed 13C-Suess effect unless an increase has occurred in the 13C/12C isotopic discrimination of land photosynthesis.”
The irony here is that the observations did follow the consistent average for δ13C of incremental atmospheric CO2 at -13‰, both before and after the inclusion of the new observations, but their initial model did not.
To be fair, they provide detailed documentation of the model parameters (Table S1) and undertook substantial uncertainty analysis. In addition, they provide a comparison between their model output and that of van der Velde et al in Table S5. My main observation from Table S5 is that, if it is assumed that the only input to changing atmospheric δ13C was from the estimated fossil fuel emissions, this would lead to an enormous isotopic mass balance mis-match between observations and model. Adjusting for CO2 uptake by both ocean and land net sinks, leads to a reduction in the mis-match by about 20%. The remaining 80% of the required balancing correction is, according to the model, attributable to ocean and land disequilibrium terms. It is difficult for me to envisage that this is a reasonable conclusion, given the long-term consistency in the net δ13C of incremental atmospheric CO2.
Comments welcome.
Jim, Here’s an interesting article on the Keeling plots. “A distinction of specific processes acting on the global carbon cycle from the Keeling plot approach is not straightforward. In general, processes related to biogenic fixation or release of carbon have lower y-intercepts in the Keeling plot than changes in physical processes, however in many case they are indistinguishable (e.g. ocean circulation from biogenic carbon fixation).”
https://bg.copernicus.org/articles/3/539/2006/bg-3-539-2006.pdf
Renee,
Thank you for posting the comment and link to Köhler et al. I am familiar with this paper, and have linked to it myself in comments at WUWT in the past, but it is good to see it referenced here as well, not least because there appears to be limited awareness of Keeling plots at WUWT. When I first discovered the paper, the application and results of the Keeling plot to the Law Dome data blew me away. I had already been investigating the δ13C of incremental atmospheric CO2 based on direct observations published by Scripps, so I was aware of the consistency of the net δ13C value (-13‰) after removal of the average seasonal cycle, both geographically and through time, ever since such measurements began in the late 1970s. To see that the Law Dome data gave the same value for the net δ13C of incremental atmospheric CO2 going back to around 1750 was quite amazing.
To summarise the key observations: as my Keeling plot above shows by its intercept, the direct observations for the South Pole observatory give a δ13C of incremental atmospheric CO2 -13‰ with r^2 of 0.99, while Köhler et al show in their Figure 1B the Law Dome data give -13.1‰ with r^2 of 0.96. In addition, a strong linear relationship requires a consistent net value of δ13C, on average, of the incremental atmospheric CO2.
I agree with the quote you provide from the paper about distinguishing specific processes being “not straightforward”. However, my focus has been on the consistency of the net value of δ13C of the incremental atmospheric CO2, together with its short term fluctuations, which impose a major constraint on possible hypotheses. I leave it to the experts to develop hypotheses that explicitly address this constraint.
Jim, I’m still trying to understand the Keeling plots which are very intriguing. The article I posted basically states that the Keeling plots represent a two reservoir system and therefore, the
isotopic signatures of anthropogenic processes are not reflected
in the Keeling plot analysis. The authors then create a model for a three reservoir system, mainly to understand the deglaciation processes.
Renee,
OK, very good question. The basic principle is mass balance, which is widely ‘leaned on’ by the CAGW folks for total CO2, but generally ignored when it comes to stable isotopes which are actually what must adhere to mass balance principles. I will try to explain better tomorrow.
Renee,
I will respond in two parts: first regarding the basis for Keeling plots and, second, a test of my ‘hypothesis’ that over periods of a few years or more the average net value of δ13C of the incremental atmospheric CO2 has been constant at -13‰.
Part 1
Much of what follows will not be news to you, but I will include it for completeness and in case anyone else is still here (!). Keeling plots are based on mass balance principles which must apply to stable isotopes 12C and 13C, and are reflected in three equations (numbered 3, 4 and 5) in Köhler et al (2006). Equation 3 is presented as commonly used and is the mass balance of total CO2. Strictly speaking, it should reflect the mass balance of 12CO2 alone but, since 12CO2 comprises 98.9% of total CO2, this approximation is immaterial.
Equation 4 reflects the mass balance for 13CO2 and each value is based on total CO2 multiplied by the 13C/12C ratio, expressed as δ13C. In this case, the approximation is that the ratio should reflect 13C/(12C+13C), but this too does not have a material effect.
As an aside, for anyone unfamiliar with the δ13C nomenclature, put simply the δ13C of a CO2 sample is the difference between the measured 13C/12C ratio and the 13C/12C ratio of a fixed standard, expressed in per mil (‰) terms. Thus, a negative δ13C means that the sample has a lower 13C/12C ratio than the standard. The units of ‘per mil’ mean per thousand, so exactly the same as if expressed as a percentage (per hundred) but multiplied by 10. So, for example, a δ13C of -13‰ means that the sample has a 13C/12C ratio that is 1.3% lower than the 13C/12C ratio of the standard. This is very neat mathematically, because it can be treated just like the actual ratio, provided any equations are consistent in their application and it is widely used in the scientific literature in this way.
Equation 5 is a combination of equations 3 and 4. Provided that δ13C(add) is a constant, a plot of 1/CO2(new) vs δ13C(new), i.e. the Keeling plot, will provide the δ13C(add) as the intercept. Köhler et al then highlight “two basic assumptions” underlying the method. The first is that the system consists of only two reservoirs and, second, that 13C/12C ratio of the added reservoir does not change over the relevant time period. However, where we are looking at the net effect on one reservoir and we have direct measurements of CO2 and δ13C (in this case, the atmosphere) then it is the latter assumption that really matters. If there are multiple reservoirs, it is obviously very unlikely the net effect on atmospheric δ13C would be constant over time, but if it is not constant (for whatever reason) this will negate the linearity of the plot.
The key point is that the linearity of a Keeling plot is actually strong evidence for a constant net δ13C of the incremental CO2. So, in part 2, we can test my ‘hypothesis’ based on its ability to predict future δ13C values based on total atmospheric CO2 measurements alone.
Part 2
As noted earlier, the relatively recent paper by Keeling et al in 2017 (access available via: https://www.ncbi.nlm.nih.gov/pmc/articles/PMC5625891/) was focussed on matching the general decline rate in atmospheric δ13C, having discovered that their “standard model run” failed to match actual observations following a data update. It proposed an increase in carbon isotopic discrimination of land photosynthesis in order to ‘correct’ the model decline rate. The authors highlight in the abstract that: “Using updated records, we show that no plausible combination of sources and sinks of CO2 from fossil fuel, land, and oceans can explain the observed 13C-Suess effect unless an increase has occurred in the 13C/12C isotopic discrimination of land photosynthesis.”
Referring to Figure 1A in Keeling et al, there were two problems: (i) the model did not match the early regular monthly observations of atmospheric δ13C (starting around 1980) and (ii) the model trend in atmospheric δ13C from there through to 2014 was significantly greater than the observed trend. They focussed on the trend mismatch rather than the early offset and found that they had to introduce variability in a previously fixed parameter in order to offset the erroneous trend.
So, let’s test the hypothesis that the additional atmospheric CO2 since 1750 or thereabouts has had a consistent 13C/12C composition of -13‰ in δ13C terms. Their model was initiated in 1765 using CO2 of 278 ppmv and δ13C of -6.4‰. They then used an average of the observations from Mauna Loa (MLO) and South Pole (SPO), with the seasonal cycle removed, so we need to do the same for selecting the appropriate CO2 values (though averaging two sets of observations is not something I would normally choose to do). All data below are from the Scripps CO2 program and the analysis is based on equation 4 from Köhler et al.
February 1980 was the first month for which both sites had CO2 and δ13C observations:
MLO CO2 was 338.6 ppmv and δ13C was -7.56‰
SPO CO2 was 336.1 ppmv and δ13C was -7.48‰
Averages: 337 ppmv and -7.52‰
Keeling et al standard model run predicted a δ13C of about -7.75‰ (based on Figure 1A).
Constant δ13C model of -13‰ since 1765 predicts a δ13C value in February 1980 of:
(278*-6.4 + (337-278)*-13)/337 = -7.56‰ compared to the model at -7.75‰ and actual measurement of -7.52‰.
December 2013 was the last month used in the Keeling et al model:
MLO CO2 was 398.0 ppmv and δ13C was -8.42‰
SPO CO2 was 394.1 ppmv and δ13C was -8.30‰
Averages: 396 ppmv and -8.36‰
Keeling et al standard model run predicted a δ13C of about -8.78‰ (based on Figure 1A).
Constant δ13C model of -13‰ since 1765 predicts a δ13C value in December 2013 of:
(278*-6.4 + (396-278)*-13)/396 = -8.37‰ compared to the model at -8.78‰ and actual measurement of -8.36‰.
Plenty more examples can be provided.
Bla bla bla bla bla bla bla bla bla bla, bla bla bla bla bla,
Still no counterpoints come from you thus you continue to babble with a drooling mouth.
You haven’t improved at all.
“There is too much wrong with the paper to address succinctly.”
Then address SOME of it succinctly! You didn’t address ANYTHING!
Have you considered the logic of your argument with respect to feedback?
Let us assume that historically temperature drove CO2 as observed by correlation.
And let us assume that the current rise in CO2 levels is unprecedented in fact, not just when compared to the smoothed scales of historical proxies.
Then we have the following options:
A) Historically, temperature drove CO2 upwards, then CO2 drove temperature upwards and the planet ran away to be a twin of Venus. This is not supported by evidence.
B) Historically, temperature drove CO2 upwards, then CO2 had no significant impact on temperature and nothing important happened. This is plausible but spectroscopy makes it improbable.
C) Historically, temperature drove CO2 upwards, then CO2 drove temperature upwards, then something else constrained the effect of CO2. This is very likely. But alas, we do not know what the ‘something else’ is. So the paper as it stands is a devastating critique of current climate sconce. And it is the peer reviewers who engaged in great pride, even hubris.
D) The historical world is an illusion and we were all created 5 minutes ago. This is only slightly more likely than option A.
E) Anything you can come up with(?).
Ocean temperature is what drives the current rate of CO2 increase.
Oh dear.. The anti-CO2 monkeys really don’t like the evidence that CO2 rate of increase is closely tied to ocean atmospheric temperature.. with a slight lag.
Diddums !!
This is the correct answer, and there is abundant literature on this topic (some of it even cited in the manuscript we are discussing, albeit without the author apparently understanding the implications). Most climate change events on geologic timescales occur slowly enough for other processes (silicate weathering, ocean uptake) to modulate positive CO2 feedback. And because these past events were driven by external forcing (e.g. changes in insolation driven by orbital variation), once this external forcing stabilizes or reverses, the CO2 feedback diminishes.
But of course this kind of treatment requires nuance, and a deep knowledge of contemporary and historic research in climate science, which the author completely fails to demonstrate (hence the reviewer comments).
Nuance.. roflmao… Not blind tugging at the AGW mantra non-science.
You comment, yet again, says absolutely NOTHING but blether.
If the hypothesis doesn’t explain all events, then there is a problem with the hypothesis that needs to be explained. It isn’t acceptable to wave off an exception as being inconsequential.
“It doesn’t matter how beautiful your theory is, it doesn’t matter how smart you are. If it doesn’t agree with experiment, it’s wrong.” – Richard P. Feynman
That is why I keep asking questions. The hard ones are usually ignored by the acolytes of the religion of Gaia.
AlanJ wrote–“Historically, temperature drove CO2 upwards, then CO2 drove temperature upwards, then something else constrained the effect of CO2.”
It is simpler to claim that temperature drove CO2 up, then down.
No need to introduce an unknown “something.” (Occam and all that.)
It is simpler and more correct, to say that AJ hasn’t got a clue what he is talking about.
The problem is, he (and others like him) are of the opinion that they alone understand the system and it is CO2 ‘all the way down.’
McCourtney wrote, “options… A)… temperature drove CO2 upwards, then CO2 drove temperature upwards and the planet ran away to be a twin of Venus.”
Positive feedback does not imply that temperatures will “run away.” A positive feedback is simply one which causes a same-direction response, so it tends to increase (amplify) the effect of an input change (a/k/a “forcing”).
Radiative emissions (which cool the Earth) are proportional to the 4th power of temperature, per the Stefan-Boltzman relation: E = ε⋅σ⋅T⁴ That’s one of the main reasons that as the Earth’s climate warms it becomes more stable, rather than less (which is incompatible with hypothetical “tipping points” and “runaway” warming).
A common misconception is that positive feedbacks necessarily “run away,” and make a system unstable. That is incorrect. Positive feedbacks of less than 100% do not make a system unstable.
For example, consider a linear system with a gain G=1 and positive 10% (i.e. +1/10) feedback from the output to the input. An input change of 1.0 will “feed back” +10% to become, effectively, 1.1. The “.1” (additional part) is also then amplified by 10%, becoming .11, etc.
https://sealevel.info/linear_feedback_system_diagram2.html
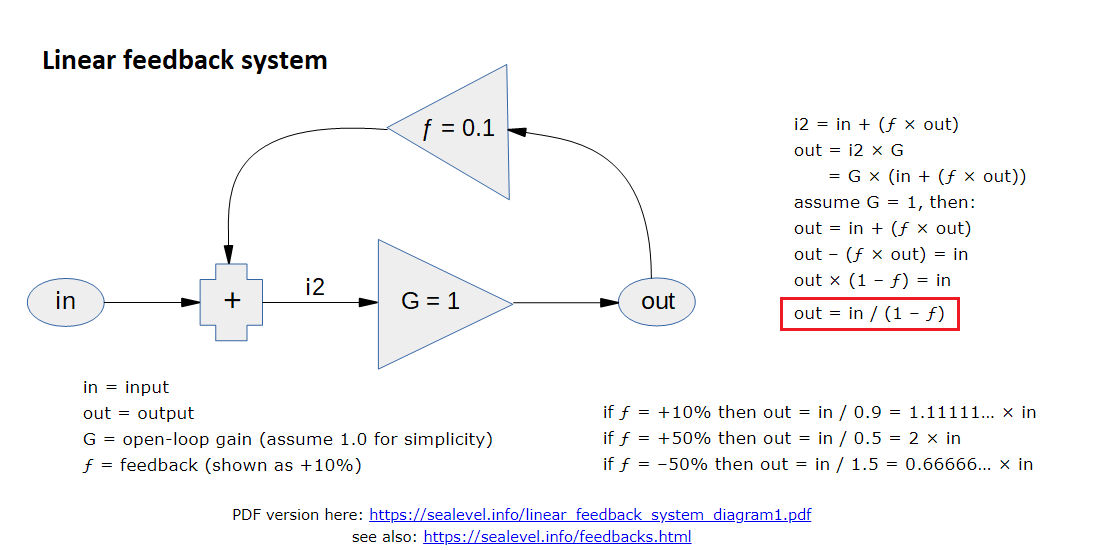
The +10% feedback ends up, in the long term, asymptotically approaching 11.11111…% (i.e., +1/9 = ×10/9) amplification.
Similarly, a +20% (i.e. 1/5) linear feedback causes a +25% (i.e., +1/4 = ×1.25) amplification, a +33⅓% (i.e. 1/3) feedback causes a +50% (i.e. +1/2 = ×1.5) amplification, and a +50% (i.e. 1/2) feedback causes a +100% (i.e. +1 = ×2) amplification.
In general, in a linear system, a feedback ƒ causes a “compounded” net amplification (or attenuation, if ƒ is negative) which multiplies the original effect by 1/(1-ƒ).
For example, if ƒ =+20% then net amplification =
1/(1-ƒ) = 1/(1-0.2) = 1.25×.
(Caveats: In practice, delays in the feedback path may mean that the full amplification effect of a positive feedback isn’t immediately seen. Also, these calculations assume linearity, but most systems are not perfectly linear, though many are approximately linear over ranges of interest.)
Dave Burton, I quite agree. But, in bracketing the reviews into responses, that was in my option B.
It is not an acceptable result if you have committed your career to saving the world from climate change.
Obviously, I suspect that my option C is true, cannot argue with option D and am willing to listen to an option E.
Options A and B are agreement that newsworthy global warming is not happening. Option C is acknowledging that we do not know if newsworthy global warming is happening.
All the COPs have concluded to watch the issue, research the issue and do nothing about the issue yet… as they agree with Option C too.
It is important to note that, as Christopher Monckton has aptly demonstrated, although climate science has adopted the terminology of Bode and has tried to draw feedback block diagrams that represent the atmosphere, this is where their analogies end. They are in general completely ignorant of the implications of the Bode feedback amplifier, and do not use the Bode equation (much less derive it from a block diagram).
In essence, like much of climate science, it is nothing but hand waving.
Karl, Bode analysis is used for AC circuits, i.e., when inputs are periodic and delays in a system are comparable to those periods. It gives insight to the frequency response of a system.
It is not relevant to the Earth’s climate and its response to CO2 forcings, because the input is not periodic, and delays in the system (feedback loop “round trips”) are mostly relatively short.
“C) Historically, temperature drove CO2 upwards, then CO2 drove temperature upwards, then something else constrained the effect of CO2. This is very likely. But alas, we do not know what the ‘something else’ is.”
That is somewhat right, but only somewhat. In the past few hundreds of millennia, temperature has been driven by orbital effects. CO2 responds by outgassing, but to a fairly small effect. It amplified the temperature cgange, but only by about 20%. Nothing really constrained the effect of CO2. It just wasn’t vary big to begin with. This is a function of the solubility relation.
Presently we are putting CO2 directly into the air. The solubility relation is not part of that source.
“the effect of CO2.”
Yep, Plant will keep growing. The planet will keep greening.
No evidence of any CO2 warming in the UAH data.
No empirical evidence of warming by atmospheric CO2.
Putting extra CO2 into the carbon cycles is absolutely beneficial to the planet.
Hi Nick.
How did the planet manage to function and lifeforms evolve in past eras?
Was it a different version of CO2 to what we have now?
Some lifeforms evolved. But not ours. Try marking our time on your graph.
And then the period where we have been feeding 7 billion of us.
“Some lifeforms evolved.”
You are devolving into a mindless AGW parrot !.. Oh wait.. you always have been.
We are feeding 7 billion + of us BECAUSE OF CO2.
Nick,
“Presently we are putting CO2 directly into the air.”
Question: But are we measuring all of that CO2 with station locations and procedures like at Cape Grim and Mauna Loa?
It is easy to envisage short-distance, fast capture processes that involve CO2 going straight to the air, then being captured before the CO2 gets anywhere close to a weather station.
This makes it hard to model sinks and sources accurately.
Geoff S
Geoff,
C is conserved. If that is happening, the C has to turn up somewhere. It is quite noticeable.
“C is conserved ……the C” ???
WTH are you gibbering about !!
As shown recently, Mauna Loa CO2 rate of growth is closely linked to ocean atmospheric temperatures, with a slight lag.
If atmospheric CO2 was a response to human CO2 emissions, it would be a gradual steady rise… BUT IT ISN’T.
It only appears that way when all averaged out.
When you look closely at the data, there is not much sign of any human caused CO2 rise in the Mauna Loa data…
… just as there is no sign of any human causation in UAH atmospheric temperature data.
Not surprising really, since human emissions are only 4% or so of an ever-increasing CO2 flux.
It’s all over for you Alarmists. Man up, face facts, abandon your obsession with the discredited CO2 Hypothesis, and move on. It will hurt initially but in the long run you will feel so much better.
What would you know about the “laws of physics”. You have shown yourself to be a scientific illiterate.
CO2 is a “radiatively active gas”, that is used in greenhouses to promote plant growth.
It’s action in the atmosphere is nothing remotely like the action of a greenhouse.
The term “greenhouse gas”, is what is against the “laws of physics” wrt CO2.
There is no empirical evidence that CO2 has any effect on warming the atmosphere.
Your idiotic comment is based on AGW-mantra, not science or physics.
You should read the noise about “physics” still being generated by the trendology idiots in the hottest June thread.
To wit: they deny that if you add a source of irradiance (i.e. the sun), the irradiance doubles.
They are quite insane.
The term “greenhouse effect” is a misnomer – the process has little to do with the mechanics of an actual greenhouse. But the greenhouse effect does very much exist, and it exists because of the presence of these radiatively active gases, like water vapor and CO2. The earth would be below freezing near the surface without it.
Thanks for understanding that whoever came up with the GHE mantra was a scientific moron.
You are dealing with hypothetical models again…
No evidence of warming by atmospheric CO2.
The greenhouse effect, due to radiative gases and all other activities in the atmosphere, is retained energy of the system, is enthalpy
Using specific heats of dry air, WV and CO2, on can easily calculate RE for an atmospheric temperature, in 1900 at 14.8 C and in 2023 at 16 C
You will find CO2 was 0.30% of RE in 1900, and 0.39% of RE in 2023
Regarding Retained Energy in the atmosphere, aka Enthalpy,, CO2 plays a less than 1% role.
https://www.windtaskforce.org/profiles/blogs/hunga-tonga-volcanic-eruption
https://www.windtaskforce.org/profiles/blogs/natural-forces-cause-periodic-global-warming
.
Retained Energy (Enthalpy) in Atmosphere Equals Global Warming
About 5.5 million EJ/y from the sun enters the top of atmosphere, and almost as much leaves,
Some energy is retained in the atmosphere on a continuing basis
Retained energy, RE, is a net effect of the interplay of the sun, atmosphere, earth surface (land and water), and flora and fauna, i.e., all effects are accounted for, including radiation, evaporation, condensation, precipitation
WV in the TS, up to about 1.5 km, is nearly constant at 9 g/kg of dry air
WV decreases from about 2.5 g to less than 0.3 g, from 2 km to 6 km, per balloon measurements
WV percent above 2 km is small compared to total WV
Assume:
For 2023, WV near the surface is 9 g/kg dry air (14,500 ppm) at TS = 16 C
For 1900, WV is 8.305 g/kg dry air (13,380 ppm) at TS = 14.8 C
This method is suitable to objectively approximate the RE role of CO2
As temperatures, pressures and WV vary with elevation, specific heat contents vary, and RE calculations are needed at each elevation, for more accurate RE values. That complex method was avoided for simplicity.
.
NOTE: This short video shows, CO2 plays no detectable RE role in the world’s driest places, with 421 ppm CO2 and minimal WV ppm
https://youtu.be/QCO7x6W61wc
.
Specific enthalpy of Dry Air and Water Vapor
ha = Cpa x T = 1006 kJ/kg.C x T, where Cpa is specific heat dry air
hg = (2501 kJ/kg, specific enthalpy WV at 0 C) + (Cpwv x T = 1.84 kJ/kg x T), where Cpwv is specific heat WV at constant pressure
.
1a) In 1900, world enthalpy moist air, at T = 14.8 C and H = 0.008244 kg WV/kg dry air (13,282 ppm)
h = ha + H.hg = 1.006T + H(2501 + 1.84T) = 1.006 (14.8) + 0.008306 {2501 + 1.84 (14.8)} = 35.886 kJ/kg dry air
RE dry air is 14.889 kJ/kg; RE WV is 20.997 kJ/kg
1b) In 2023, world enthalpy moist air, at T = 16 C and H = 0.009 kg WV/kg dry air (14,500 ppm)
1.006 (16) + 0.009 {2501 + 1.84 (16)} = 38.870 kJ/kg dry air
RE dry air is 16.096 kJ/kg; RE WV is 22.774 kJ/kg
https://www.wikihow.com/Calculate-the-Enthalpy-of-Moist-Air#:~:text=The%20equation%20for%20enthalpy%20is,specific%20enthalpy%20of%20water%20vapor.
.
Specific enthalpy CO2, in 1900
h = Cp CO2 x K = 0.833 x (14.8 + 273) = 239.8 kJ/kg CO2, where Cp CO2 is specific heat
World enthalpy CO2 = {(296 x 44)/(1000000 x 29) = 0.000449 kg CO2/kg dry air} x 239.8 kJ/kg CO2 at 287.8 K = 0.108 kJ/kg dry air
Specific enthalpy CO2, in 2023
h = Cp CO2 x K = 0.834 x (16 + 273) = 241.2 kJ/kg CO2, where Cp CO2 is specific heat
World enthalpy CO2 = {(421 x 44)/(1000000 x 29) = 0.000639 kg CO2/kg dry air} x 241.2 kJ/kg CO2 at 289 K = 0.154 kJ/kg dry air
.
World RE in 1900: (14.889 + 20.991 + 0.108) kJ/kg dry air x 1000 J/kJ x 5.148 x 10^18 kg x 10^-18 = 185,268 EJ
In 1900, WV/CO2 RE % role ratio 58.33/0.30 was 194.9; WV/CO2 ppm ratio 13376/296 was 45.2, i.e., a WV molecule is 4.31 more RE effective than a CO2 molecule.
World RE in 2023: (16.096 + 22.774 + 0.154) kJ/kg dry air x 1000 J/kJ x 5.148 x 10^18 kg x 10^-18 = 200,896 EJ
In 2023, WV/CO2 RE % role ratio 58.36/0.39 was 147.8; WV/CO2 ppm ratio 14500/421 was 34.4. i.e., a WV molecule is 4.29 more RE effective than a CO2 molecule.
.
In 1900, CO2 RE was (0.108/35,993) x 185,294 EJ = 554 EJ
In 2023, CO2 RE was (0.154/39.024) x 200,896 EJ = 793 EJ
CO2 RE increase 239 EJ
.
I deleted the table, because it was garbled.
You can see it by opening the URLs at the top
bnice2000,
I hope that you are not concluding that the success of CO2 gas added to glasshouse interiors to promote growth is due in any way to CO2 being a “radiatively active gas.” To avoid any confusion, that radiative property has nothing to do with promotion of plant growth in the real glasshouses of the globe.
Geoff S
“To avoid any confusion, that radiative property has nothing to do with promotion of plant growth in the real glasshouses of the globe.”
Radiative properties have absolutely ZERO to do with greenhouses. !
CO2 is not a “source” of temperature, try again.
You’re exactly right, AlanJ. I do not understand how so many people can think that adding CO2 to the atmosphere does not affect the amount of CO2 in the atmosphere.
Dave Burton,
Sorry for some semantics.
Sometimes I think of analogies like a pressure vessel in an industrial process where the contents are held at a desired steady state in a dynamic environment. Example, you can add a gas from a side pipe, but it will meet a constant pressure outlet control valve that will release some of the contents as the gas goes in. Then, the composition can be brought back to target by another port inletting the adjustment to composition.
The analogy to CO2 in the air is that yes, man is putting CO2 straight into the air, but that sets in motion another mechanism that takes CO2 out of the air, to a sink. Current thought is that the sink is thirsty and takes in about half of the addition out of the air. Why half? Is this an indication that in loose terms means that the atmosphere is programmed with a type of concentration control device?
Geoff S
sherro01, the major processes (“sinks”) which remove CO2 from the air all run at rates which are roughly linear functions of the atmospheric CO2 concentration (level).
Note that it’s the current concentration (about 423 ppmv) which determines the removal rate, not the current emission rate (about 5 ppmv/year). So the fact that the current removal rate is about half of our current emission rate is purely coincidental.
(Aside: the GCB estimate for 2022 emissions is about 37 Gt of fossil CO2 plus (very roughly!) 4 Gt of CO2 from “land use changes” (clearing forests, draining swamps, etc.). 1 ppmv of CO2 = 7.8024 Gt CO2 = 2.1294 PgC. 37 Gt CO2 = 4.74 ppmv. 41 Gt CO2 = 5.25 ppmv.)
Those natural removal processes (mostly dissolution into the oceans and terrestrial “greening”) accelerate by 1 ppmv/year for every 40 to 50 ppmv rise in atmospheric CO2 concentration.
Since the current removal rate is about half of our current emission rate, if our emissions were suddenly halved, the removal rate would equal the emission rate, so the CO2 level would plateau.
If we assume that nobody will invent a Mr. Fusion, then a sudden halving of CO2 emissions is not realistic (though not less unrealistic than RCP8.5).
But it is also instructive to consider what will happen if CO2 emission remain constant at about the current rate, which is not so unrealistic.
The atmospheric CO2 concentration is currently rising by an average of about +2.45 ppmv per year. So even if we maintained the current rate of CO2 emissions, and never reduced them at all (until all the coal was gone), the atmospheric concentration could only rise by 2.45 × (40 to 50) = 100 to 120 ppmv.
A 110 ppmv rise would be only log2((423+110)/423) = only 33% of a “doubling.” For comparison, since 1958 (when precise CO2 measurements began) we’ve had log2(423/315) = 43% of a doubling, and the effects have been highly beneficial.
https://sealevel.info/learnmore.html?0=benefits

https://ourworldindata.org/crop-yields
What that means is that Net Zero is a fools’ errand. There’s no good reason to expect harmful consequences even if CO2 emissions are never reduced at all, but remain at the current rate indefinitely (until the coal runs out).
Returning to Koutsoyiannis, here’s more proof that he’s wrong (along with the source of that “+2.45 ppmv per year” figure):
The chart is not proof he is wrong. The label is incorrect because ocean surface temperature have been steadily increasing since 1900. There was an upward blip around 1940 that your CO2 trace even captures.
If anything, that chart of CO2 supports Koutsoyiannis.
RickWill wrote, “The label is incorrect because ocean surface temperature have been steadily increasing since 1900”
That is incorrect. Here’s HadSST3, courtesy of the indispensable WoodForTrees site:
https://www.woodfortrees.org/plot/hadsst3gl/offset/plot/hadsst3gl/mean:24/offset:0.5/plot/hadsst3gl/from:1939/to:1978/mean:24/offset:0.5/plot/hadsst3gl/from:1939/to:1978/offset:0.5/trend
The red bottom trace is the monthly data. The green and blue upper trace is the same data smoothed with a 24-month running average, and the blue part is the four decades during which sea-surface temperatures were cooling.
The downward-sloping purple line is the linear trend for the 40 year period from 1939 to 1978.
During the last 30 of those 40 years, CO2 levels were rising at an accelerating rate, because of accelerating anthropogenic CO2 emissions during the economic boom after WWII, even though sea-surface temperatures were falling.
That’s more proof that Koutsoyiannis is wrong.
The attached is the NOAA ERSST from in-situ measurement using ICOADS data. I would consider it more reliable than anything from HadCRUT.
It shows a blip in trend rather than a change in trend. The blip corresponds with a bump in the CO2 chart. This is further evidence that supports the theory in the paper.
Even NOAA ERSST shows a slight decrease in sea-surface temperatures over that four decades.
Yet look what happened to CO2:
The amount of CO2 in the atmosphere rose at an accelerating rate because we added CO2 to the atmosphere at an accelerating rate. It was not caused by sea-surface temperatures. Koutsoyiannis is wrong.
(As for the “blip,” it corresponds to WWII. My guess is that it’s due to measurement issues. Sea-surface temperature measurements, in those days, were based on convenience sampling, typically measured in buckets from passing ships. WWII changed ship traffic patterns, so a few tenths of a degree variation in the water temperatures measured is unsurprising.)
You need to understand integration and where the baseline is.. It took the steep fall during the 40s to arrest the rising trend in CO2 as your curve shows.
The baseline goes back to 1800. ANY temperature increase over the level in 1800 will increase the CO2.
Your CO2 curve confirms the steep fall in temperature. The CO2 level off for a few years while the temperature fell dramatically.
You are using that blip to create your downward trend. If there is no blip, as you argue, then there would be no downward trend after it.
Any temperature above the baseline level of 1800 is going to cause outgassing until the temperature falls dramatically as it did in the 1940s.
For your reasoning to be a valid contradiction of the paper, you need to determine the equilibrium CO2 level for each temperature. There will be no equilibrium while the temperature continues to rise. It required a fall of 0.4C in the 1940s just to arrest the rise; not reverse it.
Your chart does not contradict the outgassing theory. If anything it supports it due to the response when there was a fall in temperature.
Rick,
A small suggestion, if I may. Instead of determining “the equilibrium CO2 level for each temperature”, I would suggest looking for the equilibrium CO2 growth rate for different temperatures. As shown in my comments elsewhere on this thread, the strong relationship seems to be between ENSO (sea surface temperatures) and CO2 growth rate. Higher temperatures (El Niño events) lead to a higher CO2 growth rate than neutral conditions and lower temperatures (La Niña events) lead to a reduced CO2 growth rate. Hence, for a constant temperature, one might expect a constant growth rate where atmospheric CO2 continues to increase. A good example of this can seen during the temperature pause of 2001-2014.
According to NOAA (hover to see link url), the cooler period was from 1946 to 1976. Also from NOAA (different link, select “Past Events” tab), during that same period there were 3 El Niño years and 8 La Niña years (the remainder being “neutral”). Hmm, could be a clue to the lack of temperature increases during that period.
ENSO affects the rate at which Nature removes CO2 from the atmosphere via dissolution into the oceans. But because atmospheric CO2 levels are currently so high, Nature is a net remover of CO2 from the air every year, even during strong El Niños.
One way to quantify the effect of temperature on CO2 level is to look at how each varied over glaciation cycles. We know from ice core data how CO2 level varied: at interglacial optimums it was about 90 ppmv higher than at glacial maximums (≈280 vs. ≈190 ppmv). Global average temperature estimates are rougher, but a conventional estimate is that at interglacial optimums global average temperatures were about 6°C higher than at glacial maximums (certainly between 5° and 10°C). So 1°C of warming yielded, very roughly, an eventual 15 ppmv rise in CO2 level (though it took many centuries for CO2 level to change that much).
Since 1958 (when very precise CO2 measurements began) we’ve had about a 108 ppmv rise in CO2. To get that much CO2 level change from a global temperature increase would thus require about (108/6) = 18°C of warming.
Koutsoyiannis (if you’re reading this), or RickWill, or bnice2000, do any of you think that global temperatures have risen by 18°C since 1958?
The amount of CO2 in the atmosphere has increased every year since WWII, regardless of whether whether temperatures rose or fell, simply because each year we added CO2 to the atmosphere faster than nature removed it.
Adding CO2 to the air increases the amount of CO2 in the air. I don’t understand why that confuses some people. Temperature has a miniscule effect by comparison.
The rise in CO2 level was not caused by temperature change. Koutsoyiannis is wrong.
Dear Dr. Burton,
No, I do not think that “global temperatures have risen by 18°C since 1958”.
Actually, I do not understand why you address this question to me. Do I look that disconnected to reality?
What I think is that such questions are not answered by “thinking” but by using and processing observed data. Please see Figure A2 in Appendix A.1 in the paper “On hens, eggs, temperatures and CO₂: Causal links in Earth’s atmosphere” (doi: 10.3390/sci5030035) to see our processing of temperature data–separately for land and oceans. This should reply your question quantitatively.
Please also see the calculations that accompany this figure to see how we explain the increase of CO₂ as a result of the temperature increase.
Dear colleagues,
I am grateful to the WUWT for posting about my paper, and I thank all of you for your discussions.
I am not panicked to see expressions such as “Koutsoyiannis is wrong” or even “Dr. Koutsoyiannis is a science fraud”, which appears in another comment here.
Please access my rebuttal of the review comments of this paper, which is linked in the main post, to see that I am very familiar to attacks of this or another type.
Actually, in almost all of my climate papers, if I devote a time period A to produce a paper, I have to devote an additional time 2A to publish it. My rebuttals are often equivalent to additional papers.
But I do not give up. And, after intensive struggle, I managed to publish most of my climate papers.
That said, I apologize that I do not contribute more to this discussion. I have to rebut other review comments for other papers…
Demetris wrote, “Please see Figure A2 in Appendix A.1 in the paper “On hens, eggs, temperatures and CO₂: Causal links in Earth’s atmosphere” (doi: 10.3390/sci5030035) to see our processing of temperature data–separately for land and oceans. This should reply your question quantitatively.”
I’m disappointed that you did not reply substantively to my points, Demetris.
Here is your Fig. A2, but it does not address my point. (I added the green annotation.):
It shows marine and terrestrial temperature trends over the CO2 measurement (since 1958). It indicates that neither marine temperatures nor terrestrial temperatures rose at all from 1958 to 1975 (in fact, they actually decreased) — a period of time during which the amount of CO2 in the atmosphere increased at an accelerating rate.
That obviously proves that the reason for rising atmospheric CO2 levels could not have been rising temperatures.
The reason that the amount of CO2 in the atmosphere was rising at an accelerating rate from 1958 to 1975 (even though temperatures were decreasing) was simply that the rate at which mankind added CO2 to the atmosphere accelerated from 1958 to 1975.
The bottom line is:
Adding a gas to the atmosphere increases the amount of that gas in the atmosphere.
That is true whether the gas in question is CO2, or Freon, or anything else. The claim that the temperature dependence of Henry’s Law controls atmospheric gas concentration is clearly wrong, unless enough time is allowed to pass for atmosphere and ocean to reach approximate equilibrium (millennia).
Remember, the temperature dependence of Henry’s Law is qualitatively true for all soluble gases, not just CO2: they become less soluble as water temperatures rise. For instance, consider Freon (R11, R12, etc.):
Does that look familiar? Here’s a reminder:
Does anyone here suppose that the rise in the amount of Freon in the atmosphere prior to the Montreal Protocol was natural, and caused by rising water temperature?
Reference:
Fine, Rana A. (2011). Observations of CFCs and SF6 as Ocean Tracers. Annual Review of Marine Science, 3(1), 173–195. doi:10.1146/annurev.marine.010908.163933
Excerpt:
Rises in temperature appear to have come before rises in CO2, so the CO2 rises cannot have caused them.
Or is that not true? Do the rises in temperature in fact come after the rises in CO2?
Or are you arguing that rises in temperatures do cause and have caused previous rises in CO2, but rises in CO2 also cause rises in temperature, and that is what is happening now.
Is this what you are arguing?
That simply means that CO2 wasn’t the catalyst for the event, it does not mean that CO2 did not contribute to the event. Claiming that it does is a basic logical fallacy. Historically there has been no mechanism by which large quantities of CO2 can be emitted to the atmosphere that weren’t driven by temperature (e.g. ocean outgassing), but this does not preclude CO2 from acting as a strong positive feedback mechanism once some other process gets the ball rolling.
This is what I believe, but you don’t have to accept this as fact to see that the author’s argument does not eliminate it as a possibility.
Again the little AGW fantasies…. Hilarious.
NOT SCIENCE. !!
It’s ‘affirming a disjunct’.
CO2 follows temperature or temperature follows CO2.
Proxy data show CO2 follows temperature therefore temperature cannot follow CO2.
That is a deductive fallacy (affirming a disjunct) because both can be true, the fact that one proposition is true of itself does not disprove the other.
It’s difficult to reconcile the number of upvotes on your comment with the downvotes on mine except to suppose that folks are not reading carefully.
Except that you constantly write gibberish.
The temperature historically goes down before CO2 and starts the decrease when the CO2 is at its maximum. Ole Humlum’s work and this paper show that Temp leads CO2 on sub annual timescales. These facts lead me to think CO2 is a very weak driver if it is a factor at all. Have you considered the implications of the Connolly’s work showing the atmosphere is is thermodynamic equilibrium? That has dire consequences for the greenhouse hypothesis.
“That has dire consequences for the greenhouse hypothesis.”
It sure does !!
Destroys the CO2 part of the GH hypothesis completely using actual analysis of some 2 million sets of balloon data. ! 🙂
H2O is the only molecule that disturbs the gas laws, because it isn’t always a gas.
The graph I have shown elsewhere also shows that ocean atmospheric temperatures and CO2 rate of increase are very closely linked, but that CO2 rate of increase lags by a month or so.
That is categorically wrong. The End Permian — The Great Dying — is associated with a Large Igneous Province (LIP) known as the Siberian Traps. However, the LIP not only released excess CO2 for approximately 2 million years from mantle-derived basalt, it apparently intruded coal beds that released additional CO2, CO (which oxidized to CO2), as well as coal tars that would subsequently either oxidize or be respired by bacteria.
You can ‘prove’ anything if you change the facts to agree with your hypothesis.
AlanJ wrote
Clyde replied:
A pedantic rebuttal might be that 250 million years ago was not history, it was prehistory.
If we constrain our discussion to the period recorded history, or even if we merely constrain it to the period for which we have good CO2 data from ice cores (400K or 800K years, depending on what you mean by “good”), then Alan’s statement is correct.
One niggle: where Alan wrote “driven by temperature” I would write “driven by temperature and/or glaciation,” because receding ice sheets uncover a lot of organic material, which releases CO2 when it decays.
The only time during the last 800K years that CO2 levels were mainly driven by something other than temperature and glaciation is the last few hundred years (since the start of the industrial revolution), when mankind began adding large amounts of CO2 to the air.
P.S. — also, a question: how can basalt release CO2?
The logical problem your argument has is that the climate should be reacting in the same way to all increases in CO2, no matter their cause.
So, there was an increase in CO2 caused by temperature rises in the past. That should have led to increased emissions and therefore increased heating. Maybe you will argue that it did.
In that case you have to account for why the warming reversed when the CO2 which was causing it had not fallen. And indeed, why the warming stopped, and did not carry on. The argument is for positive feedback to any increase in CO2. I can’t see this is observable in the historical record.
Then, the argument says that the current rises in CO2 lead to increased temps which in turn leads to increased temps. So warming should be accelerating. There does not seem to be any sign of it. And you also have to ask why the current warming should not reverse in the same way that historical warmings, caused by the same mechanism (rising CO2), have done.
The skeptical among us will look at all this and conclude a more likely explanation for the phenomena is something in the system of feedbacks which the simple CO2 accelerating feedback is not accounting for.
Its always seemed to me that the big problem for the alarmists about the MWP and RWP is not that they happened. Its that they reversed and were followed by cooling. If the CO2 feedback theory AlanJ has advocated is correct, this should not have happened. Any temp increase, no matter the cause, should lead to more CO2, which should lead to more warming.
But we have two historical cases where the warming happened, but the feedback progression didn’t.
The logical problem with your rejoinder is that CO2 is not the only thing affecting the climate. During past large climate change events, some other process, like orbital forcing, was driving the change, with CO2 acting as a feedback. When the forcing driving the change reversed, CO2 drawdown occurred. The current rise is not likely to reverse because the process that is adding CO2 to the atmosphere is not tied to anything but the rate that humans are digging up carbon and burning it.
Another bunch of words that say absolutely nothing of any scientific meaning or merit.
Just baseless conjecture.
An AJ specialty !
Again.. No evidence that atmospheric CO2 does anything but enhance plant growth…
The MWP and RWP were events during the current interglacial and were too short to have been the result of Milankovitch Cycles. It is clear from seasonal CO2 data that the most influential force affecting atmospheric CO2 concentration is biological. Why should CO2 experience a decline when the growing season is shortened instead of acting as a buffer to retard cooling if CO2 causes warming? The growing season is when the seasonal draw-down occurs and crop-failures and native annual vegetation early-termination from early frosts should result in less draw-down.
So if that’s what you’re claiming to be doing, you’ll have null hypothesis to offer regarding the claimed effects of the GHE.
Years ago there was a study based on atomic bomb tests, their production of the C14 isotope, and the persistence of that isotope in the atmosphere, that led to the assumption that the same argument applied to the production of carbon isotopes from burning of fossil fuels. A seemingly exhaustive investigation of C12 and C13 isotopes by the same author as this current paper seems to have demolished that argument and led to the conclusion that
“From modern instrumental carbon isotopic data of the last 40 years, no signs of human (fossil fuel) CO2 emissions can be discerned;”
and
“Proxy data since the Little Ice Age suggest that the modern period of instrumental data does not differ, in terms of the net isotopic signature of atmospheric CO2 sources and sinks, from earlier centuries.”
as well as
“The greenhouse effect on the Earth remained stable in the last century, as it is dominated by the water vapour in the atmosphere:”
and
“Human CO2 emissions have played a minor role in the recent climatic evolution, which is hardly discernible in observational data and unnecessary to invoke in modelling the observed behaviours, including the change in the isotopic signature δ13C in the atmosphere.”
as well as
“Overall, the findings in this paper confirm the major role of the biosphere in the carbon cycle (and through this in climate) and a non-discernible signature of humans.”
In other words, of the ~3% to 4% of total yearly CO2 emissions that are supposedly produced by FF burning, there is not enough of that CO2 remaining in the atmosphere for FF burning to account for any significant part of the increase of total atmospheric CO2.
https://www.mdpi.com/2413-4155/6/1/17#B31-sci-06-00017
This seems like a very important finding relative to what humans are attempting to do about the mild warming of the past couple of centuries. It may not itself provide extensive insight into to the arguments of this current paper, published about 4 months after it, but it is certainly relevant to the human role in the destruction of modern technological society.
I admit that I do not have the background in either isotope analysis not statistics to evaluate this paper. I can at best follow the arguments by accepting that the experimental and analysis steps were correctly done. Perhaps it is due to this earlier, probably more complex, paper being so recent but it seems amazing to me that I have not run across even any significant acknowledgment of the paper in the places I read regularly. Maybe qualified people are taking their time considering the data and statistics before offering any views about its validity. Of course the religiously inclined will not need any analysis to condemn it but a rigorous consideration of its arguments would be most interesting.
For anyone reading here who is wondering of AlanJ knows what he is talking about…. he doesn’t.
(times are from below video)
3:22 – After 2002, fossil fuel emission rate increased: .275 GtC/year, an increase of 300% ***
3:45 – 1995 – 2002, atmospheric CO2 increased linearly, 2.1 ppmv/year;
— After 2002, atmospheric CO2 increased at the same rate.
4:10 – “The growth of fossil fuel emission increased by a factor of 300%; the growth of CO2 didn’t blink. How could this be? Say it ain’t so.”
Murry Salby, London Lecture (2015)
Moreover,
See also:
Bearing in mind the following:
The linear warming trend since January, 1979 remains at +0.15 C/decade … .
Dr. Roy Spencer, July 2, 2024.
(Source: https://www.drroyspencer.com/ )
(Source for the above atmospheric CO2 graph — boy, that Edit button doesn’t last long! — https://www.climate4you.com/ )
I have NEVER believed we have all CO2 emissions accounted for and don’t know what changes there are for the sinks either.
“After 2002, fossil fuel emission rate increased: .275 GtC/year, an increase of 300%”
That is false
CO2 emissions barely changed from 2002 to 2003
2002 = 25.25 billion metric tons
2003 = 27.65
2022 = 37.15
Up +41.5% in 20 years
Where is +300%?
Salby is an idiot
And so are you for listening to him
RG is a gormless twit without any understanding of the atmosphere or carbon cycle.
Salby has several more time scientific understanding than a scientific non-entity like RG is possibly capable of.
Indeed. This is so blatantly obvious that it is clear that Greene is not here to learn or to present rational, data-based, arguments. He is sole purpose is to attempt to keep confused/fooled anyone currently in the AGW cult who is silently reading, here. Only someone ignorant of the facts could be fooled by such empty, off-puttingly rude, bluster.
The idiotic thing is to speak before listening. Watch the video (it is blatantly clear that you did not — or you could not understand it…) — then, speak. The information you lacked before you wrote your comment is at around 33:23.
Fossil fuel emission increased linearly until 2002. After 2002, it also increased linearly, but, at a rate 300x faster.
And, so was CUP (Cambridge University Press) for publishing his book. And so are the thousands of teachers and students who purchase Salby’s book. And so is Richard Lindzen who, on a site honoring Salby on his death, praised Murry Salby, his former student, as an exceptionally fine scientist.
You didn’t even comprehend what Salby actually said, did you.
Perhaps you can read a basic chart.. but I expect not.
The figures in that graph must be for a single very small country, whose CO2 emissions are only about 3% of the global total. The actual global CO2 emissions from fossil fuels in 2014 were about 9.7 GtC.
You can convert GtC (a/k/a PgC) to ppmv by dividing by 2.1294.
9.7 / 2.1294 GtC/ppmv = 4.6 ppmv of CO2.
The measured CO2 level at Mauna Loa increased by only 4.27 ppmv over the TWO YEAR period 2013-2015 (i.e., from its 2013 average of 396.74 ppmv to its 2015 average of 401.01 ppmv).
So humans were adding about 4.6 ppmv/year to the atmosphere, but the amount in the atmosphere increased at only about half that rate. That’s because natural removal processes (terrestrial greening, dissolution into the oceans, etc) are rapidly removing CO2 from the atmosphere. The reason the amount of CO2 in the atmosphere nevertheless increased is simply that the natural removal processes are currently slower than the rate at which mankind adds CO2 to the air. (That will not be the case forever.)
Richard, your figures are only slightly different from the GCP’s, for fossil carbon emissions alone:
2002 = 26.28 Gt
2003 = 27.65 Gt
2021 = 37.12 Gt
They also add rough estimates of “land use change emissions” (from cutting forests and draining swamps), but that only increases the totals by about 10%.
But your point is correct: Dr. Salby was wrong. I critiqued a different version of his lecture, here:
https://sealevel.info/Salby_CO2_lecture_critique.html
However, Dr. Salby is not an idiot; He died in 2022.
Alan is correct, Janice. The late Dr. Salby was wrong.
Comments are disabled on that version of Salby’s lecture, but he delivered essentially the same lecture in various venues from 2011 through 2018, and at least four of them are on youtube. I wrote a detailed critique of one of them, which you can read here:
https://sealevel.info/Salby_CO2_lecture_critique.html
See also:
https://sealevel.info/carbon/carbonflux.htm
And also:
https://sealevel.info/atmospheric_co2_increase_is_not_from_ocean_outgassing.html
And especially:
http://www.ferdinand-engelbeen.be/klimaat/co2_origin.html
IANAS but perhaps you can help me out here. You say
I presume by “there is now” that you mean the recent (174 year) temperature rise of roughly 1.5°. Do you mean the temperature has never before, at any time in the last few hundred million years, risen so much in such a short time?
Please show a citation. That’s a remarkable conclusion.
“Do you mean the temperature has never before, at any time in the last few hundred million years, risen so much in such a short time?”
It means what it says. It does not mention temperature.
That is about the lamest “I know nuthink” excuse I have heard in a long long time. The question is temperature vs CO2, which came first. Since it’s not one, it’s got to be the other.
“There has never been a mechanism to inject mass quantities of CO2 into the atmosphere on short timescales before, and there is now.”
Thank goodness !!!
Humans have saved the planet by emitting a small amount of CO2 , invigorating the carbon cycle , which provides for all life on Earth.
hmmm… so no scientist is allowed any hubris– didn’t know that
That may have been true before the evolution of life on Earth, but is no longer the case.
If [CO2]→T is valid, how do you explain the increased slope and peak of the seasonal CO2 ramp-up phase during El Niño years? Are you suggesting that CO2 from an unknown source is causing El Niños?
AJ is just regurgitating AGW-cult mantra anti-science.
He actually has basically zero scientific understanding what he is talking about.
El Niño is not driven by CO2 concentration, if that’s what you’re trying to get at.
“El Niño is not driven by CO2 concentration”
WOW.. you finally figured it out. 🙂
Add the fact that the only warming in the UAH data comes at El Nino events…
… you have just admitted that the slight warming in the UAH period is not driven by CO2.
Well done.. 🙂
No, that is not what I was driving at. I was pointing out the absurdity of your claim if taken to its logical conclusion. It is clear that the warmth of El Niños leads to a temporary change in the shape and amplitude of the seasonal ramp-up curve and there isn’t sufficient capacity in the sinks to remove the excess CO2 during the year.
The graph I have posted elsewhere in this topic clearly shows that the rate of CO2 growth is strongly linked to the ocean atmospheric temperature.
There is a surge in the rate of CO2 increase at El Nino events.
There is even a slight increase in the rate of CO2 increase associated with the El Nino step change.
Consider the possibility that the warming ocean water could speed up the bacterial decomposition of the short-lived plankton at the surface.
AlanJ posted:
Never is an awful long time.
Unfortunately for him, there is this: The Chicxulub asteroid impact, which occurred about 65 million years ago, released between 425 and 1,400 gigatons of carbon dioxide (CO2) into the atmosphere in a matter of minutes . . . the release of 425 gigatons of CO2 would be more than 10 times the amount of CO2 humans emitted globally in 2014. The carbon dioxide would have come from carbonate rocks on the Yucatán Peninsula that were vaporized by the impact energy.
Now . . . AlanJ was saying something about another person perhaps being outside the “scientific process” . . .
Unfortunately for the dinosaurs, the sedimentary gypsum was also converted to sulfate aerosols, along with carbon from the incinerated organic material, leading to a global Winter that lasted longer than the dinosaurs wanted to diet. The pulse of CO2 didn’t help even if it could.
You currently have 47 downvotes for a REASONABLE FACT BASED COMMENT.
THIS WEBSITE IS FULL OF COMMENTS BY FOOLS, such as BeNasty2000, AND SCIENCE DENIERS WHO WILL BELIEVE anything EXCEPT THE FACT THAT CO2 IS A GREENHOUSE GAS AND ADDING MANMADE CO2 TO THE ATMOSPHERE WILL CAUSE SOME WARMING.
What a pathetic, empty and science-free little whinging tantrum.
Diddums. !!
Now, do you have any empirical scientific evidence that atmospheric CO2 causes warming..
…or will you just have another little whinge, and a feeble grasp at a fake consensus.
But, he doesn’t respond to the hard questions raised by his “reasonable fact based comment.” He just dishes out more of the same alarmist propaganda.
As I have pointed out previously, you apparently have difficulty dealing with numbers. Saying that “adding manmade CO2 to the atmosphere will cause some warming” doesn’t address the issue of whether that warming is significant or not. Myself and others have acknowledged that the system has feedback loops. The question of the climate sensitivity to a doubling of CO2 has not been resolved; however, recent work strongly suggests that 3 degrees is too high.
He didn’t post any “reasonable fact based comment”.
Everything he posts is FACT-FREE… and totally unreasoned.
So why are you screaming, and why do you waste your time here?
I guess it’s all over for the CO2-phobes.
CO2 increases follow temperature increases. CO2 is not the control knob of the Earth’s temperatues, something else is. CO2 is a follower, not a leader.
And here some people thought the science was settled.
“CO2 is a follower, not a leader.”
This has been known by rational scientists for a long time.
AGW (by CO2) is NOT science… it is an unproven conjecture, that under “real science”, would have been dumped ages ago.
Models of course can be made to say anything the modeler wants. So the real tests of the veracity of a model are:
How well does the model create known historical outcomes using established, unmanipulated real world data?Is there a plausible mechanism based upon well understood real world system (not just a single parameter) measured behavior that takes into account all of the known conditions to replicate the proven outcomes?
Well, we know all of the global warming models have done a poor job of replicating past known behavior, which on its own invalidates the models.
As to test no. 2, there most certainly IS a plausible mechanism by which higher atmospheric temperatures lead to elevated carbon dioxide concentrations of atmospheric gases. Namely:
The heat sink of the world, that serves a determinative role in absorbing, storing, releasing, and distributing heat energy globally due to solar inputs is of course the oceans.The largest sink of carbon in the world is also contained in the oceans by a factor of 16:1The solubility of any dissolved gas in a liquid aqueous solution is inversely proportional to the temperature of the solution, so that as oceanic temperatures increase, off gassing of dissolved CO2 increases proportionally.Higher oceanic and atmospheric temperatures increase biological activity, making green plants as well as oceanic algae and phytoplankton numbers increase with higher temperatures.Higher numbers of green plants due to warming tends to increase oxygen production via photosynthesis, and also reduce CO2 concentrations in the atmosphere, tending to create a negative feedback
These are just 5 plausible, well proven mechanisms that support a theory that atmospheric warming precedes increasing CO2 concentrations. Others exist too
Of course the warmunists ignore these mechanisms, and refuse to engage in analyzing the relative effects of each on atmospheric CO2 concentrations … because they already know the answers and do not wish to let them get in the way of their unscientific narrative. They prefer to cite the members of their own sect as authorities, and have claimed that the “science is settled”, which to any real scientist is a preposterous notion, that nothing more can be learned, and established dogmas cannot be challenged.
.
It isn’t an either-or proposition. Atmospheric CO2 concentration affects (but not controls) temperature, and temperature affects (but not controls) atmospheric CO2 concentration. The fact that the causality goes both ways, i.e., that rising temperatures & receding ice sheets elevate CO2 levels, and that rising CO2 levels cause warming, constitutes a “positive feedback loop,” albeit a weak one:
https://sealevel.info/feedbacks.html#co2watertemp
So Al Gore was wrong, but so is Koutsoyiannis.
That positive feedback contributes to the observed hysteresis between glaciated and deglaciated states over the last million years. The Earth tends to “latch up” in either a heavily glaciated state, or an interglacial state. An electrical engineer would recognize that as similar to a Schmitt Trigger circuit, like the 74LS14, and those are made by adding positive feedback to a circuit design.
Most natural feedbacks are negative (stabilizing / attenuating). But when you see a system with hysteresis, i.e., which tends to latch up in either of two states (e.g., either heavily glaciated, or interglacial), it means you’re probably looking at a system with positive feedback, and considerable non-linearity.
“Since these papers challenge the prevailing anthropogenic global warming (AGW) narrative so acutely”
It doesn’t at all. That narrative is simple. If you add CO2 to the air, you will get warming. We did it, and we did. We dug up many gigatons of C and burnt them That has never happened before. And if we keep doing it, it will just get warmer and warmer.
In those earlier times, before our digging, it did often happen that temperature varied, and caused outgassing of CO2. That is a separate matter.
That’s all true, Nick, but you don’t get MUCH warming.
We’ve apparently gotten only a little over 1°C of warming from all the CO2 emitted since the start of the industrial revolution.
What’s more, additional CO2 has a logarithmically diminishing effect on temperature.
What’s more, the higher CO2 levels go, the faster natural negative feedbacks remove CO2 from the air.
So, yes, adding CO2 to the atmosphere increases the amount of CO2 in the atmosphere (obviously), and it helps make the Earth’s climates slightly milder. But not not much.
“What’s more, additional CO2 has a logarithmically diminishing effect on temperature.”
Yes, but our emissions are pretty much exponentially increasing.
“…exponentially increasing…”.
Not actually, emissions can only increase at the rate people can afford to purchase fuel, so what we saw in the last decade of increase in world wealth and cheap oil simply will not continue.
Stokes is gaslighting, again.
Actually Nick, the rate of growth of atmospheric CO2 is closely link, with a slight lag , to Ocean atmospheric temperatures.
That rate of CO2 growth even increases with the step change after El Nino events. (as shown of graph elsewhere)
Human emission are basically insignificant because they are only 4% or so of the total CO2 flux.
And the sinks can’t tell anthro’ emissions from natural and draw down the emissions from all the sources in direct proportion to their concentrations (partial pressure). If the anthro’ emissions were to magically disappear tomorrow, the total atmospheric CO2 partial pressure would decline in the absence of the anthro’ CO2, and the sinks would absorb less than currently. Thus, we might still see a net rise in atmospheric CO2. Part of the problem is that photosynthetic draw-down occurs for fewer months than the seasonal ramp-up phase while the decomposing bacteria work pretty much year round, unless or until they run out of detritus to work on.
Nick wrote, “but our emissions are pretty much exponentially increasing.“
Yes, our emissions have been exponentially increasing, and I certainly do not agree with Zeke Hausfather that CO2 emissions might have already peaked in 2019.
But our CO2 emissions cannot continue their exponential acceleration indefinitely. Fossil fuel resource constraints ensure that the acceleration must begin to taper off, and I suspect that it will do so sooner, rather than later. Do you agree?
For the last thirty or forty years CO2’s radiative forcing trend has been increasing hardly more than linearly, because of the combination of logarithmically diminishing effect and approximately exponentially increasing emissions.
“Do you agree?”
Yes, but it still may get uncomfortably warm by then.
Just as well forward looking citizens are developing renewables 🙂
“Yes, but it still may get uncomfortably warm by then.”
Or it might not.
CO2 has nothing to do with it.
No-one is “developing” renewables. They are a dead end as an electricity supply.
The world CAN NOT ever function using just wind and solar.
They are “installing” a wasteful, erratic, short-lived, environmentally unsustainable load of junk.
Have you got that plan in to cover your local hills with wind turbines?
Told the neighbours ??
Nick wrote, “Yes, but it still may get uncomfortably warm by then”
Not a chance. Look in the mirror. Notice how little fur you have. That’s because Homo sapiens is a tropical species.
In most places, most of the time, temperatures are far below optimum for us. So it is unsurprising that studies show that warming temperatures save lives. In fact, studies show that even in tropical countries cold kills more people than heat does.
https://twitter.com/ncdave4life/status/1670083998087823362
And eating up the planet at a greatly accelerated rate in the process of getting only minor returns.
Surely you mean backward looking citizens are the ones pushing unreliables?
Reportedly there is enough methane in methane clathrates of the deeper ocean and in permafrost to provide large amounts of methane for quite a few hundred years, if anyone figures out how to use that source (which seem reasonably probable).
Perhaps. But it sounds very challenging, so I wouldn’t count on it.
Betting on technology breakthroughs which might or might not happen is risky.
The wind & solar industries might become economically viable, too, someday, if there’s a breakthrough in battery technology, to solve the intermittency problem — but I wouldn’t count on it.
The lifetime problem of all three is still a killer.
It is a rather different kind of problem than inventing something that runs on a non-existent property of the universe, such as battery chemistry that could store the necessary amounts of energy. The resource exists in great quantity. It isn’t even so difficult to release the gases from the ice. The solution seems to mainly be finding a way to do it in a controlled fashion, under difficult physical circumstances, and collecting the valuable product for use. There are all sorts of useful substances in petroleum, for instance. Getting at them didn’t happen overnight.
CO2 emissions are becoming a smaller and smaller percentage of total atmospheric CO2 as total atmospheric CO2 keeps rising year after year.
That does not fit any common definition of “exponential”
“We’ve apparently gotten only a little over 1°C of warming from all the CO2 emitted since the start of the industrial revolution.”
There is absolutely no way of knowing that. !
Certainly can’t use surface temperatures.
some is LIA rebound.
Where is your measured scientific evidence of warming by atmospheric CO2??
You know you don’t have any.
You want to go back to wood heat and oil lamps?
How ’bout candles, they are good for light?
I agree totally.
Coming out of the LIA did likely impact CO2 levels through until now also. So there are two causes of CO2 rising in atmospheric concentration FF combustion and the LIA exit.
The feedback looks well below unity most especially if you follow WE’s work and potentially negative.
So RCP8.5 is dead and the IPCC agrees they also suggested that RCP7.0 is unlikely, so there goes the climate emergency.
A sane world would bias development towards nuclear and gas to allow all inhabitants a potentially improving lifestyle while we relish a better climate.
As the rest of the world warms, the Arctic is warming 2-4X as fast. Huge quantities of organic material, sequestered in the permafrost, is now being exposed to decomposing bacteria. As the world warms, boreal forests can produce more CO2 from respiring because the Winters are warming. As the oceans warm, more out-gassing can take place. Lastly, as NASA documented ‘Greening’ is taking place from the fertilizer effect of CO2, there is more detritus available for bacteria to work on. It is more than just “two.”
‘We dug up many gigatons of C and burnt them.’
I’m willing to bet that the ‘many gigatons’ of carbon that we’ve burned is a minuscule fraction of the amount sequestered in carbonate rocks, yet the best paleo data we have from 65+ my of drill cores clearly indicate that temperatures over that period were driven by land movements (tectonics) rather than CO2.
Frank,
Carbonate rocks are truly sequestered, and the reason is acid/base. The C can only get into the air if some source of acidity liberates it (or interaction with magma).
And for the umpteenth time, no-one is saying that temperatures over 65 my were driven by CO2. They weren’t. No-one was digging up and burning C. They are now. That is causing warming, and will cause a lot more.
“ That is causing warming, “
Total BS !!! Scientifically unsupportable mantra gibberish !
“C” is not in the air….. more anti-science gibberish
(unless your name is Lucy)
‘And for the umpteenth time, no-one is saying that temperatures over 65 my were driven by CO2.’
Nick, I’m certain I can find quotes from some of your co-alarmists to the effect that CO2 does indeed drive climate, whether over 65 my or throughout the Pleistocene ice age for that matter.
So here’s the question – if sequestering CO2 doesn’t affect climate, why would a returning of a minuscule portion of that CO2 to the atmosphere have any effect?
The effect depends on the amount of CO2 in the air, not in the ground. We have increased that by 60%.
“The effect depends on the amount of CO2 in the air, not in the ground.”
The ONLY proven effect of CO2 is near the ground ground.. ie tree growth.
There is no empirical scientific evidence that CO2 has any effect on the atmosphere.
You are stuck in a little anti-science brain-washed fantasy… with no way out.
“We have increased that by 60%.”
More BS. !!
The rate of CO2 growth is linked to ocean atmospheric temperatures…
… not to the tiny % of human CO2 flux
Nick, you seem to be purposefully missing the point that if the sequestering of a massive amount of atmospheric CO2 in carbonate rocks had no effect on temperature, then the release of a much lower amount of CO2 back into the atmosphere via the combustion of fossil fuels can’t have any effect on temperature either.
” if the sequestering of a massive amount of atmospheric CO2 in carbonate rocks “
Do you know how much that happened, and when? As I said above, sequestering as carbonate requires a massive about of alkali. Where would that come from?
In most cases, like the Cliffs of Dover or the thick sequences of Paleozoic limestone/dolostone in the US Midwest, or the Mesozoic Dolomites in the Alps, it was extracted from sea water by marine organisms that harvested bicarbonate from the water. It has been occurring since the first stromatolites in the early-Precambrian, but has accelerated with the evolution of reef-building organisms. Terrestrial plants extract CO2 from the air, while marine calcifiers extract dissolved bicarbonate to make aragonite and calcite. It is a part of the long Carbon Cycle.
‘Do you know how much that happened, and when?’
Refer to Clyde’s response for some specific details. I would only add that carbon sequestration has been going on just about everywhere since at least the onset of the Phanerozoic.
“massive about of alkali. Where would that come from?”
roflmoa.. The whole darn ocean is alkaline, dolt !!
And surrounded by alkaline rock formations.
Compared to when? Today, it is a little north of 400PPM; during the PETM it reached about 2,000PPM. Today, it is only about 20% of its Cenozoic peak, and much less than the Paleozoic peak.
Nick wrote, “We have increased that by 60%.”
Nick is referring to the radiative forcing increase.
The amount of CO2 increase is (423-280) / 280 = +51.1%
But the RF increase is log2(423/280) = +59.2%
I’ve seen more than a few paper saying CO2 increases at various times over the past couple hundred million years or more were indeed responsible for temperatures much higher than today.
Saying doesn’t make it so. Yes, CO2 has varied considerably over geologic time. However, the question on the floor is whether temperature drives CO2 or vice versa.
You are not following the thread. Nick said no one makes such claims. He seems to be not only opposing the conclusions of all those papers where such claims were made (CO2 drove long ago temperatures) but denying that they exist. I said I’ve seen many such claims, in writing. I certainly offered no opinion that such papers were any good.
Why aren’t they saying it? Anthro’ CO2 is no different from that coming from volcanoes or decomposing organic material. And, CO2 has been much higher in the past. Yet, except for some extinctions more plausibly assigned to Large Igneous Province events, plate tectonics, and asteroids, the world didn’t come to an end. Indeed, the PETM occurred during a time of rapid and diverse evolution of mammals. The warmth and CO2 provided abundant food for the bottom of the food chain, which in turn supported the mammals. The Eocene was a period of a salubrious climate that encouraged mammalian diversity. It was ended by abundant effusive vulcanism during the Oligocene.
Nick says:”If you add CO2 to the air, you will get warming.”
This is a false statement.
Why did the temperature rise so quickly during the PETM — and apparently then fall as quickly?
I don’t know. It wasn’t AGW.
What AGW is happening now…?
… that you can actually provide measured proof for.
Lots of AUW.. but that is not AGW. !
Your mind is still trapped in its little fantasy non-science cultism.
Obviously!
Years ago there was a study based on atomic bomb tests, their production of the C14 isotope, and the persistence of that isotope in the atmosphere, that led to the assumption that the same argument applied to the production of carbon isotopes from burning of fossil fuels. A seemingly exhaustive investigation of C12 and C13 isotopes by the same author as this current paper seems to have demolished that argument and led to the conclusion that
“From modern instrumental carbon isotopic data of the last 40 years, no signs of human (fossil fuel) CO2 emissions can be discerned;”
and
“Proxy data since the Little Ice Age suggest that the modern period of instrumental data does not differ, in terms of the net isotopic signature of atmospheric CO2 sources and sinks, from earlier centuries.”
as well as
“The greenhouse effect on the Earth remained stable in the last century, as it is dominated by the water vapour in the atmosphere:”
and
“Human CO2 emissions have played a minor role in the recent climatic evolution, which is hardly discernible in observational data and unnecessary to invoke in modelling the observed behaviours, including the change in the isotopic signature δ13C in the atmosphere.”
as well as
“Overall, the findings in this paper confirm the major role of the biosphere in the carbon cycle (and through this in climate) and a non-discernible signature of humans.”
In other words, of the ~3% to 4% of total yearly CO2 emissions that are supposedly produced by FF burning, there is not enough of that CO2 remaining in the atmosphere for FF burning to account for any significant part of the increase of total atmospheric CO2.
https://www.mdpi.com/2413-4155/6/1/17#B31-sci-06-00017
This seems like a very important finding relative to what humans are attempting to do about the mild warming of the past couple of centuries. It may not itself provide extensive insight into to the arguments of this current paper, published about 4 months after it, but it is certainly relevant to the human role in the destruction of modern technological society.
I admit that I do not have the background in either isotope analysis not statistics to evaluate this paper. I can at best follow the arguments by accepting that the experimental and analysis steps were correctly done. Perhaps it is due to this earlier, probably more complex, paper being so recent but it seems amazing to me that I have not run across even any significant acknowledgment of the paper in the places I read regularly. Maybe qualified people are taking their time considering the data and statistics before offering any views about its validity. Of course the religiously inclined will not need any analysis to condemn it but a rigorous consideration of its arguments would be most interesting.
Right, so who’s making these “popular claims”?
No one, not the IPPC, not anyone in the mainstream scientific community is suggesting that CO2 concentrations always precede climate warming.
Often the CO2 influence comes after the warming starts, due to the various well documented feedbacks (ocean out-gassing, etc).
But in our particular case, thanks to the massive input of CO2 to the atmosphere from us, that gas is now leading the current warming trend, that anyone with an eye in their head can see.
How do you manage such a load of mindless anti-science gibberish every time you post !?
“gas is now leading the current warming trend”
Complete and utter anti-science BS. !!
Where is your empirical scientific evidence?
The rate of change in atmospheric CO2 is lagged a month or two behind ocean atmospheric temperature, and very closely tied to temperature.
Even the El Nino step changes are reflected in the CO2 rate of increase.
A large pulse of CO2 comes from El Nino events.. cannot NOT cause it.
“How do you manage such a load of mindless anti-science gibberish every time you post !?”
He simply does not realize that YOU are in charge of mindless anti-science gibberish at this website, as the official Assistant Village Idiot here, hoping for a BIG promotion to Deputy Village Idiot. Keep up the nonsense posts — no one else here can beat your drive-by There Is No AGW All Climate Change Is Caused By El Ninos lunacy. You are a Champion Climate Nutter Stage IV.
Maths and charts are really very very difficult for you, aren’t they dickie. !
You and fungal should go “get a room”.
A heavily padded one. !
Be mindless together.
Now , where is your empirical scientific evidence of warming by atmospheric CO2.
We are all still waiting.
“There Is No AGW”
Still waiting for you to show us the AGW signal in the UAH data.
Don’t keep FAILING !!
Lol. And we can see that where exactly? (apart from inside your head I mean..)
That “massive” input only amounts to about 4% of the total annual flux in a typical year. A single El Niño event swamps the anthropogenic flux.
Your junk science is all fluxed up, as usual
The tiny CO2 release from the Pacific Ocean from an El Nino is offset by a tiny CO2 absorption by a La Nina in the long run.
The estimated effect of a +1 degree C., TOTAL ocean warming is a 15 to 20 ppm change of atmospheric CO2 per ice core estimates. That cycle took 100,000 years in the ice core era.
While manmade CO2 emissions are small relative to the half of the carbon cycle that is natural emissions, the carbon cycle also has CO2 absorption that slightly exceeds CO2 emissions. You ignore the absorption because you are biased and perpetually stupid.
The atmospheric CO2 only increases year over year because manmade CO2 is emitted, at around 5 ppm a year, and nature can not absorb that much extra CO2 every year …
Nature has been a net CO2 absorber for billion of years. That’s why the atmospheric CO2 was own to only 180 ppm 20,000 years ago. This is probably WAY over your head, so go out and find a 12 year old child to explain why manmade CO2 emissions increase the atmospheric CO2 level.
As I have remarked before, you don’t do numbers well.
As shown in the graph attached, the rate of CO2 increase is very closely linked to ocean atmospheric temperatures.
There is an increase in the rate of growth at El Nino events.
Even the step change associated with major El Ninos causes an increase in rate.
Because the human release is so small compared to the natural flux, there is no evidence it has any effect whatsoever.
I know mathematical comprehension is very hard for you, but do at least try.
Mid 2024 More Proof Temp Changes Drive CO2 Changes | Science Matters (rclutz.com)
Once you work that out, you can then go back to searching for empirical evidence of warming by atmospheric CO2.
https://www.mdpi.com/2413-4155/6/1/17#B31-sci-06-00017
It would be helpful if the CAGW crowd laid out the proper scientific proof of CO2 causing CAGW absent the anecdotal evidence and computer models. They lean very heavy on the greenhouse effect but water vapor is the major greenhouse player. To say there is a greenhouse effect does nothing to prove CO2 is the cause of CAGW.
Any possible effect from CO2 would be totally lost in the noise of climate variability.
That is why no-one can present any measured evidence of CO2 causing warming.
It is either immeasurably small.. or doesn’t exist at all.
Here is experimental evidence that CO2 can’t do what is claimed.
why not an actual article likn that might explain what the graph is all about?
Anthony watt’s post on the CO2 jar experiment.
The small sample of the “peer reviewers comments”, if representative of the whole, simply attack and do not offer any scientific arguments to support their position and are unworthy of anyone who claims to be a “scientist”
As I read it, these review comments that Professor Koutsoyiannis published were not a sample, they constitute ALL of the peer review comments Koutsoyiannis encountered in a second round of peer review AFTER the original peer review cycle had successfully completed. So perhaps the original peer review was more useful, since Koutsoyiannis did make revisions (that satisfied the original reviewers).
Oop, there it is. Just as it has always been.
Ever’body cabbage patch!
Kenneth, If there is no “climate consensus” , why do the first five authors you cite have the same name?
OMG! you truly are an ignorant little twit, aren’t you !
FFS read what is said… avoid making yourself look a total idiot.
“The author has had a series of peer-reviewed scientific papers published supporting this same T→CO2 conclusion”
… then cites the 5 papers.
WOW, breaking news…. drone flight over Trump rally was actually by the shooter.
Unbelievable !!
Missed this one.
A drone explains why the shooter chose that specific roof for his position. It was an empty roof. The three hired sharpshooters were inside the building. Perhaps it was too hot on the roof for them? Or they were scared of heights?
Keneth Richard is a hack writer who is a CO2 Does Almost Nothing Nutter, making the No Tricks Zone website into a laughingstock
Dr. Koutsoyiannis is a science fraud who uses guesses of climate history with ZERO manmade CO2 emissions to explain the effect of manmade CO2 emissions.
He looks at CO2 as a feedback and completely ignores manmade CO2 emissions as a climate forcing — a relatively new process barely affecting the global average temperature before the 1970s.
People who read Richard or Dr. Koutsoyiannis
are gullible fools who are conservative climate science deniers.
Dr. Koutsoyiannis is an example of how a Ph.D. can result in spouting climate science nonsense — very common in modern climate science.
Another empty tantrum from little dickie-boy.
Not a scrap of evidence.. just ranting gibberish.
A true AGW-zealot. !
“manmade CO2 emissions as a climate forcing”
Do you have any empirical scientific evidence of warming by atmospheric CO2?
Or do we just get another little ranting tantrum…. Please.. they are so stupid they are funny !! 🙂 🙂
Yawnnnn, yet you never come around to a comprehensive counter to the published paper….., you have had plenty of opportunities now, yet you continue with the useless name calling putdowns instead.
You have nothing and YOU know it!
You have less than nothing
I explained how guesses of historical climates with NO manmade CO2 emissions are being used to explain the effect of manmade CO2 emissions
That is a lapse of logic.
If you want to read any scientific paper on AGW, there may be 100,000 of them available because almost 100% of scientists believe there is evidence of a greenhouse effect and manmade CO2 increases the greenhouse effect.
Perhaps you and BeNasty should join together as Climate Dumb and Dumber, by pretending 127 years of evidence supporting AGW does not exist?
And you both must believe the greenhouse effect, including manmade CO2, is nothing more than a 127 year old conspiracy theory?
HAW HAW HAW HAW HAW HAW, I have long accepted the warm forcing effect of CO2 but most of it was in the first 60-80 ppm range which was set in 600 million years ago and little added since 1880’s when it was listed at 280 ppm level because there is little warm forcing left to run with.
It is right here is my forum for starters:
LINK
Meanwhile still no counterpoint to paper posted, maybe you have none to offer which is likely why you are farting heavily instead to distract us but having seen this behavior many times in the past I can see you are all wind and piss…..
ROFLMAO.
Yet again, all we get from dickie-boy is fact-free assertions.
Words like “I explained” coming from RG, have absolutely zero scientific relevance .
Zero-evidence submitted, just a call to a baseless consensus.
Then follows a load of pitiful attempts at juvenile insults.
We expect nothing else.
Do you have any empirical scientific evidence of warming by atmospheric CO2?
Where is the evidence of AGW in the UAH data?
Dickie know he doesn’t have an answer .. hence all the bluster.
I wonder if he has realised that the rate of CO2 increase is closely linked to ocean atmospheric temperatures, and shows zero sign of the tiny 4% of the CO2 flux human release.
“is nothing more than a 127 year old conspiracy theory?”
Actually 127 year old ERRONOUS non-science.
Started with Arrhenius… and just keeps compounding.
I can not seem to be able to find the document that contains the actual peer review comments and the author’s exchange with the reviewers. The link (Peer reviewers’ exchanges with Koutsoyiannis) only leads to a 4-page document (https://www.itia.ntua.gr/en/getfile/2468/1/documents/HensAndSerpentsEggs6.pdf). I must be doing something wrong. Thanks for any help.
You were not doing anything wrong. It was an error on my website, which affected it on the last day. Sorry. I think the error is fixed now. Please try again.
Yes, it is fixed for me. Thanks.