Guest Post by Willis Eschenbach
By way of what in my life is a fairly common path, that of a series of misunderstandings and coincidences, I ended up on the web page of the Rutgers Snow Laboratory. Remember a while back when some typically alarmist climate scientist said our children wouldn’t know what snow is? [Update: In the comments below, Rud Istvan points out it was said by UKMet’s Dr. David Viner in 2000.] Here’s the actual record of the Northern Hemisphere snow extent. Short version? No significant change.

Figure 1. Northern Hemisphere snow extent, 1972 – April 2023. Graph from Climate4You.
But I digress. I started out to tell you about the curiosity I found at the Rutgers Snow Laboratory web page. Here’s the oddity I saw when I went there.

In that list of datasets, I saw an opportunity …
… dang, sez I, if I have snow extent data for North America both with and without Greenland, I can subtract one from the other to give me snow extent data just for Greenland.
And here is that result:

Figure 2. Monthly snow extent, Greenland. Flat areas at the time of the maximum extent show months when the entire island is snow-covered.
Hmmm … further discussion below. Next, here’s the average snow extent by month.

Figure 3. Greenland snow climatology, entire dataset. Note that the island is completely snow-covered for ~ six months out of the year.
Not a whole lot of summer in Greenland.
Finally, here’s a closer look at the changes in snow extent over time.

Figure 4. Expanded view, Greenland snow extent as in Fig. 2 above. Includes snow extent linear trend (yellow/black), snow extent CEEMD smooth (blue/black), and minimum extent (solid black w/circles).
Here we can see that since 1972, by all measures and despite the general slight post-1972 global warming, the snow extent in Greenland has been steadily increasing. Not decreasing. Increasing.
- In recent years, there are more months when the island is totally snow-covered.
- Unlike the ’70s, recently there are no years when the island never got totally snow-covered.
- The trend and the smoothed values both show snow extent increasing, and
- The size of the summer melt-back to the minimum extent has been getting smaller and smaller.
Please note that I’m not making any overarching claims about the meaning of this result. In particular, it says nothing about the state of the Greenland Ice Cap.
I’m simply pointing out that during a time when the earth has been slowly warming, Greenland is getting more snow.
Ah, the unbearable complexity of climate.
Anyhow, that’s where my monkey mind took me today … go figure …
Here on our northern California hillside, we’re about six miles (10 km) from the ocean. Our house is at the location shown by the red pin in the forest at the upper right. We can see a tiny bit of the ocean between the far hills.

When the sea fog rolls in, sometimes it traps and funnels the sounds of the coast this far inland. And on nights like tonight when that is happening, along with the boom of the far-distant surf I can hear the forlorn sound of the foghorn on the breakwater at the mouth of Bodega Bay, endlessly calling lost souls home to safe harbor …
My wish is for the very best of safe harbors for all of you,
w.
As Always: When you comment, I ask that you quote the exact words you are discussing. This avoids many of the misunderstandings that plague the intarwebs.
“Is the Pope Catholic?” will always be true, barring linguistic changes.
“Does a bear shit in the woods?” has exceptions for zoos and the Arctic.
“Is there snow in Greenland?” lies somewhere in between.
There is always snow in Greenland. There are times when there is 100% coverage, and there are times when there is less than 100% coverage.
One of its ski resorts is still open for the season. https://www.skilift.gl/
Big deal. Mammoth is still open for skiing. Much further south in drought-stricken, hot as hell California!
A is a truth.
B is a truth. Quibbling about it being necessary that woods have trees above the tree-line is pedantic. Forcibly incarcerated bears do not provide an exception.
Is there snow in Greenland ranks right up there with A “Is the Pope Catholic” as a true fact.
The ancillary alarmist claim regarding Greenland as losing overall ice/snow is specious prestidigitation.
Not really helpfully . .
“Does a bear shit in the woods?”
Actually, as anyone that has spent much time in the woods knows, they prefer to do it on roads and trails to mark their territory.
Similarly, as anyone that has recently spent much time in the outdoors with their grandchildren knows, they are experiencing snow every bit as much as we did when we were kids.
On snows, ice, cloud, and conservation of the initial solar beam.
The surface net radiation is simply the net SW + the net LW.
given approximate surface values:
SW down: 185
SW up: 26
LW down 342
LW up: 398
Surface net radiation = 185 – 26 + 342 – 398 = 103 units
In a balanced scheme, the surface net radiation is = the Sensible Heat + Evapotranspiration
So 103 = SH + ET
given in AR6,
SH: 21
ET: 82
Surface Net radiation = SH + ET
103 = 21 + 82
Recognize these factors are not independent in a global scheme, such that the ET is related to cloud fraction, snows, ice, and therefore to the SW down and LW up.
And so too, to the magnitude of dynamic flux of mass and heat.
This is confirmed by the similarity of flux parameters observed from spaceborne observation.
The incoming solar beam distributed over Earth of 1368/4 minus the Outgoing Longwave Radiation:
Given the average incoming solar of 342 and the OLR 239 = 103 units.
The incoming solar minus the OLR is equal to the net radiative flux constituents at the surface, and also to the non-radiative constituents of sensible heat + evapotranspiration required by definition.
Incoming solar – OLR = Surface Net Radiation = Sensible Heat + Evapotranspiration.
It confirms also that the internal flux mechanisms are not independent from the albedo. In fact, the net internal flux mechanisms are exactly = to the albedo in magnitude.
in matching units of power:
Incoming solar – OLR = Surface Net Radiation = Sensible Heat + Evapotranspiration = Planetary Bond Albedo.
It becomes therefore incoherent to apply the Bond Albedo as an independent external factor upon the system in computation of Earth System change.
The Albedo is strictly coupled to all internal and external parameters. The cloud fraction, and the extent and distribution of ice and snows in the dissipative system, in addition to the magnitude of external solar beam intensity.
i.e. an ad hoc adjustment factor of Solar(1-albedo) cannot be applied prior to computing internal system constraints. Doing so is unphysical.
For instance, the albedo is not something different or special compared to evapotranspiration.. We would not apply a (1-evapotranspiration) parameter prior to our accounting of flux constraints. That would be ludicrous. So too, is our treatment of albedo in the dissipative thermodynamic system …
It is the full solar beam which is producing the turbulent thermodynamic structures and phase changes that result in the albedo. It is not S(1-albedo) producing the total dissipative structure. It is the initial full solar beam driving the system.
The conversion of the initial full solar beam through the system is apparent in that the surface LW down 342 is = to the initial average incoming solar 1368/4.
The system absorbs the equivalent of the full solar beam, exactly. It is only the resulting transformations of the beam that we can observe, in various wavelengths.
The albedo is a consequence of conversion, of course, like everything else.
To an observer within the turbulent boundary layer, using a thermodynamic temperature measuring device such as mercury thermometer at 2m height, the net heating mechanisms are the Net Radiation + the Sensible Heat. The ET is that latent heating in condensation, at an approximate 2km height (cloud), and so-too that locked in polar snows and ice. This is unobserved by our mercury instrument at 2m height, except indirectly by the consequences to net radiation (Net SW).
The evapotranspiration is transported to the condensing layer, and so it is coupled to the net radiation by allowing more or less incoming and outgoing radiation.
The mechanism of net energy storage within the turbulent boundary layer is not simply a radiative process. It is due to the existence of all atmospheric constituents, conduction, phase transformations, and total mass flux.
The evapotranspiration provides latent heating aloft in condensation averaging at 2km height + the dynamic distribution and phase transformations of water in mass flux, and therefore also the albedo.
The planetary effective radiative greenhouse effect cannot include the non-radiative mechanisms of storage, of course. The planetary greenhouse effect magnitude is therefore simply 103, equal to the albedo.
In short, the strict constraints upon the system become:
Initial solar – OLR = Surface Net Radiation = Sensible Heat + Evapotranspiration = Planetary Bond Albedo = Radiative Greenhouse Effect
These are not coincidences. It is the dissipative structures in the turbulent condensing atmosphere which are produced as a consequence of the the solar beam passing through the system on its way to space.
It is a striking error of judgement within climatology to forget that it is the full solar beam which initialises the dissipative process. By omitting this point, the magnitude of internal radiative perturbation is artificially amplified 30%.
These fundamental constraints make it much easier to understand.
It is easy to see, for example, that the Initial Solar – OLR = 342 – 239 = radiative greenhouse effect = 103 units. It must be so by simple logic.
103 units of radiative effect vs over 150 in a Ramanathan style scheme is equal to that proportion of the solar beam which is simply thrown out in the (1-albedo) conjecture. ~30% thrown out.
They have forgotten that the albedo is a consequence of the full initial beam, including the variable accumulation of snows, the ice, and suspended condensed matter (cloud).
It is only in this way that the solar beam is conserved. One cannot throw out 30% then subsequently compute the consequence of trace gas.
By physical necessity, the dynamic albedo component (ice, cloud, snows) is a consequence of the full initial beam and the subsequent internal system dissipative mass flux, radiative, and non-radiative flux dynamics.
If you had a point, you might have referenced it in the first sentence.
For you and your peer group, internal radiative effects cancel.
For radiation enthusiasts, you’re left with the equivalent magnitude of the initial solar beam.
For system change enthusiasts, the only degrees of freedom are the magnitude of the initial solar beam and non-radiative flux mechanisms.
I think he was referring to ‘state the conclusion first’ like an executive summary, then restate the conclusion at the end with a more that you discussed in the report. Not everyone is going to follow your details.
Yes, precisely. As of this moment 40 people got that point vs 1 who liked JCMs clumsy attempt at condescension. (I trust that my condescension is more skillful).
Could you condense that into a one liner . .
The amounts of well mixed, non-condensing greenhouse gases is irrelevant.
Accurate as a summary perhaps, but clearly the view is mistaken.
All that can be reduced to one simple statement:
OPEN OCEAN SURFACE CANNOT SUSTAIN A TEMPERATURE ABOVE 30C
From that it follows that Earth’s surface energy balance is regulated by a temperature limiting process.
We saw that process in action in the Bay of Bengal earlier in May when temperature overshoots to 31.2C:
https://earth.nullschool.net/#2023/05/10/1200Z/ocean/surface/level/overlay=sea_surface_temp/orthographic=-271.76,12.71,485/loc=88.854,15.959
Three days later down by 2C as convection kicks in:
https://earth.nullschool.net/#2023/05/10/1200Z/ocean/surface/level/overlay=sea_surface_temp/orthographic=-271.76,12.71,485/loc=88.854,15.959
No amount of cloud parameterisation will fix the basic fault in climate models because clouds respond to the surface temperature through convective instability and it is a very powerful and narrow surface sunlight regulating regime caused by the level of free convection approaching the altitude of freezing. So any water vapour ejected above the LFC immediately turns to reflective ice.
The cyclone that knocked the heat out of the Bay of Bengal a week ago would have been the shiniest surface on the planet during that week. It would reflect more than 50% of the available solar EMR.
hi RickWill,
the atmosphere works to maximize the rate of vertical and poleward mass flux while simultaneously maximizing the rate of radiative transmittance.
To achieve this, the atmosphere maintains a continuous critical non-equilibrium dynamic state of instability.
Your hot temperature overshoot value is not innately special from a physical point of view, like the freezing point of water, but it offers an indicator of a critical point of instability specific to todays tropical column.
Similarly, a critical point of instability can be initiated at the cold end, at height or poleward in advection, by increasing a critical gradient just so.
as an edit: It occurred to me that you may wish to investigate if there is a zonal component to your critical surface temperature. Such that there may be a decreasing sensitivity of vertical dynamic instability heading poleward, related to decreasing total column depth.
I have and it is always 30C in open ocean. The regulating temperature is solely dependent on atmospheric mass. Which does not change for a 30C column over any open water because the atmospheric water content is the same.
The critical condition for the temperature limit is the level of free convection approaching the altitude of freezing. That altitude does not change for a column over open ocean at 30C.
https://wattsupwiththat.com/2022/07/23/ocean-atmosphere-response-to-solar-emr-at-top-of-the-atmosphere/
It is possible for an ocean surface to exceed 30C at locations like the Persian Gulf where and LFC cannot form. For example:
https://earth.nullschool.net/#2022/08/20/0000Z/ocean/surface/level/overlay=sea_surface_temp/orthographic=-290.46,33.01,485/loc=52.615,25.806
Yet the mid level moisture remains low:
https://earth.nullschool.net/#2022/08/20/0000Z/wind/isobaric/500hPa/overlay=relative_humidity/orthographic=-290.46,33.01,485/loc=52.615,25.806
At latitudes higher than 7 degrees, the convective potential that leads to cyclic instability can give rise to convective storms as recently observed in Bay of Bengal. They are not the regular temperature relief valve but the atmosphere in overdrive. A large region with enough convective potential to spin up a cyclone under the influence of Coriolis acceleration once the initial instability occurs.
As the NH ocean surface continues to rise with the increasing June solar intensity, there will be more cyclonic storms. The Gulf of Mexico will look more like the Bay of Bengal just a bit later in the year. That guarantees more water into central USA in later summer and accelerating snowfall.
A bit more warming , a bit more snow … looks like a little negative feedback …
😉
Indeed—a bit more warming, a bit more evaporation, a bit more snow, a bit higher minimum snow cover, a bit higher average albedo, a bit less warming.
A bit more negative feedback!
Yep, that is exactly what I would have expected. If you warm the ocean water around Greenland (and Antarctica) wouldn’t your simple first-order model predict MORE snow over land? Both are below freezing most (or all) of the year.
Further, the climate can’t have all positive feedbacks due to warming, or the needle would be pegged at “10” all of the time and the record would then clearly show a near perfect match to the external celestial effects on climate.
But Little Ice age effects with more snow especially in southern tip of Peninsula ( where the Vikings lived) was a colder time.
Remember snow can last longer than most other climate effects like rain.
I would be interested in the ‘snow line’ for Greenland where the snow stays all year and if its moving south , as the data suggests
Nice post, WE. Three observations.
Thanks, Rud. I couldn’t remember Dr. Viner’s name and I was too lazy to track it down. I’ve added a note to the head post.
Best to you and yours,
w.
Likewise.
Viner was referring to the south of England specifically. He also said “Heavy snow will return occasionally, says Dr Viner, but when it does we will be unprepared. “We’re really going to get caught out. Snow will probably cause chaos in 20 years time,” he said.”
Which was fairly accurate. When he made the statement London’s last significant snowfall had been 9 years previous.
Williz
Have you seen this
New Climate Model Accurately Predicts Millions of Years of Ice Ages
https://www.universetoday.com/161458/new-climate-model-accurately-predicts-millions-of-years-of-ice-ages/
I love the word ‘accurately’ in the link – who’s going to still be around to correct them?
“I’ll happily pay you Tuesday for a hamburger today.”
All good grifters know that you make sure the scam is hidden at least as long as it takes for the money to be transferred to their hands!
I think the accuracy refers to previous ice ages not future
Thanks, Ben. Poor headline. They should have said “hindcasts” rather than “predicts”.
Specially true since they’re talking about the ~ 40,000 year ice age cycles in the early Pleistocene, 1.6-1.2 MYA, and not the ~ 100,000 year modern ice age cycles.
w.
I believe Peter Wadhams is the person the new King, Al Gore, and others have taken the no-sea-ice prediction from. The celebrities wouldn’t know sea ice from a chunk of freezer ice if served in a drink.
Rud,
I am not sure your # 2.) is necessarily correct?
The measured warming seems to support amplification of the warming in the Arctic. (Measurement location and scarcity problems notwithstanding.)
However, I believe it is certainly possible to have warming in the Arctic AND more snow cover on Greenland.
I think Wadhams’ prediction was wrong because ice cover in the Arctic is a negative temperature feedback. The increased radiative heat losses to space appear to be larger than the albedo effect of the ice cover over water. I believe the Denmark researchers attribute 80% of the following seasons ice formation as a function of the extent of the previous seasons ice melt. (Basically, more ice melting in the summer, more ice formation in the winter – suggesting a negative feedback.)
I try to keep it all simple and obvious. Alarmists apparently keep it mostly complicated and non-obvious. You might be right, but I don’t care for climate blog war purposes.
Dr. Viner vs Science: https://www.youtube.com/watch?v=3rjif0U7QbM
Well spotted Willis. It is always interesting when observations contradict the narrative.
In a similar vein, I found this at the Goddard Institute of Space Studies (GISS) which is part of NASA.
https://earth.gsfc.nasa.gov/sites/default/files/neptune/files/SH_IceArea_Monthly_1978-2017.txt
It is the Antarctic Sea Ice extent from November 1978 to December 2017.
I plotted the total in a spreadsheet and the trend is positive, increasing by an average of 20,000 square kilometres per year.
I am sorry but I don’t know how to post the graph here in the comments.
Here you are, just a quickie…
Thank you Peta although yours is “Total Antarctic Ice” while I was looking at “Sea Ice Extent”. Similar but not identical.
How does one post a graph? I have often wanted but not known how.
Just click on the icon in the bottom right corner – see attached image. I think it has to be a JPG or PNG or other graphic format.
If you attach an image, it often shows up very small on the web page, so click on it to see it in full size.
However, an important point is that the file can’t reside on one’s personal storage device. It must be an accessible URL on the internet.
Thanks to both Smart Rock and Clyde Spencer.
Right mouse click the image can be graph or even map or picture, will give options list . Choose copy image adress towards the bottom
Then on bottom line of post comment box is a little image in far right corner.
click on that and it will open a new windows dialog box and paste what you copied in to the file name and click open . The system should do the rest. Works only with file types mentioned tif, jif, jpeg,jpg etc
Antarctic Sea Ice areas; what is extremely noticeable is that they are cyclical opprox 6-7 years cycle. Fascinating. Anyone explain . .
Butt but but….what about the Snows of Kilimanjaro?
Wrote that up in the eponymous essay in ebook Blowing Smoke. The problem is sublimation, formerly hindered by very moist upconvecting air from the formerly forested downslopes. Illegal logging has reduced those forests bay about 75%, so now the upconvecting air is dry enabling sublimation. Nothing to do with climate change.
Still there.
True, but not nearly as much as before thanks to the illegal downslope logging.
Yeah. Change of land use will change a weather pattern – just look at Lake Baikal (I think).
There are two different sections in the data. One with a strong decreasing trend from the mid-70s to the late 90s, the other without a significant trend since the late 90s.
The reason is the different climate regimes separated by the 1976 and 1997 climate shifts.
Similar trend breakpoints can be found in lots of data, including Arctic sea-ice decrease, Greenland mass balance change, Greenland fresh meltwater runoff, and many more.
It is all related to changes in poleward heat transport that constitute the basis of the Winter Gatekeeper Hypothesis of climate change.
Snow is transported to Greenland by the atmosphere, and the different trends are due to changes in atmospheric transport.
Warming in the Arctic is anti-correlated to warming in the Northern Hemisphere, and anti-correlated to solar activity with a lag for the past 2000 years.
Kobashi, T., Box, J. E., Vinther, B. M., Goto-Azuma, K., Blunier, T., White, J. W. C., Nakaegawa, T., and Andresen, C. S. (2015), Modern solar maximum forced late twentieth century Greenland cooling, Geophys. Res. Lett., 42, 5992– 5999, doi:10.1002/2015GL064764.
Late twentieth-century Greenland cooling meant less snow, as less latent heat was transported.
Lower-than-average solar activity has contributed to Greenland’s warming since the late 1990s.
There must be a distinction between surface temperature, and the latent heating of atmosphere aloft.
At around +/- 60 degrees latitude, the magnitude of transmitted flux is maximum, compared to other parts of the globe. There, the transported latent heating of the condensing cloud deck maximizes transmittance through the relatively transparent atmosphere.
There at +/- 60, the surface can cool, while the atmospheric column transmits a higher magnitude of flux.
At 60 latitude the transmitted flux density is higher than in both tropics and at the high poles. In the tropics the atmosphere is too opaque, at the high poles the temperature is too low. Maximum transmittance occurs in the zones +/-60.
“…it says nothing about the state of the Greenland Ice Cap.”, OK, It says nothing specific or useful as a measure of the state. However, Ice Caps (continental glaciers) are fed by snowfall that accumulates sufficient depth to compact the snow, expel the trapped atmospheric air, and transition into ice. Snow is about 90% air and glacial ice is about 10% air, so it took a lot of snow to create a mile-thick Ice Cap on Greenland.
If Greenland is getting more snow, then can we imply that it is accumulating ‘more ice’.
But of course it may also be losing ‘more ice’ overall at it’s edges or wherever.
Greenland is getting more snow because most of the the ocean surface is warmer and there is more exposed surface in the vicinity of the Island. The altitude of the summit has increased 170mm in the last decade. But the warmer water is eating away at the ice shelves where glaciers terminate. So overall, the ice mass is still declining.
The ocean surface will get a lot warmer and there will be a lot more snow before it begins to accumulate fast enough to cause a net increase in ice mass.
Yes, since 2018 the surface mass balance of the Greenland ice sheet has increased by about 2,000 GT while over the same period calving of glaciers and melting has resulted in a mass loss of ~3,000 GT leading to a net loss of ~1,000 GT.
Just a general comment.
It seems to me on a quick visual scan of Fig.1 and Fig 4 that the variability of the snow cover has actually decreased over the last 50 years in both the N. Hemisphere generally and also Greenland. This is contrary to the narrative of ever increasing, hightly unpredictable weather we get from the media every day. I’ve noticed the same trend of decreasing variability of rainfall at my home in New Zealand over the last 42 years of my daily rainfall records.
So the world is getting more stable and predictable, not less.
Well done for keeping daily rainfall records, but if you were in Auckland yesterday as I was, you will realise why the local MSM has no difficulty in spreading the “Global Warming, Worse weather events” message. For those of a religious as well as a mathematical leaning, it surprises me that so many appear to think that their 90 years of life can be regarded as typical of the last many millenia!
I tend to be curious about a data series that is cut off at one end.
I don’t doubt the veracity of the data, and understand that it is limited by the measured area of Greenland. But the snow extent must extend further than the reported area and probably also has an effect upon it.
You do not reference a specific graph in your comment.
However, I believe you are referring to the flat tops on the red curves in Figures 2.) and 4.)?
That is the period of 100% snow coverage of Greenland. It just looks funny (to me) because I don’t usually view graphs that frequently run into a fixed upper limit.
Yes.
Nice post Willis. PS – Have they resolved the problem they were having with aggressive birds in Bodega Bay a while back?
They got the flock out of there.
I’m surprised that no-one has pointed out that Extent is not as important as Depth. The past was always 3-6 feet of hard-pack, now it’s covered with 3 inches of light powder!
Yeah, that’s the ticket – the emergency is still intact. Phew…
When I was at Camp Tuto, outside of Thule Air Base, in July 1966, I observed an arctic fox running on the surface of the slush over the ice. I started to step off the rock-armored terminus in his direction and discovered to my dismay that it would not support my weight, and — unlike the fox — my feet started to sink in the slush. I quickly stepped back onto firm footing. I picked up some cobbles and threw them as far as I could. They made a small crater in the slush and generally sank a foot or two, often disappearing.
The moral of the story is that it is good to define the season when describing the snow pack.
The increasing snow coverage might be because of increased Lake/Ocean-Effect Snowfall (LOES), due to reduced sea-ice coverage. Additionally, warmer air carries more moisture, which also increases snowfall, as long as temperatures remain below freezing. (For each 1°C of warming the moisture-carrying capacity of the air increases by about 7%.)
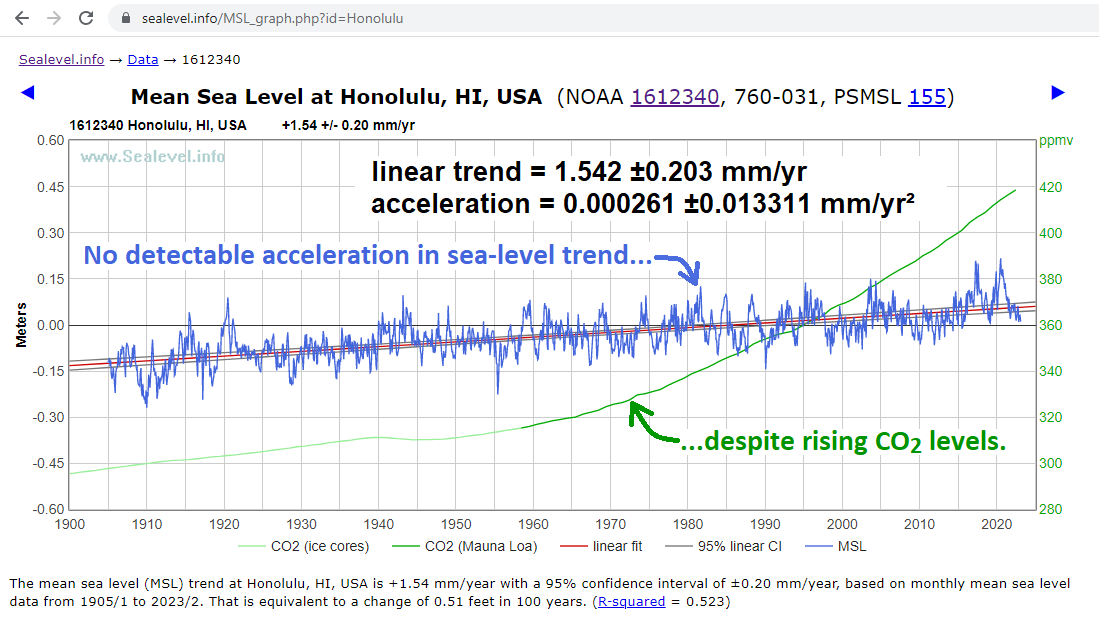
Both of those effects increase ice accumulation on glaciers and ice sheets, offsetting ice mass loss due to melting.[2] That might be why, contrary to climate activists’ predictions, measured acceleration of globally averaged coastal sea-level rise is insignificant.
https://sealevel.info/MSL_graph.php?id=Honolulu
The importance of the LOES is illustrated by the amazing story of Glacier Girl, a P-38 warbird which made a forced landing on the Greenland Ice Sheet during WWII, and was buried by snowfall which averaged about 70 feet/year, but which was nevertheless recovered (in pieces) from beneath the ice, 50 years later, and is once again airworthy.
The fact that global warming has not been accompanied by significant sea-level rise acceleration strongly suggests that the factors by which a warming climate increases sea-level and the factors by which a warming climate reduces sea-level are similar in magnitude, and largely cancel.
it is noteworthy that everywhere the temperatures remain at or below freezing somewhere within the depth of the atmospheric column. It is the key to steady state condition; that water is free to vaporize, to be transported, and to condense.
You’re assuming that a warming climate causing increased evaporation will slow down sea level rise. That evaporated water mostly falls as rain (and ≈70 percent of that is straight back into the sea). If it falls on land, it makes its way back to the ocean via rivers, or gets re-evaporated into the atmosphere, and then falls as rain.
The only place that water could be sequestered semi-permanently is in the polar ice caps, which aren’t getting conspicuously bigger. And then, if more snow falls on an ice cap, other things being equal, downslope movement of glaciers will accelerate, and it will still end up back where it started, in the ocean. So the stable rate of sea level rise is just – stable. The purported acceleration of sea level rise is an artifact of cherry-picking, data juggling and wishful thinking by alarmists. This has been shown by several well informed posts on WUWT.
There is decent evidence that global sea level was 2 to 3 metres higher than the present during the Holocene Climatic Optimum about 7,000 years ago. There’s also anecdotal evidence that it was lower than today during the Little Ice Age. I’ve read that you could walk from India to Sri Lanka in the 15th century. I wouldn’t want to try that today; you would have to walk 25 km during a single low tide. So sea level is changing in response to much longer-term climate changes than a few decades of allegedly human-caused alleged global warming.
It was probably a combination of burial by snow, AND sinking under its weight. Because the melting point of ice varies with pressure, the area under the plane was subject to melting, with re-freezing at the top.
https://en.wikipedia.org/wiki/Regelation
Also as I recall the plane had moved ~2miles closer to the coast as a result of the ice drifting downslope as well.
But it is also known that the elevation of Greenland summit has increased 170mm in the past decade:
https://earth.gsfc.nasa.gov/cryo/data/greenland-ice-sheet-summit-elevation-change
Consistent with increasing ocean surface temperature causing increasing snowfall eventually leading to glaciation:
Heat_Ice_Stores.pdf
Imagine Earth’s climate repeating what has occurred 4 times in the past 400,000 years after a brief interglacial period just as the June solar intensity begins to accelerate upward from its minimum 2000 years ago.
The total ice mass has been steadily decreasing, a loss of 5,000 GTonnes over the last 20 years.
I am fascinated by the changing of earth’s tilt or obliquely. It is one of the Milankovitch cycles which causes the ice ages. Each year the arctic circle moves about 49 feet closer to the north pole. Over many years it causes a net increase of snow level in the arctic. It will keep moving north for the next 10000 years. We may be seeing the affects of this now.
Obliquity is a bit player in glaciation. Precession is a faster cycle and clearly has the most impact on initiation and rate of glaciation as well as recovery. You find that each step downward in sea level aligns with rising June sunlight in the NH – per attached. The last periods of glaciation lasted up to 4 precession cycles. These multi precession cycles have been a a feature of glaciation since the Panama isthmus formed to disconnect the tropical Pacific from the Tropical Atlantic.
The interglacials last one precession cycle. Because it is the same part of the cycle that initiates an interglacial as initiates glaciation. Both occur when the June solar intensity in the NH is increasing. The only difference is that glaciation provides its own negative feedback when the land simply cannot carry any more ice and melting overtakes accumulation as the ice shelfs fail and large icebergs migrate south to slow down the water cycle. Once the melt starts, it intensifies but it only takes 11,000 years to pull out of glaciation -half a precession cycle. Then there is 11,000 years of SH warming, which is just reversing now as we see Antarctica and the Southern Ocean beginning to cool.
The location and time of most “global warming” is on the Greenland plateau in January – up almost 10C in 70 years. That only happens if snowfall is increasing, which it is.
Darn, Willis, Google Earth Street View goes right up to your mailbox.
Yeah, but you can’t see my house from there.
w.
Great article Willis😁😁. Wonderful graphics🤩🤩.
Thanks. I work to make my graphics as beautiful and interesting as they are informative.
w.
Re: fog off the coastal waters… We’re getting a snootful of Canadian wildfire smoke which has brought fog to Colorado’s front range. Not real common.
Interesting post.
How does that compare to the observations of increasing or decreasing Greenland glaciers
Remember with global wormtongue it’s always heads we win tails you lose.
Decreasing snow means warming melting the snow.
Increasing snow means warming because of water vapour.