(Edited/updated) From NHC:
…EYE OF CATEGORY 4 HARVEY MAKES LANDFALL BETWEEN PORT ARANSAS AND
PORT O’CONNOR TEXAS…
…CATASTROPHIC FLOODING EXPECTED DUE TO HEAVY RAINFALL AND STORM
SURGE..
DISCUSSION AND 48-HOUR OUTLOOK
——————————
At 1000 PM CDT (0300 UTC), the center of Hurricane Harvey was
located near latitude 28.0 North, longitude 97.0 West. Harvey has
just made landfall on the Texas coast over the northern end of San
Jose Island about 4 miles (6 km) east of Rockport. Harvey is
moving toward the northwest near 7 mph (11 km/h). The hurricane is
expected to slow its forward motion and move slowly over
southeastern Texas during the next couple of days.
Maximum sustained winds are near 130 mph (215 km/h) with higher
gusts. Harvey is a category 4 hurricane on the Saffir-Simpson
Hurricane Wind Scale. Weakening is forecast during the next 48
hours while the center of Harvey is over southeastern Texas.
Hurricane-force winds extend outward up to 40 miles (65 km) from the
center and tropical-storm-force winds extend outward up to 140 miles
(220 km). A Texas Coastal Ocean Observing Network station at
Aransas Pass recently reported sustained winds of 111 mph (178 km/h)
and a wind gust of 131 mph (211 km/h).
The minimum central pressure just reported by an Air Force Reserve
Hurricane Hunter aircraft is 938 mb (27.70 inches).
Harvey made landfall as a Category 4 ending the “major hurricane drought” we have been experiencing in the USA.
#GOES16 captured this geocolor imagery of #Harvey as it nears landfall on the Texas coast. Get the latest info @ https://t.co/cSGOfrM0lG pic.twitter.com/u0O9ChtJeP
— NOAA Satellites (@NOAASatellites) August 26, 2017
#GOES16 captured this geocolor imagery of #Harvey2017 – now a category 3 storm – this afternoon. Latest info @ https://t.co/cSGOfrM0lG pic.twitter.com/hGD22NpNTG
— NOAA Satellites (@NOAASatellites) August 25, 2017
It is now 4324 days since Category 3 Hurricane Wilma made landfall in Florida on October 24th, 2005.
https://twitter.com/RogerPielkeJr/status/900740028665671680

I going to be checking the offshore buoys for the real wind speed. I do not trust the NOAA to tell the truth.
Will not a land recording of Cat 3 strength be required?
The assumption at this stage is that this will happen.
The last time N. Atlantic ACE picked up out of a long slump, it was the beginning of the post-WWII sharp drop in temperatures:
The standard has been for a long time, determined/analyzed as opposed to directly measured when the latter is lower, a determination of highest wind “sustained”/averaged for 60 seconds in the windiest part of the storm, and the official altitude for determining this is 10 meters above the surface.
Harvey had actual Cat-3 surface wind measurement reported by the National Hurricane Center when it was landfalling. I would redirect the question to Harvey having achieved Cat-4 status, because Harvey did so as a result of a 2012 change of the definition of Cat-4 by 1 MPH (and the definition change considered usual practice being rounding to the nearest 5 km/h, MPH and knots). Harvey had a Cat-3 qualifying (barely) actual wind measurement, not merely an analysis that such qualifying wind existed with 10 meters of the surface in the qualifying region of the storm, reported in the #23 Public Advisory on Harvey.
Greg
If storm energy is lower during warming phases and maximal during cooling phases, then this means – we ain’t seen nothing yet!
the airforce says cat 4。
More fake news errrr climate data. Satellites showing 130ishKPH or 85-90mph on the surface. Mosher I thought you guys were all about the surface? You know where we live! NOT 5000ft in the air.
The airforce says cat 4.
sorry im not in the game of distrusting or trusting. just, the air force says cat 4.
The pressure said Cat 4. The Sat imagery and damage assessment may up that in the end, just like Andrew.
Harvey seemed to just finish an ERC and was in pirouette mode just prior to land interaction and in RI mode.
https://mobile.twitter.com/crankywxguy/status/901246608813285376
The Mesovorticies also indicate possible higher ratings.
https://mobile.twitter.com/anthonywx/status/901292304761319424
Stadium effect too.
Those who hunkered down near landfall are in trouble. This will not be pretty, let alone the next several days of continued stalled impact impeading assistance to those in need. .
T’s and P’s to those affected.
History is being made folks, hopefully we learn from it. GOES 16 will help.
@osqsss
Under the old standard that included barometric pressure and storm surge, you are correct that Harvey would be a Category 4. However, barometric pressure and storm surge were removed from the Saffir-Simpson Wind (renamed) Scale in 2009. I have not found a wind speed measurement of 130mph. I’d like to see where that was measured.
OH no. I have been waiting years for the mindless cliche “our thoughts and prayers” to go out of fashion.
” T’s and P’s ” is vomit inducing.
My understanding is that the Air Force hurricane hunters take their measurements in the higher winds at the altitude they are flying at then interpolates what the winds should be down lower and that is how they declared this a CAT IV. The sensors they drop cannot give sustained wind speeds at a given altitude simply because they are descending too quickly.
Has anyone found data from a land based station that shows 1 minute sustained winds of 130 mph (113 kt) or higher that meets the following conditions as per the following NOAA statement: “The maximum sustained surface wind speed (peak 1-minute wind at the standard meteorological observation height of 10 m [33 ft] over unobstructed exposure) associated with the cyclone is the determining factor in the scale.”
http://www.nhc.noaa.gov/pdf/sshws.pdf
During tropical storm Claudette in 1979, Alvin, Texas got 43 inches of rain in 24 hours.
RAH,
My state of the art on the Air Force Hurricane Hunters is 30 years out of date, but in the 80s we dropped sensors through the wall to measure wind speed, temperature, pressure, and dew point all the way to the surface by parachute. The sensor radioed back the readings to the dropsonde operator until impact. That may have changed, but it was a good way to study the vertical components of the eye wall.
Owen in GA says:
August 26, 2017 at 9:25 am
RAH,
My state of the art on the Air Force Hurricane Hunters is 30 years out of date, but in the 80s we dropped sensors through the wall to measure wind speed, temperature, pressure, and dew point all the way to the surface by parachute. The sensor radioed back the readings to the dropsonde operator until impact. That may have changed, but it was a good way to study the vertical components of the eye wall.
———————————————————————————————————————————-
Owen in GA
I was referring to the standards for Saffir-Simpson classification as per NOAA. They say:
“The maximum sustained surface wind speed (peak 1-minute wind at the standard meteorological observation height of 10 m [33 ft] over unobstructed exposure) associated with the cyclone is the determining factor in the scale. ”
http://www.nhc.noaa.gov/pdf/sshws.pdf
So unless the sensors dropped hung 10 meters off the surface for 1 full minute recording the wind speed, they cannot be used for Saffir-Simpson classification. Also, a hurricane of even Cat III strength can easily generate waves higher than 10 meters. Thus any readings from any sensor or anemometer on or over the water surface should be viewed with that in mind.
As a practical matter the difference between a strong Cat III and a weak Cat IV means little or nothing to those in the path. But in science I have noticed that temperatures, sea levels, etc are often written by the highest authorities are expressed right down to 10ths or even 100ths of the unit or measurement. It seems to this layman that precision in applying the standard as stipulated for Saffir-Simpson classification by the NHC, NOAA, Air Force, and all of the press, is sorely lacking in this case. And I will have that impression until someone can show the raw data taken as per the standards stated above that show Harvey had 130 mph winds or higher sustained for one minute ANYWHERE it was measured after, at, or very near the time of land fall.
Phil: As for a 130 MPH actual measurement: The National Hurricane Center’s #23 Forecast Discussion mentions multiple 110-115 knot indications from the stepped frequency microwave radiometer aboard a Hurricane Hunter plane. Although that discussion refers to those as estimates, the SFMR results are effectively indirect measurements of surface wind.
I thought it was temperatures and pressures. It did not seem to make much sense.
I am not finding any buoys that indicate sustained wind speeds above 48 Knots and gusts above 58 Knots.
http://www.ndbc.noaa.gov/obs.shtml
Earth.nullschool likewise shows the fastest wind speeds less than 130 Km/h.
https://earth.nullschool.net/#current/wind/surface/level/orthographic=-93.67,23.97,1723/loc=-95.923,27.631
Perhaps the wind speed suddenly ramped up since the stations last reported. Or… is NOAA reporting speeds near the top of the formation?
Cat 4 … 58 knots …. 130 kilometres per hour …. 125 miles per hour.
What are the winds in furlongs per fortnight?
336,000.05 fpf 😎
NDBC buoys showing 55 to 58 knots. One land station showing 65 knots at 6pm.
Typical NHC hype and media frenzy. Definitely NOT a major hurricane.
I am searching the gulf for a buoy with high ind speed – 9:01 eastern time, I see buoy Station 42020 (LLNR 1330) – CORPUS CHRISTI, TX with wind speed of 35 knots, gusts of 43 knots – it should be hellacious right there at this moment.
Officially, hurricane speeds are supposed to be reckoned at 10 meters – because that is the elevation where flying debris is going to hurt us. Who cares if the wind speed is 100MPH a quarter of a mile up – the wind is always way faster far above the ground!
http://www.ndbc.noaa.gov/station_page.php?station=42020
http://www.ndbc.noaa.gov/station_page.php?station=PTAT2
(Local Time)
Wind Speed Wind Speed (WSPD): 83 kts (95mph)(9:00 PM?)
Continuous Winds
9:00 pm WNW ( 286 deg ) 80 kts (92mph)
Peak gust during the measurement hour
8:50 pm WNW ( 290 deg ) 108 kts (124mph)
8:50 pm WNW ( 292 deg ) 75 kts (86mph)
Phil – thanks. You got the hurricane with sustained winds at 92 MPH.
That establishes the hurricane as Category 1, the lowest level, at 9pm central / local time.
http://www.ndbc.noaa.gov/station_page.php?station=ANPT2
“TIME(CDT)” WDIR “WSPDkts(mph)” “GSTkts(mph)”
09:12:00 PM W 81 (93) 104 (120)
09:06:00 PM W 82 (94) 111 (128)
09:00:00 PM W 93 (107) 113 (130)
08:54:00 PM W 84 (97) 114 (131)
08:48:00 PM W 89 (102) 114 (131)
08:42:00 PM W 96 (110) 112 (129)
08:36:00 PM W 91 (105) 114 (131)
08:30:00 PM W 89 (102) 110 (127)
Approaching Category 3: 96-113 kt
Who cares..
its blown harder before
the wind is good
noaa lies
models suck
ignore the warnings to leave. no one can predict the future.
http://www.ndbc.noaa.gov/radial_search.php?storm=at4
From this webpage for Harvey, there are 993 observations from 08/26/2017 0100 GMT to 08/26/2017 0424 GMT. The highest sustained winds were from Station ANPT2 at 8:42 PM. 96 knots is barely Category 3. The claimed maximum sustained speed of 130 mph or 113 knots is not shown in these 993 observations. Where the 113 knots measurement was taken is not shown here that I can see. If anyone know where this measurement was taken, it would be interesting to know. From all the other measurements on this weppage, the claimed 113 knots don’t seem to be credible.
http://www.ndbc.noaa.gov/station_page.php?station=ANPT2
TIME(CDT) DIR sUST kt(mph) GUST kt(mph)
08:42:00PM W 96 (110) 112 (129)
Mosher: I have always respected you, but you are just trolling. It is not unreasonable to wonder where a particular number comes from. There does not seem to be any credible claim for Harvey to be classified as more than a Category 2. There is only one single measurement at the lowest limit for a Category 3. There is no support for a Category 4 rating based on the 993 measurements referenced.
“Steven Mosher
August 25, 2017 at 8:22 pm
Who cares..
its blown harder before
the wind is good
noaa lies
models suck
ignore the warnings to leave. no one can predict the future.”
They can predict alright. Since 2005 NOAA has predicted no less than 24 major Cat 3/4/5 hurricanes to occur, with their upper prediction bound being 53 major Cat 3/4/5/ storms.
Now they have one finally form and hit the US coast, and Mosh promptly draws a bulls-eye ring around it and declares NOAA the best hurricane sharpshooters around.
Hmm
Phil.
I am Gunna believe you or
https://twitter.com/philklotzbach
In the end the decesion Cat3 or cat4 is actually meaningless. Lets call it cat3.9
still its only wind and water, and we both know those are essential to life and overall
good things.
“000
WTNT44 KNHC 260301
TCDAT4
Hurricane Harvey Discussion Number 23
NWS National Hurricane Center Miami FL AL092017
1000 PM CDT Fri Aug 25 2017
Harvey has continued to slowly strengthen since the last advisory.
Air Force Reserve Hurricane Hunter aircraft data earlier indicated
700-mb flight-level winds near 130 kt, and there have been multiple
estimates from the Stepped Frequency Microwave Radiometer of winds
of 110-115 kt. In addition, there have been winds of 135-150 kt
observed at 2500-3000 ft in the north eyewall by the Corpus Christi
WSR-88D. Based on these, Harvey is making landfall at this time as
a category 4 hurricane with winds near 115 kt.”
Its a conspiracy between the airforce and radar designers!!
Mr. Mosher:
Who cares?
CO2 has been high before.
CO2 is good.
noaa lies.
models suck.
Ignore the warnings to reduce CO2. No one can predict the future.
Gee, it’s like poetry! Iambic pentameter and all!! And we agree 50% of the time.
“In the end the decesion Cat3 or cat4 is actually meaningless.”
Absolutely not…..and it’s the most dangerous irresponsible thing they could do.
Hyping a storm, and then when people see how little actual damage was done…..
…they will think “it’s a cat 4, we should have stayed home”
Because of your agenda…you are blaming models suck….NOAA lies
Well you’re half right….
Surface-based observing sites can’t be used to verify hurricane category. Reason being is that the Saffir-Simpson scale uses a 1-minute average to determine sustained winds, but observing sites use a 2-minute average to report sustained winds.
Mr Mosher,
Interesting Tweet catch. So of the worst storms, Cat4 and Cat5, since 1890 there have been 25 such behemoths with
1893 – 1900….4 – Cat4 storms
1901 – 1914….0 – Cat4-5 storms (14 year span)
1915 – 1919….3 – Cat4 storms
1920 – 1925….0 – Cat4-5 storms (6 year span)
1926 – 1932….3 – Cat4 storms
1935………..1 – Cat5 storm
1936 – 1944….0 – Cat4-5 storms (9 year span)
1945 – 1954….6 – Cat4 storms (CO2 begins to have an effect per theory)(1893 – 1954 17 Cat4-5 storms)
1955 – 1958….0 – Cat4-5 storms
1959 – 1961….3 – Cat4 storms
1961 – 1968….0 – Cat4-5 storms (8 year span)
1969……….1 – Cat5 storm (34 years since last 5)(CO2 effect increases further)
1970 – 1988….0 Cat4-5 storms (19 year span)(CO2 effect increases further)
1989……….1 – Cat4 storm
1992……….1 – Cat5 storm (CO2 effect increases further)
1993 – 2003….0 Cat4-5 storms (11 year span)(CO2 effect increases further)
2004……….1 – Cat4 storm
2005 – 2016….0 Caft4-5 storms (Great USA hurricane drought period)
2017……….1 – Cat4 storm (1955 – 2017 8 storms since the time CO2 has had an effect on climate)
Thanks for the informative Tweet from Mr Klotzbach
As I’ve said before the buoys were not supporting Matthew as a cat 3 next to FL.
Here’s the problem. Once you’ve been caught (several times) adjusting data without justification (but with an apparent agenda) it causes anyone serious to start second guessing any data collected.
Still this is an ugly storm. A 20ft storm surge would not surprise me.
I trust the Willis approach of letting the data guide the conclusions rather than the other way around.
Regarding Philip Klotzbach’s tweet that Katrina had wind speed less than Cat-4 at landfall: At 8 AM CDT Mon Aug 29 2005, Public Advisory 26b gave a position of 29.7 N 89.6 W which Google Maps shows as having made landfall, and the reported maximum sustained wind determination was 135 MPH.
Trust the Buoys?
why?
Unadjusted data.
Mosh will tell you that even if you remove the unadjusted bouy wind speed data it has no effect on global temperature calculations, therefore the bouys can safely be ignored in favor of models.
Good Lord!
Steven Mosher: !!**where else do they get data? **!!
There is a VAST ARRAY of weather instruments ALL OVER THE COAST!!!!!!!!
for God’s sake, man, Pull UP!!
Mosh, you are an emotional basket case full of straw man bleating.
However at least there were pretty pictures in your long post. Alas, exactly ZERO new information and nothing cogent to finding a ground based wind speed reading confirming Cat 4 ground winds.
When you find that, let us know.
Is it not clear to you that say wind speed ratings like for Carla in the 60s were less likely to capture the highest wind, and comparisons should be made via the same methodology?
Try to make a cogent response. I have seen you do this on occasion.
Mr Mosher,
Please do try to stay relevant and stop cluttering up the board with wild conspiracies
I hope everybody stays safe in Texas and Louisiana!
The Alarmists will cry Global Warming as usual.
Because 2016 was the “hottest year ever” (by .05 degrees or something equally phenomenal) and now it proves warming causes a Cat 4 hurricane every 12 years or so, compared to whatever number in the past makes this look scary. I think I understand now.
I thought 0bummer was supposed to have put a stop to it all?
He did. This will be Trump’s fault.
LOL – Bingo.
Gosh, you’re right. Just think; there were no US landfall hurricanes during the 8 years Baroque Obama was in office. And now, less than 8 months after Trump was sworn in we get our first landfall hurricane!
I think I better put a sarc/ tag here just in case someone from CNN reads my comment; takes it seriously; promotes the idea; and a new round of PR firm hired $25/hr protesters take to the streets against Trump … and I get blamed for it.
The Bush years were hurricane free, so Obama had nothing to do with it. It was Bush’s doing.
Bush’s second term.
Let the wind blow high
Let the wind blow low
Through the streets
In my kilt, I’ll go
All the lassies say hello
Donald, where’s your troosers?
You are correct. Someone will say that because Trump withdrew the US from the Paris Accords that he caused the hurricane. Just wait for it.
“In 1886, Texas was hit by four hurricanes, including two major hurricanes”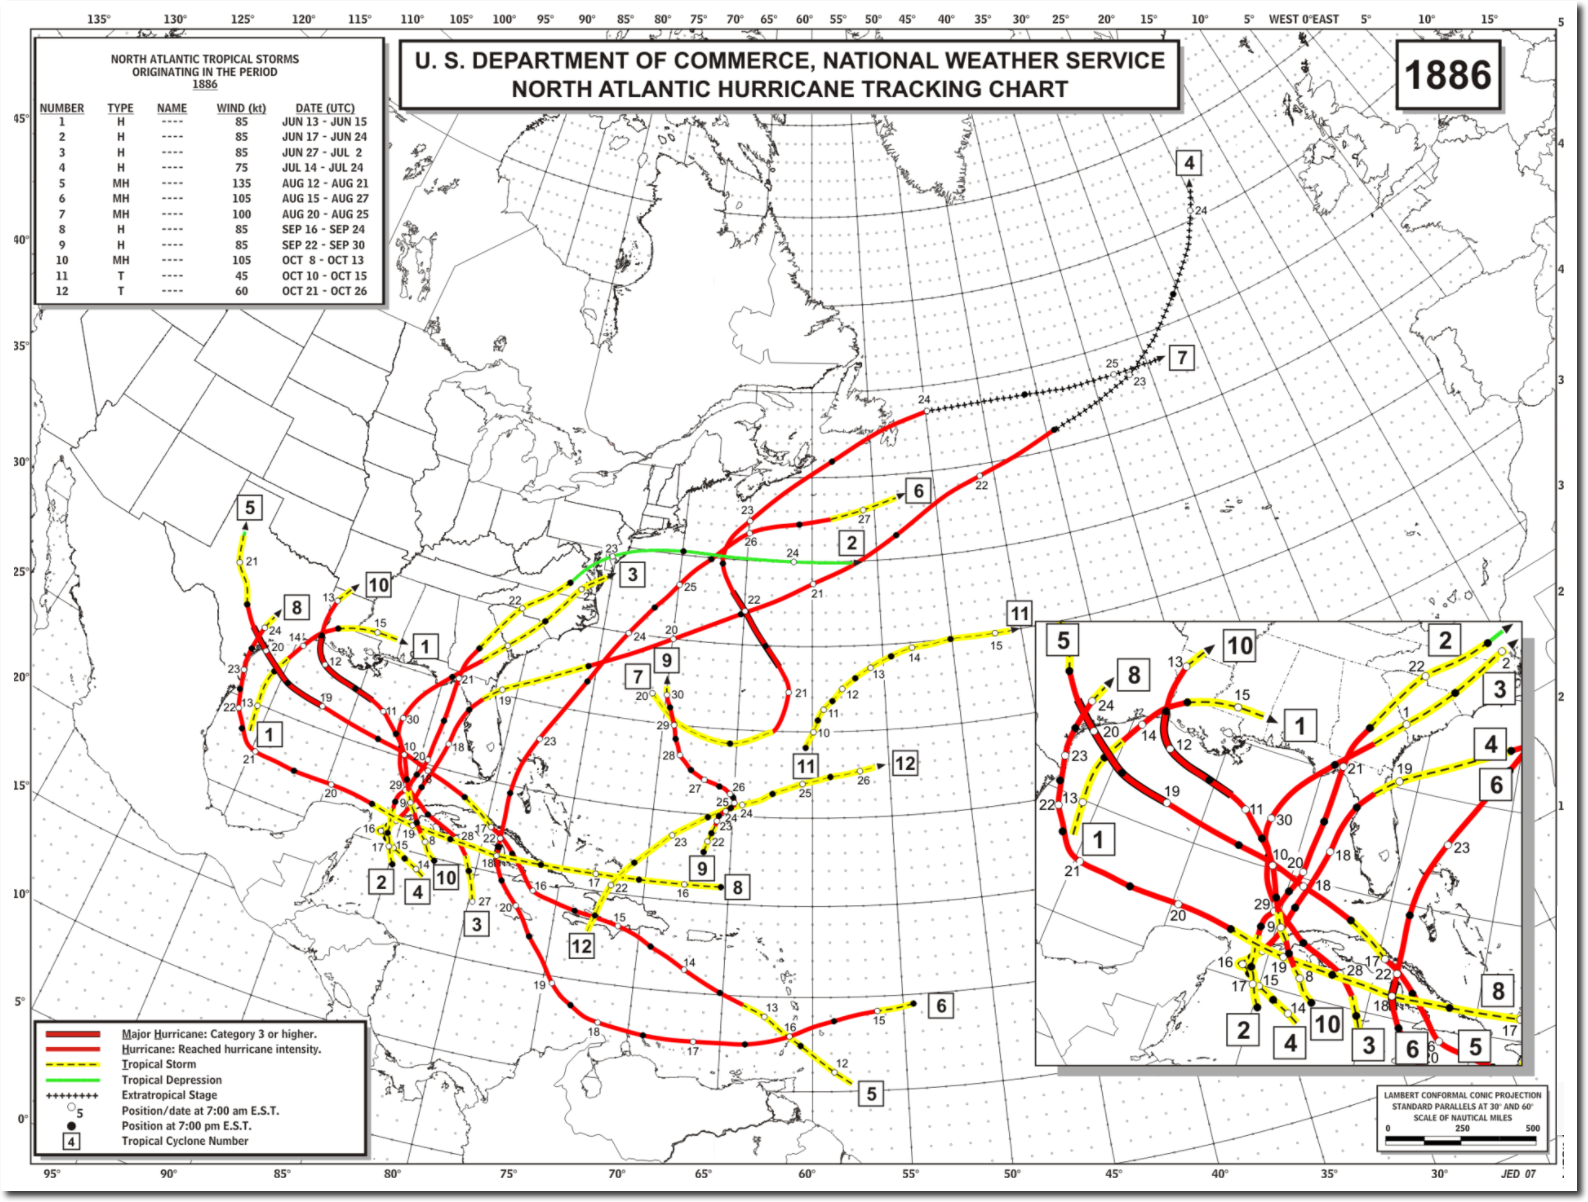
https://realclimatescience.com/2017/08/first-texas-hurricane-for-nine-years/
“In 1886, Texas was hit by four hurricanes, including two major hurricanes”
https://realclimatescience.com/2017/08/first-texas-hurricane-for-nine-years/
Finally! Global Warming is now proven beyond any doubt. Whew, that was a close one!
DAMN!
They finally got 1% of their projections right.
We’ll never here the end of it.
PS Prayers for those in Harvey’s path.
actually no….a couple of days ago they were predicting it would fizzle out
Joe Bastardi has been correct so far.
Technically, they may have had reason to predict in the direction of “fizzling out” since for 12 years hurricanes did change course or fizzle out. It’s what one would tend to predict when a straight trend line is used. The past cannot predict the future, but people just don’t get that.
Sheri…their reason was because their most trusted models said it would
Actually a couple of days ago it had ‘fizzled out’ and they were predicting that it would it would redevelop:
“Ex-Harvey Poised to Threaten Texas
Dr. Jeff Masters · August 22, 2017, 1:56 PM
Above: The remains of Harvey as seen by the GOES-16 satellite at 9:15 am EDT Tuesday, August 22, 2017. Image credit: NOAA/CIRA/RAMMB. NOAA’s GOES-16 satellite has not been declared operational and its data are preliminary and undergoing testing.
All eyes are on the hurricane-friendly waters of the Gulf of Mexico’s Bay of Campeche, where the remains of Tropical Storm Harvey are expected to organize into a tropical storm or hurricane that will threaten Texas and Mexico late this week.”
Phil, don’t quote Masters….when you know I wasn’t
” Who are “they”? Can you show us these predictions? Dr Masters says “all eyes” were on the hurricane friendly waters. That suggests a common expectation that it would re-establish, but it would be good to see the predictions of fizzling out so we can see for ourselves.
I just visited the Weather Underground website, and they are calling Harvey a CAT 6, most dangerous since 47 years ago. Wasn’t that before Global Warming? Masters is really trying to scare people.
Cat 6? 1000baseT?
yeah, wind speed 10x faster than CAT5.
No harm in exaggerating at bit : WOLF , WOLF , WOLF !!!!
By that measure, about the only place in the solar system where one would find a legitimate CAT6 is called Neptune.
Dr. Ed,
Point well taken.
What Warmunistas fail to recognize is that the colder a planet, the higher its wind speeds.
Neptune? How about Jupiter?
Yet Intellicast shows wind speeds around 80 MPH. So does the latest image in the Earth.Nullschool satellite model.
Link please? I visit Weather Underground quite often and nowhere do I see a reference to “CAT 6.”
Cat 6 is the name of a Weather Underground blog, chosen as a name 1 step above the top end of the Saffir-Simpson hurricane scale.
So they were NOT calling Harvey a CAT 6, as stated above. Let’s be careful with our information, folks.
The MSM have been getting ready for this – how to report it without mentioning the hurricane drought. So the narrative is: Very few landfall hurricanes are cat 3+ (implication – this is a big one thanks to AGW); This is the strongest in 12 years (implication – AGW is making hurricanes stronger); etc, etc. They have no shame.
Hey, they’ve had ten years to write the article, they have got the wording perfect now, just leaving a dotted line for the name.
sst in the area is warmer than normal.
Is it?
Gulf of Mexico looks normal to cool to me:
http://www.maineharbors.com/weather/seatemp4.htm
Especially off the south Texas coast.
Here’s the anomaly image from Nullschool, slightly above normal along the TX coast and slightly below west of the Yucatan.
https://earth.nullschool.net/#current/ocean/surface/currents/overlay=sea_surface_temp_anomaly/orthographic=-99.94,21.03,522
Pop,
Thanks. So at the moment it does appear to be above slightly warmer than “normal” water.
Too funny gloatus. lloks like your eyeballing is not the BEST way to do things.
funny that you trust nullschool.
1.3C Warmer than it is normally at this time of the year.
Ideally WE wont subsizing the the rebuilding of the area..
Folk have been warned.
1. The area is prone to flood risk
2. The best science says that risk will INCREASE not decrease in the future.
3. Folks who choose to live in risky areas should do so at their own peril and not depend on bailouts
simply because they choose to doubt the science.
But far below normal in most of the arctic? I guess we aren’t going to go ice free like you said could happen in 2012, yet again.
Huh?
Ice free in 2012?
I read Ar5.. more like 2040-2060
Yeah, mosh, just like all those dopey people who live in san fran should do so at their own peril and not expect bailouts when the next big one hits…
Misuse of “normal” again! Normal means conforming to an established norm, such as 98.6F for human body temperature while alive, or 20/20 vision. Such norms are established by long-term observations and are specific figures, not averages. For humans, deviations of two or three degrees above or below 98.6 are cause for concern; deviations of ten degrees are cause of death.
Sea surface temperature has no norm. It has a history, known or not; it has mean or average temperature for a specific time period and location; it has fluctuations from minute to minute, hour to hour, day to night, season to season, year to year, etc. No norm. Perhaps SST is slightly above some long-term average for the site and the date; perhaps not; perhaps there is a cause/effect relation between above-average SST and wind speed; perhaps not. Surely there are other areas in the world’s oceans that are currently showing fluctuations above the long-term average for the site and the date. Why are no Cat-4 hurricanes occurring at all those places?
and never mind, mosh, that your dopey agw theory has demonstrated weaker u.s. storms for twelve years now. (too funny)…
Sea water is warmed by radiation and cooled by convection. Convection gives energy to storms. A cooling planet would therefore have stronger storms.
http://www.ospo.noaa.gov/data/sst/anomaly/2017/anoma.8.24.2017.gif
Define “normal”.
Steven Mosher- if you’re trying to make a point, it would be nice if you’d state it directly instead of your snarky little comments.
Are you trying to blame Harvey on human activity? There is NO measurable connection between hurricanes and human activity. To imply that Hurricane Harvey is “our fault” is no better than Pat Robertson saying it’s “God’s punishment.” Even worse is to tell people we know how to prevent or control hurricanes. Absolutely false. That’s beyond misleading- it’s FRAUD.
We need to throw all of the confederate statuary into the volcano to appease the hurricane gods. Pronto!
“2. The best science says that risk will INCREASE not decrease in the future.”
You guys keep saying that but there is no “increase’. Where’s the increase?
http://www.ospo.noaa.gov/data/sst/contour/gulfmex.c.gif
@ur momisugly Mike Jonas
Here you go, from the BBC:
“Greg Abbott has asked for more federal aid to cope with the storm, which may be the worst to hit the US in 12 years.”
Almost perfect prediction but you forgot the “may” which implies they’re searching through the last 12 years of almost-as-bad hurricanes to see if this one just about tops them all.
“be the worst to hit the US in 12 years”
I heard the exact phrase in German television yesterday. Pure propaganda since they didn’t say “be worse than the previous one 12 years ago.”
The Weather Channel has stated on TV earlier today, that the LAST Category 3+ Hurricane making landfall was Wilma back in 2005. They say the Category 3+ Drought might end today.
TWELVE YEARS ago!
Mike, they must have plenty of shame (seeing how they never use any of it… ☺)
So far, ABC (USA’s) has been saying there has not been a major hurricane hit the USA in over a decade. Not a specific number, granted, but considerably more honest than I would have expected.
4324 days
Don’t expect to hear that bit of trivia in news. Gotta maintain the narritive.
Does this mean Al Gore can restart his apocalypse clock … & we can all be scared again ??
I do miss that,
these days when I want to be scared I have to look in the mirror.
One thunderstorm does not end a drought…
…and one hurricane does not either
“The 1886 Indianola Hurricane destroyed the town of Indianola, Texas and as such had a significant impact on the history and economic development of Texas.[1] It was the fifth hurricane of the 1886 Atlantic hurricane season and one of the most intense hurricanes ever to hit the United States”
and it was a cat 4.
…and measured how?
MSM/ABC in Australia is already marketing this as the largest hurricane to ever hit Texas and will leave huge areas of Texas uninhabitable. Soon it will be touted as the biggest in recorded history and category 6 at least. It is all exactly as they predicted and it is all Trump’s fault for leaving the Paris agreement. Send money now…… Ho Hum.
I hope you’re kidding. I fear you’re not.
I’m just waiting for the MSM to label the affected Texans as “Climate Refugees” it’s certain to happen
11pm news(ABC australia) they stated it was 4 when it hit land but in an amazingly short time? its now a 1 and a tropical storm
I was afraid my grandkids wouldn’t know what a hurricane is. Thought maybe CAGCC might have been real and ended strong hurricane landfalls in the US forever. Looks like at least this weather phenomena is back to normal. Hope all those in Harvey’s path make it through OK.
It is obvious that while Harvey is right on the edge of Cat/Cat 3 that the media will push it over into Cat 3 regardless of the data. The double eyewall condition is not stable and contact with land may just collapse the structure. Still a lot of rain and flooding and dangerous but watch the MSM for impact inflation.
Personally I am looking forward to the YouTube channel of Texas storm fails. Aka “Deep? Hah. Hold my beer and watch this.”
Dawg: by the accepted definitions of hurricane categories (10-meter altitude sustained wind, as in Wikipedia and other obvious places), data show Harvey to barely be Cat2, if you squint and look at it sideways.
Observing sites report sustained winds using a 2-minute average. For some reason the hurricane folks use a 1-minute average for sustained wind. Thus, it’s not entirely accurate to determine hurricane category from surface observations, the latter will always come in lower by definition.
Hurricane Cat-5 Bill Nye is spinning up to sue Disney and a “gravy train” of others for “non-payments of profits et al.”!
Maybe he has second thoughts about the $3 Million he sunk into the new “Solar” start-up “company” (no business no product no shit) in San Jose.
Ha ha
He should have gone to the beach far enough north of Rockport to be in the eyewall on the windward side to report on how terrible it was and how it was mans fault.
OMG. That means it’s increasing rapidly! 🙂
Global warming catastrophic prediction hiatus over I guess?
My prediction for the next five years: cooler temps, more Arctic sea ice , more N Atl ACE.
But how will that affect the fishing???
Jones, those never go into hiatus, just just move the thimble around to pick on whatever the latest in bad weather is when making their (failed) catastrophic predictions
God has a sense of humor. Al Gore raised the spectre of Hurricane Armegeddon, and God followed up with a decade of Hurricane Drought. Classic.
The nice thing about a “drought” is that then next will constitute a “massive increase”.
moste likely something has to “compensate to make the “average”
Actually the average for Atlantic hurricane numbers and intensity since 2005 has been running pretty much right along the historical record mean. It’s the lack of them hitting the lower 48 that has been quite unusual.
If the Hurricane Hunter planes say is now Cat 3, probably is. If it stalls like Joe Bastardi at WeatherBell and increasingly the NHC says, is NOT good. This could become another Katrina flooding disaster. Spun many ways. But no matter how spun, still a genuine disaster. Lets hope the vulnerable have evacuated.
many will stay. who believes in models.
nasa lies about windspeed. flood? water is essential to life.
Yes many, like DeGrasse Tyson, cannot tell the difference between the science of 24h weather forecasts and politics of 100 y climate models.
Certainly appreciate your astute pre-emptive attempt to blame any deaths due to this storm on climate sceptics though.
Of course, with Katrina, many stayed because they told to evacuate too many times for storms that fizzled. So it cuts both ways.
Were told
…hitting an all new low
look at all the benefits of water!!
SM, do not appreciate your sarcasm. I was stating a simple hurricane hunter fact, not generally accepted by many skeptics here–perhaps for good reason.
What you did not know is that my father, buried at Arlington with the second (peacetime) neck order and a 21 gun salute, was commander of the 409th typhoon chasers back in 1948-1950. His contributions (including an Air Force patent in his name) and personal observations from command piloting converted B-29s into Pacific typhoons with early drop sondes are the stuff upon which NHC is built today, I absorbed it all at the dinner table. You got nothing except bile.
Mosh hasn’t even been keeping up with this…he’s just mouthing off
…those same models they relied on a few days ago to predict it would fizzle out….those models
ristvan August 25, 2017 at 5:12 pm
Mosh’s problem is that he is only playing a scientist on media. BEST lists him as a scientist, but since he doesn’t practice the scientific method, he isn’t one.
He’s an English undergrad with a brief “career” in marketing, which in CACAland makes one a scientist, if you have embraced the consensus and joined the Borg.
SM only has sarcasm it seems.
With Katrina I waited until Sunday AM to leave due to having
evacuated so many times when the hurricane changed its path
and not much happened in the city. I was supposed to start
teaching at my university the next day and two of my kids were
having the first day of class for their senior and freshman years
in high school and were vehement about not leaving for a false
alarm.
Since Katrina hit on the other side of Florida, it seemed natural to
think it would slow down and dissipate once it hit land or at least
be less powerful. Instead, it crossed Florida into the Gulf and at
least the way I remember it, went from a Cat. 1 to a Cat. 5 overnight
and was projected to land near N.O. 24 hours later. So, that was a
big reason people waited – it hit on the Atlantic side of Florida first.
Later, they realized it had crossed a super-heated patch of water
that allowed it to intensify so rapidly.
It’s certainly NOT the people’s fault for rebuilding in an area that has been decimated so many times before by storms of this magnitude, or rebuilding to the same standards that allowed similar damages as prior storms.
My suggestion would be to either allow nature to keep the islands as a buffer zone and/or rebuild the areas to withstand these storms.
Those that have not got out of the way will “evacuate” when it hits.
At the moment the moon is in half moon phase, so neap tides. That will help a bit.
If it stalls…
I hate to say it…but it looks that way
A century ago my family vacationed in Rockport, my wife graduated from highschool there, and we currently live and evacuated from there in the late morning of the day it struck. I have been in and run from several hurricanes since 1960, including Celia (1970). Recently I went to a talk at the Rockport Historical Society about the damage Celia did to the Jackson Seafood Company. This time it will be to the sports fishing industry and all those trailers we knew were temporary. We were going to stay in a probable secure place, apparently still so, with daughter and son-in-law but made the decision with others to leave for Austin where I write this high above the hill overlooking the city with quite a wind outside. Part of the reason for leaving was the information provided by the brave hurricane intruding fliers.
Will let you know in a week or so how it should be classified, to the nearest decimal.
NHC update at 1800 CDT reports Harvey is up to Cat 4.
Which brings a genuine question from me.
Per Update 22: “flight-level winds of 129 kt and SFMR winds to 102 kt. Based on these data, Harvey’s maximum surface winds are estimated to be 110 kt”
So, is the things category based off of any measured winds no matter what elevation?
I keep asking that. Pre satellite recordings were wind speeds recorded on the ground, and or in flights, and if in flights at what elevation.
There are three issues concerning wind uncertainty. 1. The SS scsle is defined by sustained 1 minute winds. What about gusts? 2. Altitude. Hurricane hunters must remsin far above the turbulent deck ( whether 2.5 or 10 meters), so project slower winds down toward surface based on friction. Inherent observational uncertainty. 3. Storm organization can rapidly change, for example eith eye wall replacement. So this hour is not ewual to next hour.
I see ‘cat 3’ less a precise measurement and more a meteorologist informed judgement. No hyped conspiracy, just a tough call. And, like with tornados, verifiable after the fact from wind damage. Hence my conclusion that 2916 Hermine was a TS and not a Cat 1.
No, hurricane winds are 1 minute sustained surface winds, measured with anemometers. Anemometer height of 10 meters above site elevation is by the book, but most stations don’t follow the book.
I do know that they use a generalized wind profile to convert flight level winds to surface winds, but I don’t know what the criteria is for calling it a specific category. Any observed winds or just surface winds.
http://www.nhc.noaa.gov/aboutwindprofile.shtml
Lurking: no. The wind speed has to be sustained for a minute, and has to be at 10 meters.
A quarter mile up is irrelevant. The wind is always fast way above us. But, up there, there is no aluminum siding to fly through your windows. So, 10 meters it is; yes, about two stories up, where things are relevant to us on planet earth.
Ok, so I assume 50s and 60s recorded sustained wind records were land based 10 m readings.
If this is so the same criterion should be followed. Measuring via guestimating from flight elevation appears problamatic, as every surface produces disparate friction.
So the combination of land based readings, which may not catch the maximum, and visible damage post the hurricane may give you s ballpark on wind speed.
It would appear likely that earlier storms had a greater chance of missing peak winds.
https://earth.nullschool.net/#current/wind/surface/level/overlay=temp/orthographic=-58.43,26.36,777/loc=-96.867,27.867
54mph is the highest surface wind i could get the cursor to find right now
thats nasty but bearable?
the rains the big trouble id guess.
Just noting that the new Goes16 satellite has been “operational” for the past month.
Much higher resolution. Eyewall is bigger now (signalling some weakening) but it is more defined. Outer-banks landfall in a few minutes. Moved a little east now, so Corpus Christi misses the more damaging east-side winds.
https://weather.msfc.nasa.gov/goes/abi/goesEastfullDiskband02.html
Let’s see how all those wind farms in South Texas handle this…
I thought the highest concentration of them was in the panhandle in the north.
Plenty around Sinton TX, just a few miles west of landfall.
Joe Bastardi at Weatherbell called Harvey a Cat 3 this afternoon and said that it will weaken and loop back out to sea, travel up the coast and then hit Northeast on the Texas coast later this week, after strengthening into a Cat 3 again.