WUWT readers may recall that on June 4th, 2015, WUWT published a scathing criticism of the paper by Karl et al (“Possible artifacts of data biases in the recent global surface warming hiatus”) that purported to erase the pause in the surface temperature record by applying some highly questionable, and apparently desperate adjustments to SST data. I still stand by this initial critical work of Bob Tisdale and I: NOAA/NCDC’s new ‘pause-buster’ paper: a laughable attempt to create warming by adjusting past data.
![animation-2[1]](https://wattsupwiththat.files.wordpress.com/2015/10/animation-21.gif)
It seems that other climate scientists on the “proponent” side have taken note of this chicanery.
Andrew Montford writes at Bishop Hill:
The US CLIVAR project publishes a newsletter/cum journal, a recent issue of which was dedicated to the hiatus in global warming. Featuring papers from a variety of well-known climatologists, I was interested to see the headline article, from Gerald Meehl, which seems to take a fairly hefty pot-shot at the data tweaking approach adopted by many climatologists.
There have been recent claims that the early-2000s hiatus…was an artifact of problematic sea surface temperature (SST) data (Karl et al. 2015), lack of Arctic data (Cowtan and Way 2014), or both. Such claims indicate that when corrections are made to SST data, by taking into account various measurement methods that introduce biases in the data, then “there was no ‘hiatus’ in temperature rise…[and] a presumed pause in the rise of Earth’s average global surface temperature might never have happened” (Wendel 2015). Often there are issues with observed data that need adjusting – in this case such claims of “no hiatus” are artifacts of questionable interpretation of decadal timescale variability and externally forced response – not problems with the data. Thus, the hiatus is symptomatic of the much broader and very compelling problem of decadal timescale variability of the climate system.
Whether Meehl is any more correct than Karl is anyone’s guess though.
And there were others, previously:
Climate scientists criticize government paper (Karl et al. 2015) that erases ‘pause’ in warming
WUWT was also critical of the adjustments applied by Cowtan and Way in this article:
Cowtan and Way’s ‘pausebuster’, still flat compared to models
as was Dr. Judith Curry:
Curry on the Cowtan & Way ‘pausebuster’: ‘Is there anything useful [in it]?”
It bears repeating that any metric that purports to give the temperature of Earth, be it shonky surface data or indirect satellite microwave emission measurement is a statistical construct full of choices made by the authors. Users of such data tend to think of these as absolute measurements rather than the estimates with wide error bands that they actually are.
Some, are more uncertain than others. When you get fun results like this…
…one wonders if the surface temperature record is now so uncertain that it is essentially little more than a political tool with most of the science adjusted out of it.
The native uncertainties seem bad enough for me, the political aspect is in no doubt.
The wonders of modern statistical science, I mean Climatology, is that a trend is detected, broadcast as Doom, Repent or we all die.
But that trend is less than the mark 1 eyeball error in the temperature data.
So in Climatology the noise is the signal and the data is error bar free.
Chiefio is pondering crowd sourcing a project to find the natural trends from individual stations.
Anyone have useful ideas as to how to raise a living wage for him while he digs.
His proposed project, as I understand it, is right on topic with this ‘Pause” fiasco.
My background was electronics and some audio, the official Team ™ UN.IPCC temperature trends are not significantly different to the noise that plagues both.
You mean long term records like this for individual stations – I just keep wondering where the warming is? Some sites show average warming but usually it is due to LESS cold. This is 125 years of no warming in Southern Alberta at a single Environment Canada station. The area is basically a high plains desert that depends on irrigation for crops or 35 to 50 acres per Animal Unit on the prairie grass.
(Sorry for the unrotated graphics, need to redo them):
https://www.dropbox.com/s/8v1li6mdh9s5hk9/MedicineHatMeans.pdf?dl=0
https://www.dropbox.com/s/3gs335ogtx4mfb4/MedicineHatExtremes.pdf?dl=0
Last year I attended a panel discussion on presumed global warming. The meteorologist from Wright-Patterson AFB (Dayton, OH) presented a graphic showing the high and low temperatures for the last 50 years. I have not had an opportunity to look at the data in detail. However, at first blush, there was no obvious trend in either the high or low temp’s — the time sequences seemed essentially flat. The air base is unique compared to most civilian airports because it has not experienced urban encroachment. It might be interesting to compare the temperature records of similar military bases where they have been isolated from urban build-up. Similarly, small airports and towns in the central and western US might make good candidates to compare with growing cities to better estimate the impact of the Urban Heat Island effect on historical temperatures.
Apologies for crashing the first comment…but does anyone know how to share these GIF thingies?
If the gif is already on some other web page, you can just copy the image URL and paste it into your comment. Otherwise, you must first upload the image to some hosting service such as postimage.org. This will give you an URL that you can use in your comment.
I observed this, myself, several years ago, when Wolfram Alpha first came out. They have a blank space and you are supposed to be able to enter any question and get an answer.
So, enter something like “average temperature Biloxi last 60 years” and it will give a display. The result URL will look like this:
http://www.wolframalpha.com/input/?i=average+temperature+Biloxi+last+60+years
Go ahead and try all of the diverse places on the planet you have visited and heard about. I have not yet found an individual place with a hockey stick anywhere. All I get is a “carpenter’s dream.”
Go on. Try.
I tried it with several locations in Wisconsin, and there’s always a dotted-line gap between 1965 and 1973. WUWT? (sorry…)
I tried it for Milwaukee, WI between 1965 and 1972 – it says “no data available.” I wonder where they get their temperature data.
John,
I’m a programmer. I wouldn’t mind lending some of my time to such a project if I can be of help
Those are some emphatic blue words at the end of the post.
yep
Tampering with the surface temperature records is immediately apparent if one plots NH and SH products in, e.g. HADCRUT4:
http://i1136.photobucket.com/albums/n488/Bartemis/compare_zpsy26aluuy.png
For almost all of the record, SH and NH move in lockstep. Then, suddenly at the latest turn of the century, NH diverges from SH. SH stays true to the satellite data, independently confirming that the NH in particular has been corrupted to sustain the warming meme.
Who tampered exactly what? Yes, the above graph looks untrue – why would NH suddenly warm much more? But really Antarctic sea ice has not been melting away, Arctic ice did shrink a lot between 1980 and 2005.
So there is a difference. But where exactly it is?
Who tampered exactly what?
https://stevengoddard.wordpress.com/2014/08/12/what-part-of-this-isnt-clear-3/
Just look at the other parts and search there, Steven has a lot of nice visuals.
from steve’s site. giss = data corruption ?
?
I would expect them to warm differently. There is more land in the NH and more ocean in the SH; the land has warmed more than the ocean. Just compare global data sets to land data sets.
Oh, and BTW, Nick Stokes site has a nice gizmo up that allows you to compare any number of data sets to the old Hansen models from when, maybe the 90s? Fun.
Then, why didn’t they do so for the first 120 years?
To Bart:
??
SH:NH? Because there was not much change then. In that case you would not expect a difference. It’s only when GW was pushing up temps that you would expect differences. And that is what you see.
The same happened during the Ice Age. All the variability was in the northern hemisphere (green) not the southern hemisphere (blue).
http://s18.postimg.org/4awjdwew9/New_Neem_Temps_vs_NGRIP_Antarctica.png
trafamadore October 27, 2015 at 6:20 pm
“Because there was not much change then.”
What??? Nonsense. There’s plenty of change in the early part of the 20th century. Just as much as in the latter.
ralfellis October 28, 2015 at 1:48 am
Oh, please…
No, you look at it the wrong way. The record from the late 60s, early 70s on till today is the part that shows the correct relationship between the hemispheres. The NH warms (and cools) at about twice the rate of the SH:
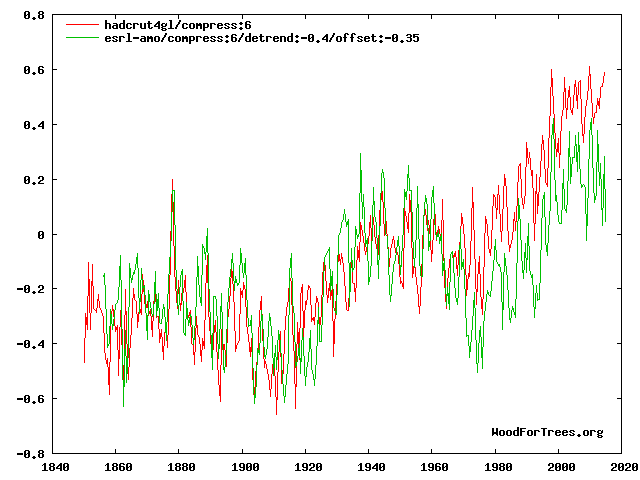

This makes perfect sense, considering the strong AMO/PDO influence in the North – there are no oceanic ‘cyclical’ modes of similar amplitude as these in the South. The stupidity lies in the fact that despite this clear pattern over the last 45-50 years, the data-inventors (yes, they really did invent the southern data prior to the 70s) still chose to assume that the SSTa of the two hemispheres track each other more or less in lock-step. End result: Total warming of the global ocean surface since the early 20th century is vastly overstated; bear in mind that the ocean south of the equator is much larger in area than the ocean north of the equator. So just artificially double the overall warming down south and what do you get?
But there’s more, of course:
Watch how global temps (land + sea) track the North Atlantic SSTa (trended AMO) to near perfection both between the 1850s to the 1960s and from ~1970 till today, only for some odd reason with a huge step change all of a sudden separating the two in the latter half of the 60s, just at the time when Mann’s “divergence problem” arises.
If global temps so clearly and tightly track trended AMO from 1970 till today (we know this to be a peculiar fact), why on earth wouldn’t they do so across the 60s as well? Has anyone ever explained that step change by any physical process or event that happened during that time? Of course not. Because there is no such physical process or event …
So, what about land vs. sea?
Again we have two different parts of the Earth system claimed to be swinging at similar amplitudes. But only up to the 1970s. Only during the most recent warming period (from the late 70s to the late 90s) land all of a sudden decided to warm at twice the rate of the ocean. Which again makes sense. Land should warm (and cool) much faster than the ocean. So why does it only post 1970? It makes absolutely no physical sense.
– – –
This is why I only concern myself with temperature data from 1970 onwards. The record prior to this date is made completely worthless by the adjusters and data-inventors. And continues to be so to this day.
Oooohhhhhhh. Oho. Oh.
Reading it wrong!
Yes, unless you spin it the way you want to spin it, it is being “read wrong”?
Bartemis has shown that for a over a century, the two hemispheres matched trends.
And the adjustments break that correlation. The adjustments are bogus.
They are a fiction.
A fraud.
A construct.
Devised for one purpose, and always showing the same thing…warming trend.
You can wave your hands around all you want about ocean cycles.
One thing is for sure…however uncertain past measurements from way back when may be, they are more uncertain out over the oceans that they are over land where people lived and made measurements every day in the same places.
The adjustments are supposed to be a bunch of “corrections”, but the net effect of them all is to make the historical record match the CO2 trend, proving that they are not random, and they are not corrections.
The adjusted data sets are a model of what the modelers want the record to be.
Nothing more.
As such they are worthless, completely worthless… except as a political tool.
I do not think so. Again, the SH data tracks the satellite data very well, while the NH diverges.
The SH data also tracks the CO2 rate of change since 1958 very well.
http://i1136.photobucket.com/albums/n488/Bartemis/temp-CO2-long.jpg_zpsszsfkb5h.png
Menicholas:
You rightly say of average hemispheric and global temperature data
Yes. The following facts are important.
1.
There are no agreed definitions of the hemispheric and global average temperatures.
2.
Each team that provides the data sets of the hemispheric and global average temperatures uses its own unique definitions of the averages.
3.
Each team that provides the data sets of the hemispheric and global average temperatures alters the definitions of the averages it uses almost every month so its reported values for the same historic data change almost every month.
4.
If there were agreed definitions of the hemispheric and global average temperatures then it would not be possible to measure the hemispheric and global average temperatures because there is no possibility of a calibration standard for any of them.
For the reasons I have here stated, the data of hemispheric and global hemispheric and global average temperatures have no physical meaning and, therefore, the only possible use for the data sets of hemispheric and global average temperatures is as political tools.
Richard
+100
The Southern Hemisphere was very sparsely, to say the least, covered with observations. South of 40S one can forget the temperature before the IGY when a large part of East Antarctica got stations. Even then the oceans were very sparsely observed. How one can talk about temperature trends on the SH before the IGY blows the mind.
Well, they do. If you want to wipe out all the data before 1957, then you’ve really got very little to with which to verify the climate sims and, in fact, are suggesting that they have been trained based on made-up data.
RSS and UAH measure something ENTIRELY DIFFERENT
we dont expect them to show differences between NH and SH
Steven Mosher,
If they’re measuring different things, they are certainly converging. Their data reinforces each other.
And of course, both RSS and UAH agree that global warming has essentially stopped.
Sure, Steve. They’re ENTIRELY DIFFERENT. Why would anyone expect any correlation between mid-tropospheric and surface temperatures? That would be like expecting the someone to weigh the same at the top of the Empire State Building as they do on the ground, when we all know gravity is fractionally weaker there.
UAH and RSS match the SH surface data. The NH surface is the odd man out. Why?
Menicholas says, October 27, 2015 at 4:17 pm:
“Oooohhhhhhh. Oho. Oh.
Reading it wrong!
Yes, unless you spin it the way you want to spin it, it is being “read wrong”?”
Did you read my post at all? Or did you only skim the first couple of lines? Try and read it through properly. I’m not your enemy. I’m on your side, if you’ll notice. I’m actually expanding on what Bartemis brings up, providing more examples of the extraordinarily biased habits of the adjusters/data inventors. All I’m saying is that the adjustments and assumptions are being applied to the record before, meaning up to, ~ 1970, not after … Same overall result.
Bartemis says, October 27, 2015 at 5:12 pm:
“I do not think so. Again, the SH data tracks the satellite data very well, while the NH diverges.”
You compared sfc NH and SH vs. tlt global, Bartemis. Not sfc NH and SH vs. tlt NH and SH. Also, the global troposphere is much more strongly influenced by the tropical ocean surface temperature signal than what the global surface (land+sea) is, due to the tight moist convective coupling between the tropical ocean surface and the troposphere above.
There is no mystery here, the NH does indeed warm (and cool) much faster than the SH. For obvious reasons: There is much more land up there; the AMO; the PDO. To mention three. The problem lies rather in the fact that the data inventors/adjusters have erased this physically sound relationship from the record prior to about 1970.
Now thats what I call AGW
Now [b]that’s[/b] funny.
err no.
the polar seesaw has historical precedents.
Simply acknowledging that the polar see-saw exists takes the wind out of the sails of those claiming that Artic ice is gonna disappear. Global ice remains pretty close to its long time average.
And of course Occam’s Razor says that the simplest explanation is most likely the correct one: the planet is still recovering, in fits and starts, from the LIA. That was an exceptionally cold period during the Holocene, so it’s only natural that global T would revert to its long term trend line.
Human CO2 emissions are not needed to explain the natural warming over the past couple of centuries. Natural Holocene variability is fully capable of explaining all global T observations.
“…the polar seesaw has historical precedents….”
So, you are saying you expect SH and NH not to agree, which means you are proclaiming the surface temperature sets prior to, oh, about 1970 to be unreliable?
dbstealey (October 28, 2015 at 10:40 am)
///
Quite so. there is no data set that can withstand the ordinary rigours of scientific scrutiny that casts doubt on the null hypothesis, namely all (significant) changes seen to date are natural in origin.
I consider that man has had some limited impact on a micro climatic, micro regional basis, but since so little of the planet is urbanised/farmed/dammed etc, and given the immense latent heat capacity of the oceans, on a global basis this micro regional effect is so small as to be not detectable by our most sophisticate and accurate measuring devices within the error bounds and limitations of those measuring devices.
Bartemis October 27, 2015 at 10:54 am — You are right to note the late change in the northern hemisphere data. I have determined that there existed another pause in warming (or hiatus) in the eighties and nineties, from 1979 to 1997. It was made to disappear by covering it up with a fake warming called “late twentieth century warming.” I discovered all this while using satellites to do research for my book “What Warming.” Next I discovered that HadCTUT3 was the source of the fake warming. I even put a note about it into the preface of the book. Nothing happened and the fake warming is still shown as part of the official IPCC temperature curve. Later I found out that GISS and NCDC were both co-conspirators with HadCRUT3. All three had their databases treated by the same computer and the computer left its footprints on all three publicly available temperature curves, in exactly the same places. I have reliable information that NASA knew about the lack of warming in 1997 and chose to go ahead. Keep in mind that the boss at NASA then was James Hansen himself. And they keep cheating so that their current global; temperature is already half a degree ahead of the satellites. That is an outrageous manipulation if you consider that the warming for the entire twentieth century was only 0.8 degrees according to Hansen.
The “Pause Busters” are at least smart enough to read a calendar. With the foolishness of Paris looming in December, an attempt to justify the insanity was very predictable – more so than their temperature forecasts.
Lets see how they deal with Sea Level rise in Paris without ANY evidence of acceleration!!!
https://dl.dropboxusercontent.com/u/4219691/InconvenientCO2.pdf
Sorry, actual historical data/observations don’t count; only model “predictions” and data adjustments are to be considered.
BFL: “Sorry, actual historical data/observations don’t count; only model “predictions” and data adjustments are to be considered.”
Precisely so.
Here you go, straight from the horse’s mouth.
“The data doesn’t matter. We’re not basing our recommendations on the data. We’re basing them on the climate models.”
~ Prof. Chris Folland ~ (Hadley Centre for Climate Prediction and Research)
There is no sea in Paris? The rain in Maine falls mainly in the Seine.
Based on similar philosophy skeptics could create a graph showing a declining trend and inverse correlation of CO 2 and temperature. Arbitrary adjustments seem to be used as memory erasers so that real life recollections of climate and weather didn’t exist. The new global warming parallel universe has replaced it. The error bars are so significant in such adjustments that even a warming trend that most skeptics seem to concede may not in fact be true. If you can’t accurately depict the past how can you possibly predict the future.Climate alarmism is the greatest moral dilemma of our time!
Don’t leave out the guys from Stanford with their statistical trick, deciphered here:
https://rclutz.wordpress.com/2015/09/22/pause-deniers-busted/
They are not going to stop until there is penalty for changing the historical temperature trend. Right now, there is only greater and greater rewards for doing so.
It is rather remarkable about how many thousands of meteorologists over the years read 1.5C too high for so many years. All of them in fact. Trudging out every day, rain or shine, blizzard even and they all failed to understand they were reading temperatures too high.
That is what Tom Karl is saying about all those who came before him (and even about himself in the years when he was a brand new meteorologist – he needed new glasses.)
Funny about this huge battle over a few tenths of 1 deg. c…….while the earth greens up and the one thing that cannot be disputed is the huge positive effect on the law of photosynthesis.
I guess plant productivity, crop yields,world food production and other nonsense doesn’t matter…..except when scientists program models to show that warmer temps in the future, project lower crop yields(which is the complete opposite of what’s happened in the real world).
Some how, a large group of people, some scientists that should know better, have come to believe that:
Sunshine +H20 + Minerals +Pollution = O2 + Sugars(food)
If you want to be fair, objective and scientific about the effects of CO2………then don’t just consider one effect..then amplify that effect as much as possible and spin/interpret the effects into worst case scenario’s based on theories that have yet to be verified after decades of real world observations.
Yeah, there has been some modest greenhouse gas warming but take a step back look with your eyes opened wider to see the big picture…… the weather/climate and CO2 levels over the past 3 decades has likely been the best for life on this planet in 1,000 years, since the Medieval Warm Period(that was probably warmer than this in many places)
Why are we fighting so hard to try to show something different?
And ignoring much more important issues like, for instance that 1 billion people in the world are without fresh water(without playing the increased CO2=more droughts crapola)
Any more of that kind of talk Mike, and we will have to review your grant status.
It’s good to see this discourse in the literature, but remember that the real cornerstone of CAGW is accelerating changes due to specious positive feedback mechanisms.
It is hard to find positive feedbacks in Nature. Bt far most feedbacks are negative. That is why we don’t have runaway anything. I have repeatedly asked Climate modeler I know why is the feedback positive and have yet to get a convincing answer.
Meehl’s break with Karl likely has at least two motivations.
First, the paper and its PR have attracted a lot of negative attention. Two of the more important points are increased variance from UAH and RSS, and unreported error bars. On the latter, Karl relies on the Huang revision of SST using a method previously published by Stevenson. Got the same delta 0.1C. But Huang did not report the associated uncertainty. Stevenson did: 0.1C +/- 1.7C! Which is why Stevenson’s paper got no traction, while Huang and Karl did. Fundamental scientific ‘dishonesty’.
Second, Lamar Smith’s Congressional Oversight Committee has started investigating the origins of Karl 2015, and has issued a document retention order including all pertaining emails. It is possible some of the ‘insiders’ know Karl’s paper was motivated by a desire to erase the pause before Paris, rather than a desire to improve the quality of the historical temperature record. In which case putting distance between oneself and the Karl group would be a prudent career move.
A blizzard of bunkum to drive the narrative. Obvious and predictable. Wonder if anyone tracks sheer volumes in publication from suspect sources vs significant political events. That would be interesting.
An association has previously been discovered between number of co-authors of a paper and the likelihood that it is later discovered to be fraudulent. Certainly, spies are always taught to be suspicious of too-convenient timing whenever new information is presented to them.
That association certainly makes sense, the number of Co-authors would have similarities to the “Appeal to Authority Fallacy”. Another factor may be in previous scientific misconduct instances the research data is closely held, often not even other co-authors see the data; which seems similar to what we are seeing in climatology where instead of data, we get data products that have been adjusted in poorly explained and impossible to replicate ways.
Stefan Rahmstorf is probably weighing his options. He surely likes temperature changes brought about by Karl, et. al., but he surely does not like the fact that the modified temperatures result in his model predicting LOWER sea level rise for the 21st century. See…
https://climatesanity.wordpress.com/2015/09/25/uh-oh-karl-et-al-is-bad-news-for-stefan-rahmstorfs-sea-level-rise-rate/
The desperation of the AGW crowd has been evident to those of us who read for years.
I believe that the UN’s WHO”s specious attempt to equate the risk of eating beef
and pork to the cancer risk of smoking is their “jump the shark moment.’
Even my local tv station has an expert saying that their “study” is flawed, so the
“low information” voter can see that WHO is trying to make them vegetarians.
Jerry – Not only compared to smoking, but they equated consumption to asbestos exposure as well. By these criteria, evry human should have colo-rectal cnacer…
MCR
The story.
https://www.google.com/url?sa=t&rct=j&q=&esrc=s&source=web&cd=7&cad=rja&uact=8&ved=0CDkQFjAGahUKEwjUk4OMsePIAhVH0WMKHYIsDok&url=http%3A%2F%2Fwww.nbcnews.com%2Fhealth%2Fcancer%2Fdo-i-have-stop-eating-processed-meat-key-questions-about-n451451&usg=AFQjCNE5R9LQcjZFyCTie86gh0iLJkzywg
Like Mann’s “Nature Trick”, this has the potential to become a nice robust pinata to bash for years to come. It seems the CAGW liars are equally aware of the propaganda potential here and they themselves may be attempting to snuff it out in its crib. I hope not. Extremism on their part make them seem extreme to the common man.
Trouble is, there’s never any candy inside for us.
The choice weasel word being “possible”.
He has covered himself.
Although, he has covered himself not in glory, but in shit.
Are all Karl et al papers going to be introduced with the prefix – “possible”?
New from Karl et al: (sarc)
Possible locations where we should comb the seabed for MH370, Possible reasonable explanations for why I smelt of perfume when I arrived home after staying late at the office, Possible sources of unidirectional, cumulative and irreversible bias in the presentation of historical climate reconstructions, Possible justifications for unscientific behaviour which circulate through the mind of climate scientists hence allowing them to appease their troubled conscience…
All possible, in some cooked up fantasy world of delusions.
Not likely. Not probable. Not even plausible – but possible.
Buy a lottery ticket tomorrow and you will possibly be the winner…
It’s definitely possible.
Amongst other possible outcomes…
In this nonsense of post facto adjustment of real data, does anyone spare a thought for the genuine people who took the measurements at the time.?
As one who read the instruments at the time I feel disgust at the attempts of so called scientists changing things just to fit a 120 yr old hypothesis by a Swedish scientist which has has failed the test of accuracy by any reasonable measurement.
For the record, I can assure the self appointed climatologists that we did not get it wrong, particularly when we were providing information to fueled up aircraft sitting at the end of a runway on a war footing
“does anyone spare a thought for the genuine people who took the measurements at the time.?”
I used to at every opportunity.
It got little or no traction.
I share your disgust Bob.
I often spare a thought for the bucket haulers.
And sometimes I picture them playing cards in a comfy warm cabin, in a rolling swell, rain and spray running down the windows, not bothering to go outside and take another dumb SST measurement.
After all, really measuring stuff is a bit of a waste of time. Who wants to be homogenized and then adjusted downwards? Or to have contributed to an inconvenient decadal blip (later removed).
Let’s also spare a thought for those neglected Argo floats.
Up and down, faithfully sampling and transmitting – only to be sidelined and basically ignored as a result of the inconvenient lack of warming which their dutiful performance has revealed.
“No, Argo. Naughty Argo. What are you? Yes…very bad.
Now, go and fetch me the missing heat, like a good little bouy.”
While the title mentions Karl, the body also mentions Cowtan and Way which used
In 2013, they would have had UAHversion5.5 or 5.6, but not the latest UAH6.0beta3. As we now know, the latest version greatly increased the pause so UAH now basically agrees with RSS with a global pause of over 18 years.
But there is more. As I pointed out in the article here:
http://wattsupwiththat.com/2015/10/23/polar-puzzle-now-includes-august-data/
the Antarctic has basically had a zero trend from 1979. However https://kenskingdom.wordpress.com/ shows that even the north polar region has a negative trend for 13 years and 7 months. So if Cowtan and Way were to do their work over again with UAH6.0 data, things may look different.
“I still stand by this initial critical work of Bob Tisdale and I”
It should be “Bob Tisdale and mine” not “I”. It being the object of the preposition “of” changes the case from I to me (which gets changed to “mine” for some reason my memory doesn’t recall at the moment. Sorry to be pedantic, but the mangling of this grammatical construction has become rampant. A correction in a post about data adjustments seems apropos. And if I’m wrong about any of this, my excuse is that my 8th grade English class was so long ago that I’ve forgotten some of the drill.
Yes, you’re wrong !!! It’s Tisdale and I because of the word ” this “…
You are right. it is “mine.” It’s easier to see if you write the sentence without “Bob Tisdale” in it.
Correct sentence: “I still stand by this initial critical work of mine.”
Incorrect sentences: “I still stand by this initial critical work of I.” or “I still stand by this initial critical work of me.”
Mine is the possessive form of me. The possessive form is required here, as in “I still stand by this initial critical work of Bob’s.” However, if you change “of” to “by” then you don’t need to use the possessive form, as in: “I still stand by this initial critical work by Bob Tisdale and me.”
Sorry, Gary and Louis, you are both wrong. The commutative conjunction “and” equates the two objects of the preposition “of”. Thus, the correct clause would be either “of Bob Tisdale and [of] me” or “of Bob Tisdale’s and [of] mine”. The second version is preferable because pronouns without added nouns generally use their possessive cases (“my”/”of mine”) …
… except in the vernacular (“You’re not the boss of me!”).
I agree with Gary and Louis.
You have to read it as if each person in the sentence is considered separately.
The announcer on the World Series just said “..have wrote…”. I think we can all agree that is wrong.
Sorry BillK, but according to The Chicago Manual of Style “when two nouns ‘possess’ the same entity, only the second takes an apostrophe (‘).” Examples: “my aunt and uncle’s house” or “Gilbert and Sullivan’s lolanthe.” Only the last noun is possessive. So the correct form is: “I still stand by this initial critical work of Bob Tisdale and mine.”
I take that back. BillK is right. The rule I quoted applies only to nouns that require apostrophes to make them possessive. “Mine” does not use an apostrophe so the rule is different. For example: “The car is Bob’s and mine.”
The correct sentence is: “I still stand by this initial critical work of Bob Tisdale’s and mine.”
Louis,
Only take half of it back. BillK is not entirely right, since “of Tisdale and me” and “of Tisdale’s and mine” do not have the same meaning. A criticism of me is probably not a criticism of mine!
Me or mine. The misuse of I in this manner is very common in the vernacular these days. Grown weary of correcting it. You can’t stop language, you just have to let it go.
Not since the “Golden Days” of the Tobacco Institute has so much data been so tortured fro so long.
The surface temperature record has been so tortured as to now need protection under the United Nations Convention against Torture.
Too late…it already spilled it’s guts.
You were so right to agree with Gary and Louis, but so wrong to put in that apostrophe!
Doh!
Or should I have said:
D’oh!
p-)
If Karl had moved the old data to match Argo, it would not seem so odd. It does not change the slope of the portion changed, but when fit together with the data back to 1950, it has two effects (IIRC). One is to make a fairly continuous slope from 1950 to present. This gets rid of the pause. Maybe Karl got sick of hearing about it. But, as I recall, it also makes the overall change (slope) smaller. Perhaps he is covering his bases this way. The slope is ~0.11 per decade since 1950 – the period of assumed manmade changes. This is only 1.1 C per century, not the 2-3 C from the models.
Correcting more accurate measurements to match less accurate ones is plainly chicanery.
This is true even if one accepts that “adjustments” are a legitimate practice.
For those who do not accept that adjustments are a legitimate practice, it amounts to chicanery on top of illegitimacy.
“It bears repeating that any metric that purports to give the temperature of Earth, be it shonky surface data or indirect satellite microwave emission measurement is a statistical construct full of choices made by the authors. Users of such data tend to think of these as absolute measurements rather than the estimates with wide error bands that they actually are….”
ALL MEASUREMENT is a statitical construct. It all depends upon choices and assumptions made by
the instrument designer, data collector, and data analyst. Even we we choose to use standards, we are making a choice with assumptions. There is no “absolute” measurement.. that is measurement that doesnt involve a choice and an assumption.
When groups make different choices you will get different answers. Its called structural uncertainty.
For example… When NCDC chooses NOT to interpolate land surface data you actually end up with a WARMER estimate for the land surface than all other agencies.
Okay, here are some statistical constructs for you:
* My children know what snow is
* I’ve never met or seen a climate refugee
* My home has not sunk below the ocean
* We still have lots of ice at the poles
* The polar bears are doing fine
* Despite all the global warming, I had to fire up my heating this morning
Not too much structural uncertainty there!
Seems you just admitted that climate scientists are making the whole AGW thing up to fit their pre-conceived narrative. Nice one there Mosh.
“… It all depends upon choices and assumptions made by the instrument designer, data collector, and data analyst.”
Err no
1. ALL measurement involves choice and assumption
2. Climate science and any other science.
3. This has NOTHING to do with narratives.
This is the crux for climate science: the merry confusion of measurement standards/methodology, measurement devices, measurements (data) and interpretations of the measurements/data. Only by confusing these the AGW-team is able to provide “datasets” or “records” that keep being rewritten:
http://realclimatescience.com/2015/10/more-off-scale-fraud-by-nasa/
Only by confusing the public through the use of the term “datasets” and “records” the AGW-team is able to keep up the narrative of global warming when what they actually have is continuously changing interpretations of the data (the measurements). Only by hiding their changing interpretations behind the term “datasets” and “records” they are able to convince politicians of the alarm. Only though this confusion, the AGW-team is able to keep up confusing reality with the computer models that they often use to produce “data” for their “scientific” publications. What a sad state of science, when this is being considered acceptable scientific endeavor. At least, we skeptics could stop accepting the use of the terms “dataset” and “record” when addressing the (ever changing) interpretations of the actual data, the measurements.
This is the crux for climate science: the merry confusion of measurement standards/methodology, measurement devices, measurements (data) and interpretations of the measurements (data). Only by confusing these the AGW-team is able to provide “datasets” or “records” that keep being rewritten:
http://realclimatescience.com/2015/10/more-off-scale-fraud-by-nasa/
Only by confusing the public through the use of the term “datasets” and “records” the AGW-team is able to keep up the narrative of global warming when what they actually have is continuously changing interpretations of the data (the measurements). Only by hiding their changing interpretations behind the term “datasets” and “records” they are able to convince politicians of the alarm. Only though this confusion, the AGW-team is able to keep up confusing reality with the computer models that they often use to produce “data” for their “scientific” publications. What a sad state of science, when this is being considered acceptable scientific endeavor. At least, we skeptics could stop accepting the use of the terms “dataset” and “record” when addressing the (ever changing) interpretations of the actual data, the measurements.
Here chew on this constant
http://arxiv.org/pdf/1504.06604.pdf
Mosher,
OK, I chewed on the gravitational constant and have a question of even greater gravity: Are you suggesting that geophysical measurements such as temperatures, sea level, and pH are not as accurate as is assumed? If so, then how confident can we be that the claimed historical changes are reliable?
“ALL MEASUREMENT is a statistical construct.”
—
That is a useless statement. Weighing out a pound of flour may be subject to experimental error, but it is not a “statistical construct” in any relevant sense. The same goes for an individual measurement of temperature, in one location, at a single point in time. In contrast, the global temperature estimates are indeed statistical constructs – wild extrapolations that don’t deserve anywhere near the same respect as actual experimental data.
That is the problem with all these self-styled “scientists” who know nothing but numbers and computer programs: they have no respect for empirical evidence – they continually blur the line between the evidence and their interpretations of it, and instead of improving their theories when they are contradicted by the data, they “improve” the data, using bullshit arguments like the one you just offered.
+1
+1,000,000
“That is a useless statement. Weighing out a pound of flour may be subject to experimental error, but it is not a “statistical construct” in any relevant sense. ”
1. Weighing a pound of flour would involve a device and a standard.
2. The Choice of device matters. different devices produce a “measurement” in different ways
3. Every device has an underlying physical theory.
4. I make the assumption that my device doesnt change during the actual process of measuring
it’s a safe assumption, but an assumption nonetheless.
5. I make the assumption that standards are constant. Again, a safe assumption, but an assumption nonetheless.
“The same goes for an individual measurement of temperature, in one location, at a single point in time. ”
Not really. Take a LIG thermometer. it doesnt measure temperature. it measures the expansion of liquid.
go look at all the assumptions involved in that.. there are quite a few.
“In contrast, the global temperature estimates are indeed statistical constructs – wild extrapolations that don’t deserve anywhere near the same respect as actual experimental data.”
Err wrong. we judge both based on the same criteria. prediction error
“That is the problem with all these self-styled “scientists” who know nothing but numbers and computer programs: they have no respect for empirical evidence – they continually blur the line between the evidence and their interpretations of it, and instead of improving their theories when they are contradicted by the data, they “improve” the data, using bullshit arguments like the one you just offered.”
Suggest you read two dogmas of empiricism
@Stephen Fisher Mosher
so much confusion, so little tyme …
“Weighing a pound of flour would involve a device and a standard — Every device has an underlying physical theory.”
Yes, we make physical assumptions, although these would typically be independent of the physical theory to be tested by the measurements in question. However, for an individual measurement, we do not need any statistical assumptions.
“Err wrong. We judge both [measurements and statistical constructs/extrapolations] based on the same criteria — prediction error.”
No. Prediction error is the deviation between a prediction and a measurement, so the concept doesn’t apply to measurements in isolation. In case of the global temperature, we have a prediction but no measurement, so the concept doesn’t apply either. When we have both a prediction and a measurement, as well as an unacceptable difference (prediction error) between them, the measurement invalidates the prediction, not the reverse.
“Suggest you read two dogmas of empiricism.” Read it a long time ago. May I suggest in turn Karl Popper “Logic of Scientific Discovery,” or the short version, “Conjectures and Refutations.” Popper discusses the relationship of theories and observations very well.
Steven Mosher writes: “Suggest you read two dogmas of empiricism”.
A good overview but it doesn’t really go as deep as it could. I admit to being an empiricist myself, always have been, and we are thorns in the hindquarters of theorists, (it’s our nature, we also secretly feel a little superior sometimes, which is undeserved.)
There’s what I think is a good explanation of the failures of empiricism in an essay by Nick Bostrom, Professor, Faculty of Philosophy & Oxford Martin School
Director, titled “Anthropic Bias” ( http://www.anthropic-principle.com/ ). It’s worth a read whenever you get to feeling a little more holy than you should 🙂
The biggest mistake is to assume that there in no error in assigning the average of a few thousand unequally spaced temperature measurements, many of which are measured by different instruments with different levels of accuracy, some of which are biased, to an average temperature for the whole globe.
Because each measurement at that location is an intensive property, you can’t average it with other intensive property measurements from OTHER locations and come up with anything meaningful. It doesn’t matter if “it’s all we have” (as I’ve seen Mosh say before), meaningless is meaningless, period.
Jeff,
It sounds like you are arguing that the environmental parameter commonly called the average atmospheric temperature is fundamentally unknowable. I have trouble with that. What if I were an astronomer on another planet and I wanted to know whether the temperatures on Earth are within a habitable range? I might initially estimate the temperature based on the IR spectrum, which would integrate all points radiating, i.e. an average.. If I wanted higher spatial resolution, I might build a more powerful telescope and randomly sample a large number of points to determine the radiating temperatures. To answer the question, “What kinds of temperatures would I actually encounter?”, I might then take an arithmetic mean and assign a probable range of plus or minus one standard deviation. Now, it is possible that I might miss some points like Death Valley in the Summer or Antarctica in the Winter, but allowing for some additional margin of error beyond one standard deviation (e.g. 4 standard deviations), it would probably be possible to build a space ship and space suit to allow me to survive on Earth. Would there be problems with the estimate of the average global temperature? Yes! But would it tell me something about the probable conditions to be encountered? Yes.I might at least reasonably expect most of the mid-latitudes to be free of ice and the water to be below boiling. It seems to me that the important things to be considered are the limitations to a single number characterizing a large, highly-variable planet and what the error bars (seldom reported by AGW advocates) mean. So, are there problems with averaging all reported temperatures? Yes! But, does it provide us with some potentially useful information? Yes! I realize that this is an imperfect analogy, because all useful analogies are imperfect. So, focus on the problem of what it means to have a large number of “intensive property” measurements and how they can be used to better understand the dynamics of the atmosphere.
Steven Mosher: “ALL MEASUREMENT is a statitical [sic] construct.”
Titter! You’re funny!
Getting desperate, are you?
“Steven Mosher
October 27, 2015 at 1:31 pm
ALL MEASUREMENT is a statitical construct. It all depends upon choices and assumptions made by
the instrument designer, data collector, and data analyst. Even we we choose to use standards, we are making a choice with assumptions. There is no “absolute” measurement.. that is measurement that doesnt involve a choice and an assumption.”
What a load of tosh! This maybe true in climate “science”, certainly not in engineering. 2 microns is an absolute measurement I can certify that.
Philosophically the whole concept of measurement depends on underlying assumptions about the nature of the universe in which those measurements are made.
However the point is, and its taken me a long time to appreciate this, knowledge is hierarchical.
We assume propositions and then facts are inherent relative to those propositions.
Measurements can only be made in a universe that has measurable quantities. It is inherent in our (perception of the) world that stuff exists, and dimensions exist, and so on.
And within this world measurements of these qualities in quantitative terms are possible, up to a point.
That these qualities may only be artefacts of our perception is one issue, but if we take these qualities as inherent, it is valid to measure them.
What is not valid, is to play with the idea that these qualities are not inherent to the world, and then use that to disprove the idea of measuring them in a world where they ARE taken to be inherent.,
That’s like taking non euclidean geometry to disprove Euclidean proofs.
So for sure all measurements are in the limit statistical, but that does not invalidate them, used in the ordinary sense.
But how close to 2 microns are you?
No measuring tool is perfect so it depends on the accuracy of the tool you are using.
With an accuracy of plus or minus 0.01 microns if you measure the same little thing again you might get 1.99 or perhaps 2.01 microns.
That might be good enough…..between 1.99 and 2.01 microns might do the job.
With an accuracy of 0.1 microns between 1.9 and 2.1 might be good enough.
If you’ve got an old mercury thermometer you could perhaps measure to 0.5C
If you had ten thermometers measuring temperature the same site what would the range of temperatures be ? What would be the effect of shifting a thermometer 10cm? An increase or decrease of 0.5c? Maybe.
You don’t get that problem with discrete data……there is one meteorologist present, not 1.5 or 1.75 meteorologists. Temperature is continuous so you can measure temperature of 2 degrees or 2.1 degrees or 2.09 or 2.085 etc , all approximating to 2 degrees within whatever your acceptable levels of precision are.
This is why in engineering and on machining, a certain tolerance is always specified.
None of the people that do real things on real life that must be correct or machines will not run and people may die or go out of business…in other words, there will be real consequences.
When a car is assembled, the bolts holding the bumper to the frame may be 3/8 of an inch, or .375 inches, +/- .02.
But the 3/8 bolts holding the cylinder head to the block must be .375, -/+ .0001 inches, or the engine will not last long enough, and may not run properly or even be assemblable.
Attempting to make all the bolts to the same standard will either waste money or produce a crappy car.
Climate scientists pretend all bolts have perfect tolerances when they issue their press releases, but, as seen here, pretend that such things are unknowable when attempting to obfuscate valid criticism.
You are talking mfg tolerances. Yes, plus/minus 1 to 2 thousandths of an inch (Imperial), or microns (Metric). No maker can make things, in numbers, that accurately. Too expensive. Now recall Mosher said ALL MEASUREMENTS. R&D lads use very sensitive devices. I have used devices called comparators that are so sensitive that even the temperature, and thus thermal expansion/contraction, of the item being measured can show up in the measurements results. I too have used slip gauges that too will expand/contract and be inaccurate. That is why these devices are used in highly temperature controlled environments. Mfg tolerances are different to actually measuring something accurately.
And in the 80’s I used to program and operate a milling machine that weighed 8 tonnes. And it was accurate, machining components for disk drives at IBM, to within 2 microns. Digital micrometers are extremely accurate these days.
Steven Mosher:
In your usual manner you state an untruth as though it were fact. It is NOT true that
NO!
ALL MEASUREMENT is comparison with a calibration standard.
The measurement consists of determination of how much larger or smaller the measurement is than the standard. And the measurement may be a direct or an indirect comparison.
Calibration standards varied in times past; e.g. the standard for a ‘yard’ was defined by the length of the arm of whomever made a measurement. Present day measurements are made by comparisons with unique measurement calibration standards.
There is only one Earth and, therefore, there is no possibility of a calibration standard for hemispheric and global average temperatures. In other words, the hemispheric and global average temperatures of the Earth cannot be measured.
The values of hemispheric and global average temperatures of the Earth are inferred from measurements of some local temperatures and it is a falsehood to claim that the inferred values are measurements.
Propagandists attempt to claim that inferred values are akin to measurements that are indirect comparisons with standards. This claim is specious. For example, measurement of differential expansion of mercury and glass is an indirect measurement of temperature change because the thermal expansion coefficients of both the mercury and the glass can be measured and combined to give an indirect calibration of temperature change. But there is no way that calibrations of thermometers at individual sites can be combined to give an indirect calibration of hemispheric or global temperature.
Richard
Richard, I largely agree, although I don’t think the uniqueness of Planet Earth has much to do with anything. It seems to me that the key difference is that between measurements and extrapolations, or, using your more general term, inferred values.
In our approach to understanding the world, we seem to have come full circle. The notion that we could unravel Nature’s secrets through reasoning and speculation alone was powerful from Heraclitus to Hegel. Of course, real progress was made only after this notion was abandoned and empirical observations were given their proper place. One culmination of empirical physical science is the advent of computers – powerful tools for analysis, but also for conjecture that have lured those of speculative mindset back to the world of physical problems. The ascent of computer-aided speculation does real harm to real science.
Michael Palmer:
Thankyou for your response to my reply to Steven Mosher.
We seem to have similar views of these matters so I draw your attention to my earlier comment in this thread which is here.
Richard
Given that the need to impress politicians, and the media,at Paris seems to be driving scientists into questionable and unprofessional practices and the journalists and politicians into calling for savage reprisals on sceptics , why not just call the whole thing off .
Reconvene in , say, 10 years time when there will be unmistakable evidence of change or no-change, the present generation of senior , rather hysterical , climatologists will have been replaced , hopefully , by a younger breed of sober, reflective , think- before -they- speak , men and women , Obama and Hillary will be but memories and the world economy may have recovered to the point where US, UK ,Eu will be able to shoulder the financial burdens if they are still required.
In 10 years at the current slow ( I almost said glacial) pace of climate change we are not likely to be in a significantly worse environmental state than we are at present and we should be in a better financial shape. Hopefully some of the really serious current and potential conflicts in Middle East , East Europe , South China Sea , Sudan , etc might have been resolved – not least by the worlds leaders concentrating on issues where people are being slaughtered hourly rather than environmental issues which , whilst real , have, at present, a far less fatal effect.
+1000
Alas, the panic-merchants would never allow it. Way too sensible. A ten year break (I almost said hiatus) from all the fear-mongering doom-and-gloom panic-mode roller coaster they have us on now would lead to the opportunity for quiet reflection. People might think. People might learn. The truth might come out.
No, they need to keep the populace stampeding towards the cliff’s edge. That is if they can get the stampede started. The politicians might be all aboard, but the crowds are less impressed than they used to be.
The useful tools that are “funded climate scientists” won’t wake up until the money stops. All those with integrity already got off the bandwagon. Those still aboard have a lot of waking up to do – and I wouldn’t be in their shoes for anything.
Mr. Waite,
Someone might have said the same thing ten years ago.
Would the reality of today have borne out the statement made then?
About seven or eight years ago I told a family member that the global-warming alarm thing would be decided either way within ten years. In the scientific sense, I still hold to that view. And it’s not looking good for the warmists.
In the political sense, I was naïve. They will not get what they want in Paris, but they won’t go away either.
In the medium to long term we need to hold the fort and wait until they are distracted by some other cause célèbre.
I had something similar happen about that long ago. I asked a warmist friend what he would say if five or ten years went by and the world did not get any warmer, or actually got colder.
He dismissed the question as ridiculous, refusing to answer but also saying it was impossible that it would not be warmer in five years, and warmer still in ten.
When I bring that up now, he just acts like it never happened, and quotes NASA stats that last year was the warmest evah, and this year is on track to be the new warmest evah.
I do not wish for severe winters, but I am willing to make an exception this year.
I hope that the weather during the Paris dealio is the coldest and snowiest blizzard in five hundred years.
I need a good laugh.
Wherever one looks at, it seems to me that the years 2012 onwards seem to be a bit higher in temperature that the years 2002 etc. Is my eyesight wrong?
No you have very good eyesight. Your ‘eyes’ can detect changes of 1/100th of a degree in the temperature of an entire PLANET. That’s what I call sensitive!
Um..Charles…I think he meant on the graphs !!! But it was still funny as all hell !!!!
One can see from GISS’s own numbers that the recent “pause-buster” changes are unjustified.
http://www.elcore.net/GISTEMP_Overconfidence_Intervals.html
http://www.elcore.net/GISS%20LOTI%20Changes%202007%20to%202015%20ELCore%20small.jpg
I just read through that essay of yours. I would suggest that you offer it to Anthony for publication here, so that may get the broader exposure it deserves.
I agree.
I also agree, although I wonder if it would be much more difficult to include the entire record instead of the 3 20-year periods chosen. As it is, one can see that the 1880-1900 measurements were actually increased by small amounts (0.01-0.05 K), then the 1930s were decreased by large amounts (-0.07 to -0.11), the 40s were back to small increases, and finally the 1994-2013 period was increased by large amounts (0.07-0.11). So the change between the 30s and now was increased by 0.14 to 0.22 K, a very hefty portion of the total 0.8 K warming.
Thanks. I did. Whether Mr. Watts didn’t like it, or I did something wrong, or it got lost in the shuffle, I don’t know….