Last week on September 11th I was the first to call the Arctic Sea Ice minimum.

It seems both NSIDC and NASA Goddard agree with my initial claim.
Dr. Peter Wadhams had famously claimed that Arctic Sea Ice would be completely gone this year, even Gavin said it was ridiculous:
 Clearly he’s been proven wrong.
From NSIDC:
Arctic sea ice cover appears to have reached its minimum extent on September 11, 2015. Sea ice extent on that day was measured at 4.41 million square kilometers (1.70 million square miles). It was the fourth lowest extent recorded since satellites began measuring sea ice in 1979.
Please note that the Arctic sea ice extent number is preliminary—changing winds could still push the ice extent lower. NSIDC will issue a formal announcement at the beginning of October with full analysis of the possible causes behind this year’s ice conditions, particularly interesting aspects of the melt season, the set up going into the winter growth season ahead, and graphics comparing this year to the long-term record.
Source: http://nsidc.org/news/newsroom/2015-arctic-sea-ice-minimum
From NASA/Goddard Space Flight Center
According to a NASA analysis of satellite data, the 2015 Arctic sea ice minimum extent is the fourth lowest on record since observations from space began.

Credits: NASA/Goddard Scientific Visualization Studio
The analysis by NASA and the NASA-supported National Snow and Ice Data Center (NSIDC) at the University of Colorado at Boulder showed the annual minimum extent was 1.70 million square miles (4.41 million square kilometers) on Sept. 11. This year’s minimum is 699,000 square miles (1.81 million square kilometers) lower than the 1981-2010 average.
Arctic sea ice cover, made of frozen seawater that floats on top of the ocean, helps regulate the planet’s temperature by reflecting solar energy back to space. The sea ice cap grows and shrinks cyclically with the seasons. Its minimum summertime extent, which occurs at the end of the melt season, has been decreasing since the late 1970s in response to warming temperatures.
In some recent years, low sea-ice minimum extent has been at least in part exacerbated by meteorological factors, but that was not the case this year.
“This year is the fourth lowest, and yet we haven’t seen any major weather event or persistent weather pattern in the Arctic this summer that helped push the extent lower as often happens,” said Walt Meier, a sea ice scientist with NASA’s Goddard Space Flight Center in Greenbelt, Maryland. “It was a bit warmer in some areas than last year, but it was cooler in other places, too.”
In contrast, the lowest year on record, 2012, saw a powerful August cyclone that fractured the ice cover, accelerating its decline.
The sea ice decline has accelerated since 1996. The 10 lowest minimum extents in the satellite record have occurred in the last 11 years. The 2014 minimum was 1.94 million square miles (5.03 million square kilometers), the seventh lowest on record. Although the 2015 minimum appears to have been reached, there is a chance that changing winds or late-season melt could reduce the Arctic extent even further in the next few days.
“The ice cover becomes less and less resilient, and it doesn’t take as much to melt it as it used to,” Meier said. “The sea ice cap, which used to be a solid sheet of ice, now is fragmented into smaller floes that are more exposed to warm ocean waters. In the past, Arctic sea ice was like a fortress. The ocean could only attack it from the sides. Now it’s like the invaders have tunneled in from underneath and the ice pack melts from within.”
Some analyses have hinted the Arctic’s multiyear sea ice, the oldest and thickest ice that survives the summer melt season, appeared to have recuperated partially after the 2012 record low. But according to Joey Comiso, a sea ice scientist at Goddard, the recovery flattened last winter and will likely reverse after this melt season.
“The thicker ice will likely continue to decline,” Comiso said. “There might be some recoveries during some years, especially when the winter is unusually cold, but it is expected to go down again because the surface temperature in the region continues to increase.”
This year, the Arctic sea ice cover experienced relatively slow rates of melt in June, which is the month the Arctic receives the most solar energy. However, the rate of ice loss picked up during July, when the sun is still strong. Faster than normal ice loss rates continued through August, a transition month when ice loss typically begins to slow. A big “hole” appeared in August in the ice pack in the Beaufort and Chukchi seas, north of Alaska, when thinner seasonal ice surrounded by thicker, older ice melted. The huge opening allowed for the ocean to absorb more solar energy, accelerating the melt.
It’s unclear whether this year’s strong El Niño event, which is a naturally occurring phenomenon that typically occurs every two to seven years where the surface water of the eastern equatorial Pacific Ocean warms, has had any impact on the Arctic sea ice minimum extent.
“Historically, the Arctic had a thicker, more rigid sea ice that covered more of the Arctic basin, so it was difficult to tell whether El Niño had any effect on it,” said Richard Cullather, a climate modeler at Goddard. “Although we haven’t been able to detect a strong El Niño impact on Arctic sea ice yet, now that the ice is thinner and more mobile, we should begin to see a larger response to atmospheric events from lower latitudes.”
In comparison, research has found a strong link between El Niño and the behavior of the sea ice cover around Antarctica. El Niño causes higher sea level pressure, warmer air temperature and warmer sea surface temperature in west Antarctica that affect sea ice distribution. This could explain why this year the growth of the Antarctic sea ice cover, which currently is headed toward its yearly maximum extent and was at much higher than normal levels throughout much of the first half of 2015, dipped below normal levels in mid-August.
Starting next week, NASA’s Operation IceBridge, an airborne survey of polar ice, will be carrying science flights over sea ice in the Arctic, to help validate satellite readings and provide insight into the impact of the summer melt season on land and sea ice.
###
Note: shortly after publication this story was edited to fix a text formatting error and to include a URL for NSIDC’s story
Not even a mention of the AMO cycle, oh well. Add it to the list of future discoveries of relationships.
“Not even a mention of the AMO cycle, oh well. Add it to the list of future discoveries of relationships.”
The AMO has been well known over the decades and the similarity with global temperatures is rather astounding. There are numerous paper linking AMOC, AMO with Arctic ice variation.
http://www.woodfortrees.org/plot/rss/from:1979/plot/esrl-amo/from:1979
This is a paper from 1998 that has been discussing the North Atlantic interdecadal variability.
“The authors focus on the physics of the North Atlantic interdecadal variability. If, for instance, the North Atlantic thermohaline circulation is anomalously strong, the ocean is covered by positive sea surface temperature (SST) anomalies. The atmospheric response to these SST anomalies involves a strengthened North Atlantic Oscillation, which leads to anomalously weak evaporation and Ekman transport off Newfoundland and in the Greenland Sea, and the generation of negative sea surface salinity (SSS) anomalies. These SSS anomalies weaken the deep convection in the oceanic sinking regions and subsequently the strength of the thermohaline circulation. This leads to a reduced poleward heat transport and the formation of negative SST anomalies, which completes the phase reversal.”
http://journals.ametsoc.org/doi/abs/10.1175/1520-0442-11.8.1906
Jetstream meridianal (low solar activity) reduces evaporation by reducing the force of the wind on the ocean.
No mention of the PDO cycle either.
No mention either of the massive volcanic activity that amazingly happens all along the same Antarctic Peninsula that is of course Ground Zero of global warming.
PDO, AMO, what the hell, an ice report is an ice report.
Well one of the risks of an early “call” is getting it wrong. Don’t crow too loudly yet.
As I suggested in comments to the article on the 11th, that was improbably early. It is now taking another downward dip as I predicted.
http://ocean.dmi.dk/arctic/plots/icecover/icecover_current_new.png
The ice that remains is thicker, which means the volume is greater than last year even if the extent isn’t. Any mention of that?
http://psc.apl.washington.edu/wordpress/wp-content/uploads/schweiger/ice_volume/BPIOMASIceVolumeAnomalyCurrentV2.1.png
Caleb (and Anthony) – There’s no mention of it because according to PIOMAS Arctic sea ice volume at the September minimum is LESS than last year:
http://GreatWhiteCon.info/resources/arctic-sea-ice-graphs/#PIOMAS
http://greatwhitecon.info/wp-content/uploads/2014/04/piomas-min-2015-1024×768.jpg
Any comment from Wadhams?…………… Thought not.
Here is the deal on Wadhams. I have been tracking him for some time now.
He said that the Arctic ocean would be ‘ice-free’ in 2015.
He also said it would be ‘ice free’ in 2015 or 2016.
He changed his mind last year and said 2020.
Read my post on Wadhams on WUWT here.
A commenter queried his predictions and he allegedly responded to him here. It says:
Wadhams has also been going on about Arctic methane and how worried he is. Gavin Schmidt has pointed out that there is no methane spice in the ice cores during the Holocene Climate Optimum when some say the Arctic was ”ice free (peer reviewed papers I have here).
It’s time for Wadhams to take a chill pill and simply go away.
Professor Wadhams is a co-founder of the alarmist outfit the ARCTIC METHANE EMERGENCY GROUP. Another of the co-founders is Paul Beckwith, AMEG blogger and studied[s] paleoclimatology and climatology. Here is what Paul said:
Here are other predictors of Arctic sea ice gone!
THE GREAT WALL OF SHAME.
The Arctic Methane Emergey Group’s website with Wadhams and Paul Beckwith.
http://ameg.me/
TYPO
Schmidt has pointed out that there is no methane spike in the ice cores
————
NOTE:
The NORTH POLE being ice-free is not meaningful or unprecedented. This is according to the NOAA Faqs as well as observations. Read about that fact here.
Jimbo
I rather liked the idea of Methane spicing up ice cores.
Isn’t he the bloke who thought big oil was assassinating climatology scientoligists?
Lack of ice core methane spikes implies two things, probability of large methane release is much smaller than hypothesised and/or the climate and biosphere respond quickly to massive spikes and make short shrift of the high concentrations.
Call me -ist, but Arctic ice also prevents cooling by insulating top water layers. Warming caused by less reflecting ice happens in May-June-July. Cooling caused by less insulating cover happens basically all year round.
That was Wadhams. Gore had same (2007 + 7). Now, what was Hansen’s prediction?
Even in the summer, the sun is so low that there is little solar insolation to begin with.
Beyond that, the difference between water and ice at those low angles is not that great anyway.
The extra heat escaping from water compared to ice is the dominant factor by a good margin.
I believe the Bragg angle is 57° but that’s from a pretty useless memory. Maybe I’ll check google late.
There’s also the point that since the winter maximum doesn’t change much, then a low summer results in more cooling as a larger area has to freeze.
johnb, i wonder if that contributes to the cooling phase of the amo ? currently no large pulses of heat being given off in the arctic basin despite low temps. the longer this lasts the more water will be cooled given current surface temps.
Take a gander at that Guardian photograph of the very large (height) ice mass. Then look over here on the right side at Dr. Roy Spencer’s comic picture showing the underneath.
I think Roy is exaggerating; but it is true that 9/10 or 10/11 or thereabouts of the floating sea ice is underwater, where it is in constant contact with the warmer waters that come up from the tropics via gulf steams, Japan currents and the like, and the thermal conductivity of water is very much greater than that of air.
Even if the summer air Temperature over the sea ice were above zero, the vast majority of the melting must come from the warm ocean water.
Just imagine how cold the arctic would be, if there was no massive heat transport from the tropics (where most of our heat is manufactured from formerly pristine solar EM radiant energy, that arrives there and is captured in the deep ocean.)
That suggests that all that ice remains there in the arctic, because there actually is very little solar radiant energy arriving there in the arctic, compared to global average rates of insolation.
So I think the issue of solar warming of newly open arctic water, is a bit of a red herring; there’s not that much energy to get absorbed compared to what has already been brought up there as heat from the tropics.
No I’m not suggesting we can ignore solar melting; but I see no reason to exaggerate it either; it isn’t the cause of arctic ice melting.
And if all those Russian ice breakers would stop stomping around up there, perhaps it would give the thicker ice a better chance of recovery.
g
Looking at the chart just now there has been a further downtick after the snapshot above so it might not have bottomed out yet.
You don’t want to be accused of terminating the data early to fit an agenda.
Wadhams was still wrong…but only by 6,000,000km2.
That is 68,603 Manhattens. Please use the correct units
I was trying to convert it to Hiroshima bombs… good catch.
Wadhams was wrong and so was Nafeez Ahmed of the Guardian. I see his name below the image of ice and Gavin Schmids’s tweet.
GRRRR! I messed up the blockquotes. Mod, here it is again. Please remove earlier post.
Wadhams was wrong and so was Nafeez Ahmed of the Guardian. I see his name below the image of ice and Gavin Schmids’s tweet.
A ‘journalist’ who failed to do his job properly. He defended the Shakhova hypothesis on Arctic methane bomb, supported by Wadhams. He came back when he realised that move was wrong.
Maybe Nafeez should have called Gain a ‘denier’.
Very good to see you back Jimbo. You seemed to drop off the radar for a while.
Nafeez Ahmad is a researcher and a journalist who tries to do his job diligently and honestly, but in my opinion he is burdened by his leftist and green political biases and also by his naive trust in “the experts” when it comes to the climate issue. Incidentally, he was fired from the Guardian last year after he wandered into a journalistic exclusion zone when he penned an article about the natural gas deposits off the coast of Gaza which was judged too “political”.
The day after posting it, I received a phone call from James Randerson, assistant national news editor. He sounded riled and rushed. Without beating around the bush, James told me point blank that my Guardian blog was to be immediately discontinued. Not because my article was incorrect, factually flawed, or outrageously defamatory. Not because I’d somehow breached journalistic ethics, or violated my contract. No. The Gaza gas piece, he said, was “not an environment story,” and therefore was an “inappropriate post” for the Guardian’s environment website
http://www.mintpressnews.com/censored-guardian-writing-israels-war-gazas-gas/199619/
The Guardian is a very aptly-named publication. The editorial hierarchy there are constantly standing guard to protect their narratives.
That may well be correct but one thing is for SURE he is a conspiracy theorist on 9/11. With thinking like that no wonder he was easily suckered into the methane bomb hypothesis.
“The thicker ice will likely continue to decline,” Comiso said. “There might be some recoveries during some years, especially when the winter is unusually cold, but it is expected to go down again because the surface temperature in the region continues to increase.”
In anyone able to clarify how surface temperatures are monitored “in the region?” Number/coverage of surface stations, etc? Thanks to anyone who can provide some insight.
Last I heard, there’s a climate station somewhere on the north shore of Alaska, and they use that station as a proxy for the entire arctic region.
There are a couple in the Scottish islands, too.
Auto
GISS claims 19 “Arctic” stations, but of course “data” from them are bent, folded, spindled, mutilated and parboiled, so that their own mothers wouldn’t recognize them:
http://notrickszone.com/2014/07/01/nasas-arctic-fudge-factory-more-than-half-of-claimed-arctic-warming-stems-from-data-adjustments/#sthash.6XRRrh8p.dpbs
http://imb.erdc.dren.mil/newdata.htm
Click on the map to see real time data provided by the buoys.
I believe these buoys provide data to the DMI Arctic region re-analysis program
http://ocean.dmi.dk/arctic/meant80n.uk.php
Not much melting going on here:
http://psc.apl.washington.edu/northpole/NPEO2015/2015cam1_2.jpg
The photo is from buoy 2015D.
After a couple of hundred years of satellite observations, we should have a pretty good idea of how the Arctic sea ice behaves.
…and miss out on a couple hundreds years worth of copius carbon taxes and control over people’s livelihood??? … the Left would be apoplectic at that idea.
Yes, and the tree ring shaman and climate supercomputer salesmen would have a thing or two to say about that.
Even though the Arctic Ice is at one of its lowest minima since 1979, the Antarctic ice extent is at an all-time high, both minimal and maximal. The satellites measuring Earth’s average temperature have said there has been no warming for 18+ years. I do not think it logical to accept that AGW is happening at anything like the rate the doom-mongers suggest.
I wonder which one of the above facts will be trumpeted in December in Paris and which ones will be conveniently ignored?
The December conference will be all about re-distribution of Western wealth to the already ridiculously wealthy and to tinpot dictators who will go along with the scam. It will have absolutely nothing to do with climate or weather.
Sad but true.
Records indicate a 60 year cycle in arctic ice extent roughly corresponding with the PDO.
1979 was close to the end of the last cold cycle of the PDO, it was also the time of maximum ice extent.
Personally I expect the ice levels to begin it’s cyclical recovery to 1979 levels in the next year or two.
It already has for the past three years. https://stevengoddard.wordpress.com/2015/09/15/26-increase-in-arctic-sea-ice-over-the-last-three-years/
I’m not ready to call it. There’s enough year to year variation.
It does look like we have had a solid turn around, but I’ll wait another two years.
Another August cyclone as in 2007 and 2012 could set back the gains. But that’s just weather.
true Gloria, but the ice is far thicker, harder to move now then it was then. Mark it is to soon to be certain I agree, but the Russians keep building more Ice Breakers (-;
imo the atlantic cycles are more important than the pacific due to the greater influx of water from that direction and how warm the main north atlantic current is .
“I wonder which one of the above facts will be trumpeted in December in Paris and which ones will be conveniently ignored?”
No need to ignore any of the “facts”: they will all be blamed on “climate change”; even when the conditions reverse.
As of today (17th September) Antarctic ice is half a million sq km below average.
Add in the 1.5 million sq km deficit in Arctic ice, and the world is missing about 2 million sq km (over 10 per cent) of sea ice.
“”Please note that the Arctic sea ice extent number is preliminary—changing winds could still push the ice extent lower. NSIDC will issue a formal announcement at the beginning of October with full analysis of the possible causes behind this year’s ice conditions,…””
In other words : We reserve the right to announce a much lower ice extent in time for the COP meeting of Parisites in December.
Beat me to it. The book is never closed on later adjustments in CliSci. The only certainty is that “it’s worse than we thought”.
Whatever it takes!
NASA mentioned the the possibility this year’s strong El Niño may have quickened Arctic ice melt, however, they conveniently forgot to mention the Ridiculously Resiliant Ridge (RRR) and “The Blob”, which collectively contributed to Arctic Ice melt and a lower total Arctic Maximum Ice Extent and accelerated ice melt.
Next year: a La Niña will be in effect, “The Blob” and the “RRR” will be long gone, the AMO 30-yr warm cycle will continue to wind down, the 30-yr PDO cool cycle already started in 2008, and the current solar cycle will continue to weaken.
Arctic ice has been recovering since 2007 (the peak of the AMO warm cycle) and will likely continue to do so. Once the CAGW zealots no longer have Arctic Ice melt to scare small children and low-information voters, they’ll have nothing.
Things are not looking good for the CAGW hypothesis…
SAMURAI September 16, 2015 at 8:47 am said:
“they’ll have nothing”
Oh but the alarmists have:
Ocean Acidification
Coral Bleaching
Pole ward migration of species
_
The CAGW religion is strong.
Ferdinand- The CAGW advocates will never voluntarily give up their fight for more CAGW grants, however, the polling data definitely shows voter support for CAGW is waning
The almost two decades of no global warming trend, the complete lack of evidence of global trends in severe weather incidence and intensity, the record Antarctic Ice Extents, the bitterly cold winters, the recovering Arctic Ice, etc., are starting to take their toll in the polls.
As soon as political support for CAGW becomes a polical liability, even Leftist politicians will be forced to weaken and eventually abandon their support for CAGW…
CAGW is a polical phenomenon not a scientific phenomenon…
Also, I see more scientists outside of climatology taking a pragmatic stand against CAGW as it’s becoming an untenable hypothesis. It’s also restricting research grants to their respective fields of study..
We’ll see, but I’m quite confident the demise of CAGW will be much a fairly fast process…
An increasing trend of Arctic sea ice extent would certainly harm their credibility big time. They will of course keep pointing to the 1979 extent and say it’s still lower, forgetting all about their ice-free projections, death spirals, dark open water ocean heat absorption, thinner broken sea ice et al.
as the north east atlantic cools watch the mackerel migration routes switch back to what they were pre 90,s. you will know when it happens as the bickering between iceland,the faroes and the eu over who catches what amount every year will cease when there are no longer mackerel in sufficient numbers in icelandic waters worth fishing for.
Samurai, I appreciate your optimism, but you are expecting the AGW proponents to act with scientific scruples and admit that they have overestimated the magnitude of that which is the entire platform of the quasi-religious and ideological agenda of global control which they represent.
I look for claims that carbon pollution (in some silly manner) is still the cause of the longer winters and shorter summers which history warns we are soon to embark upon. This will keep the populus hypnotized by whirling blades and the glare of solar collectors.
Dawtgtomis– I agree with you that CAGW zealot “scientist” will NEVER voluntarily give up $billions in CAGW research grants. They’ll continue to churn out more pal-reviewed papers like Karl2015, tamper with raw data, develop new excuses for why their precious CAGW hypothesis has crashed and burned so spectacularly,etc., however, scientist outside of climatology and logical and rational people just ain’t buying the snake oil anymore….
I think once the “hiatus” hits 20+ years in satellite data, more and more people will laugh and eye roll the CAGW hypothesis onto the trash heap of failed ideas…
I also believe the political blowback against Leftists following the demise of CAGW will be quite spectacular, once taxpayers realize the $trillions government hacks have wasted on needless CAGW mitigation policies…
We’ll see soon enough.
Actually my interpretation is that there is about a 2-year lag between El Nino and Arctic ice, which fits with 2005-2007 and 2010-2012 data. Therefore I am making a prediction that Arctic ice will be low in 2017. After that it should have good chances of recovery.
Rich.
It could be if there is another August cyclone then, as in 2007 and 2012.
It’s already September, kind of hard to spring an August cyclone on us.
you may well be correct . unfortunately what is being trumpeted as an el nino at the moment is nothing of the sort ,so the ice looks like it will be just fine in 2017.
Yet ice volume is up as s multi year ice increasing.
“Historically” as used in the above article refers to ‘since 1979’. So this ‘history’ is very short indeed and begins at the coolest period of the 20th century.
It’s a cherry picked range… one of the most dishonest ways to do “science”.
If this had anything to do with Science it would be an average of 1979 to 2015… therefore the whole entire arctic ice panic is nothing but politics and transparent fear mongering.
“Big freighter traverses Northwest Passage for 1st time …
http://www.reuters.com/…/us-shipping-coal-arctic-idUSBRE98Q0K720130927
27 Sep 2013 – Related: Environment. Big freighter traverses Northwest Passage for 1st time … Northwest Passage for the first time this week, showing the potential for cutting shipment times and costs as global warming opens new routes”
1930- North-West Passage
THREE SHIPS GET THROUGH
For the first time in its history
three ships of the Hudson’s Bay
Company have made the hazardous
North-West Passage in one season.
They are the Fort James, a stout
little schooner of 130 tons with a crew
of fewer than 20 souls, the even
smaller Macpherson, which is perman-
ently stationed in the Arctic seas, and
the Baychimo, a vessel of 1,500 tons.
1839 -“North-west Passage.
Colonial Times (Hobart, Tas. : 1828 – 1857) Tuesday 15 October 1839 p 5 Article
… North-west Passage. From a number of the Penny Magazine, for April 1838 … , we gather the intelligence, that the north-west passage has been achieved,and that the continent ……”
Last week or so a Guardian article stated the arctic was ICE FREE and the Northwest passage was open with tourist ships that had hot tubs on deck. Well they sailed from Greenland to an inner port in Nunavut, Canada. The fact that the trip of course was not scheduled to go from the Atlantic Greenland port to some Pacific port did not stop their claims which go on and on without challenge from reasonable minds. Yes as pointed out ships have transversed the Northwest Passage in the past, at great peril and in voyages that I would not be inclined to join.
The Ponant line has just had two tourist ships sail from Greenland to Pacific ports last week:
http://northwestpassage2015.blogspot.com/2015/09/two-ponant-ships-cross-northwest-passage.html?view=sidebar
You are right. And the idea of measuring the ice on the basis of 1979 is ridiculous.
SS Manhattan was an oil tanker constructed at the Fore River Shipyard in Quincy, Massachusetts that became the first commercial ship to cross the Northwest Passage in 1969. Having been built as an ordinary tanker in 1962, she was refitted for this voyage with an icebreaker bow in 1968–69. Registered in the United States at the time, she was the largest US merchant vessel as well as the biggest icebreaker in history.
https://en.wikipedia.org/wiki/SS_Manhattan_%281962%29
Why is this always “forgotten”
Inconvenient truth?
“Climate of Gavin”… Really? Does he conceive the hubris that conveys?
Yes, he is surrounded by his own climate created only by his personal gravity and magnetism. 🙂
my Climate of Joel, comes after eating onion rings or a Outback Blooming onion, and usually gets me banished to the guest bedroom. I assume Climate of Gavin is also mostly a 24/7 warm, sulphurous methane release as well.
Funny how they try to avoid the fact that the Antarctic sea ice cover reached its largest maximum extent last year since satellites began measuring sea ice. Maybe because that fact does not fit with the explanation given for the shrinking Arctic ice cover.
If your theory cannot explain some empirical data, then your theory is wrong.
“It was a bit warmer in some areas than last year, but it was cooler in other places, too.”
This, my friends, is the ESSENCE of climate “science”…
“The thicker ice will likely continue to decline,” Comiso said. “There might be some recoveries during some years, especially when the winter is unusually cold, but it is expected to go down again because the surface temperature in the region continues to increase.”
Just a bunch of guesses with no real sciency stuff….
How come nobody talks about “ice volume”? How well is ice volume and multiyear ice documented through the last century or two?
What about the lakes and bays that have had ice last longer than usual?
How come the the mean for healthy arctic ice was started at the end of 70s, when the fear was a new ice age, and arctic ice was very high, and that was considered bad, and now we are in a warmer regime and the new ice level that is lower, is bad too???
all i want is sanity
is there anybody out there?
There is a fifth dimension, beyond that which is known to man. It is a dimension as vast as space and as timeless as infinity. It is the middle ground between light and shadow, between science and superstition, and it lies between the pit of man’s fears and the summit of his knowledge. This is the dimension of imagination. It is an area which we call the Twilight Zone.
— Rod Serling
We’re Here
excellent 🙂
IF the arctice sea ice help regulate earths temperature, shouldn’t the number we care about be extent on June 21 By Septeber 11 or whatever, there is very little sunlight, and almost no engergy from the sun at those lattatudes.
the pertinant metric is Arctic sea ice extent on December 21. The polar oceans are Earth’s radiators, not its solar absorbers. The CAGW alarmists need sheeple to believe in the positive feedback myth.
Oh well, tell him to cheer up. There’s always next year!
Why do we focus so much attention on polar ice extent?
Ice has been receding for 12,000 years mostly without any human influence. Whether or not it continues will be determined by natural events we cannot hope to control. If we are emerging from the current ice house earth to a new hot house earth we will not be able to stop it. If we are seeing the end of the current inter glacial and the glaciers return we can’t stop that either.
The reality is we do not know which will occur, but we do know that CO2 is not driving the climate. We have had hot house earth with low CO2 and ice house earth with high (>3,000ppm) CO2 and vise versa. All these events have occurred many times in the geological record before humans existed. Whatever the outcome humanity will have to adopt or perish, assuming some calamity other than climate doesn’t end humanity first.
A Minor Half truth. The major truth is a blanket of sea ice (usually with dusting of insulating snow) reduces radiative cooling during the winter darkness. The negative feedback of that is much more dominate on Earth’s heat budgethan the positive feedback of polar ice albedo.
Anthony:
For editorial purposes I suggest the following change in narrative to get past the continued alarmist ruminations about “4th lowest year”, etc.:
remove the 2012 cyclone induced (outlier) minimum from the data series [clear outliers should be removed anyway from a statistical perspective] and it is evident for all to see that 2007 was the turning point in ice loss – all minima bar 2012 are above the 2007 minimum. Even 2015, a strong El Nino plus North Pacific warm blob year.
This narrative gains further support from the ice volume/thickness data which appear to be on the increase, also having turned the corner. How the apparent change in the AMO to a cold phase might add to this remains speculation at present.
http://woodfortrees.org/plot/esrl-amo/from:2007/plot/esrl-amo/from:2007/trend
Then 2007 should also be an outlier, since that low was also caused by a cyclone in August. They happen often enough to be considered not freak weather occurrences, IMO.
Grasping at straws?
The 2012 cyclone was unusual in both strength and duration -no one, not even the usual climate establishment oracles of doom dispute this.
A brief refresher course in elementary statistics might help you understand the trend shift.
The real problem is…no Arctic ice is great news! And during the Ice Ages, the Arctic was never covered by glaciation anyways, Canada, Greenland and much of the upper NE USA was under miles of ice. Not most of Alaska nor much of Siberia, etc.
This blunderbuss yelling about insignificant icing is immensely annoying. The growing ice in Antarctica, on the other hand, is significant news.
The alarmist crowd always ignores the Antarctic. They shouldn’t, because the AGW scare refers to global warming. The globe has two poles.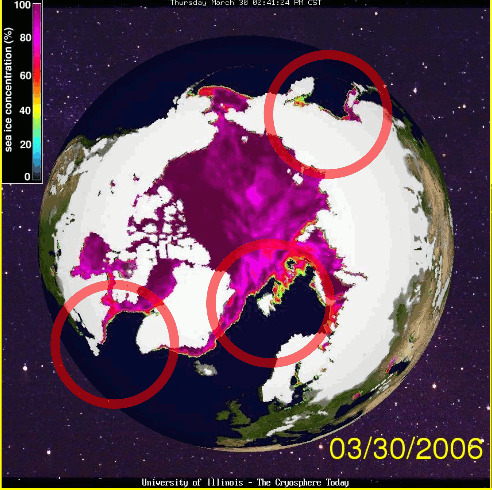
The Antarctic contains about 10X the volume of Arctic ice, and Antarctic ice is steadily increasing:
http://www.climate4you.com/images/SeaIceNHandSHlastMonthSince1979.gif
Also, the low for Arctic ice was in 2006-7. Here’s a comparison of 2006 with 2015:
Arctic ice is increasing. Once again, the climate alarmists are wrong.
No, 2006 was not the lowest. Look at Walter Dnes’ post below, 2006 was the 10th lowest.
ralfellis
You can play it how you like, but the fact is the combined sea ice area is in decline. It doesn’t really matter long term whether Antarctica grows a little one year and the Arctic shrinks a little. If the combined total is negative over a number of years you have a trend.
Simon (replying to ralfellis)
False.
The effect of the Antarctic is growing much more since 1992, at a much faster rate the past 5 years in the latitudes that matter (62 to 58 degrees south latitude) than the Arctic sea ice has declined (between 71 and 81 degrees north latitude) since 1979 Over the course of a year, every sq meter of Antarctic sea ice gained reflects 1.68 MORE energy than any meter of Arctic sea ice lost. Arctic sea has gone from a start point of +0.5 Mkm^2 – and note, we don’t know what the actual “average sea ice” actually is! – down to a recent average of -1.0 Mkm^2.
The Antarctic sea ice has risen from a start point in 1979 of -0.32 to a new average of +1.0 Mkm^2. So, the effect of the Antarctic sea ice is much more important, and even your claim that the Arctic Ocean has lost more area is also wrong.
RACookPE1978
False. Argue with NASA.
“Sea ice increases in Antarctica do not make up for the accelerated Arctic sea ice loss of the last decades, a new NASA study finds. As a whole, the planet has been shedding sea ice at an average annual rate of 13,500 square miles (35,000 square kilometers) since 1979, the equivalent of losing an area of sea ice larger than the state of Maryland every year.”
https://www.nasa.gov/content/goddard/nasa-study-shows-global-sea-ice-diminishing-despite-antarctic-gains
Actually, there is one correct sentence from your NASA-GISS propaganda piece:
No, the increase in Antarctic sea ice extents is more important to the earth’s heat balance than any further loss of Arctic sea ice extents. Their total area remains the same – her “data” was truncated in 2013 to eliminate the past 36 months of positive total sea ice anomaly. Her claims are wrong in both detail and in calculations.
RACookPE1978
I see where you are going wrong. You seem to convince yourself that every time a piece of evidence that doesn’t support your denial comes along, (which is often) it has to be propaganda. It is a logic that wont serve you well, unless you want to stay in the dark.
And her quote was saying the opposite to your interpretation. They don’t cancel each other. The loss of Arctic sea ice is more detrimental than the small gains in the Antarctic.
I agree, they don’t “cancel” each other. The antarctic receives significantly more solar energy over the course of a year than the arctic, and that energy is reflecting from much higher solar elevation angles every day of the year. Plus, the arctic sea ice during its melt season (15 April – 15 September has a significantly lower albedo than the antarctic sea ice does during its shorter melt season; and that decline in arctic sea ice albedo occurs during the time of the year when the earth receives much less solar radiation.
Net? Your claims loses.
False. Show any calculation demonstrating the reasons you claim the arctic sea ice is more important.
RACookPE1978
“False. Show any calculation demonstrating the reasons you claim the arctic sea ice is more important.”
I just sent you a link from NASA explaining quite the opposite of what you are saying. Oh, but then you dismiss what is regarded internationally as some of the finest data on the planet as propaganda. It must be easy living in your simple world. If it doesn’t fit my belief it is all a conspiracy to annoy the hell out of me.
Anyway, tell me what you think is happening in the Antarctic right now? Interesting don’t you think. It is almost that the Antarctic is far less stable and doesn’t know what to do, where as the Arctic has a plan and that is to head straight on down.
Chris,
I wrote: 2006-7.
Arctic ice cover is normal. It goes up, it goes down. But the Arctic is only half the story.
You avoid discussing the Antarctic. Global ice is right on it long-term average. There is nothing either unusual or unprecedented happening.
You are just trying to sound a false alarm. That’s not honest.
Simon, except for the simple fact that it is no longer in decline.
DB
Once again you play with nonsense. Right at this point Antarctic sea ice is below average.
http://nsidc.org/data/seaice_index/images/daily_images/S_stddev_timeseries.png
But, but, but – when I contended with some Warmists on the Grauniad, that last year Antarctica had the greatest ever sea ice extent, they produced ‘evidence’ (papers) to say that increasing sea ice was due to Global Warming.
So now the sea ice is reducing, does this mean we are experiencing Global Cooling? Or is this ‘heads you win, tails I lose’ stuff? Really, this is like debating with kids.
Ralph
Sorry, but at the moment Antarctic sea ice is smack dab in the middle of the normal zone, after having been well above it for most of the year.
The sole reason for the drop in southern sea ice was due to prolonged flows of warm, moist surface winds which penetrated in to the coast line. The melt created large open pockets in the sea ice strictly within the bounds of where the wind stream pushed in towards the coast line. This probably has much to do with why Australia experienced such a cold winter this season.
How ignorant trolls are! Anything within 2SD is scientifically normal. For years, Antarctica has been at the top, and the Arctic near the bottom, of 2SD. Maybe slightly in or out sometimes. Nothing to justify claims of abnormality, even for those who don’t know the longer term data. It, has greater variation.
I mean you, Simon.
Simon,
I’ve repeatedly posted examples of NSIDC fudging the numbers. The truth is not in them. They are government bureaucrats and job security is more important than honesty. They do it so mindless parrots will stay on the Man-made global warming reservation.
So I will take the time to re-post those examples of NSIDC’s diddling with the data — if you will agree that you will no longer post their fabrications. They are misinformation.
I’ve been posting the most accurate and up to date global, Arctic, and Antarctic ice data in chart form that is currently available:
http://www.climate4you.com/images/NSIDC%20GlobalArcticAntarctic%20SeaIceArea.gif
It is compiled by one of the premier scholars of polar ice and climate, Dr. Ole Humlum.
Dr. Humlum has authored 96 peer reviewed papers, 80 Newsletters, 3 Technical Handbooks, 8 Scientific Field Guides, 3 Scientific Reports, 53 Abstracts and Posters, 2 Journal Special Issues, 3 books, he has given 46 radio, newspaper and TV interviews. He is the webmaster for the International Permafrost Association, principal researcher for the International Norwegian Permafrost Monitoring Initiative; an International Polar Year (IPY) research project.
Scandinavian scientists are among the world’s best authorities on Polar ice, on the cryosphere, and related studies. Dr. Humlum is considered the best of the best.
Dr. Humlum also maintains the Official webpage for The Norwegian Organisation of Cryosphere Scientists (CRYONOR), which organises all active cryosphere scientists at Norwegian Universities and other research institutions; he is a national contact for the International Permafrost Association, webmaster of the Climate4You site, and he is the Project Coordinator for the Hanne H. Christiansen UNIS, Svalbard, funded by the Norwegian Research Council.
Now, you can be spoon-fed the fabricated NSIDC government charts that confirm your alarmist bias, or you can pay attention to someone who knows what he’s talking about.
Global ice is right at its long-term average. The Arctic is below its average, and the Antarctic is above its average. This is as of last month, August, 2015 — the most recent data available.
Further, the Antarctic holds 10X the ice volume of the Arctic. That’s why the alarmist crowd does not want to discuss the Antarctic.
You’re way out of your depth here, Simon, both you and Bucky. I suggest doing at least a few weeks reading. Use the WUWT search box, key word: ice. That should get you kids started, at least.
Stealey commits the “Appeal to Authority Fallacy”
Wrong again, Booby.
It’s a fallacy when the ‘authority’ has been corrupted, or isn’t a real authority, etc.
You could look it up. I have. You’re wrong. Dr. Humlum is a true authority. The NSIDC isn’t.
I know which are fallacies, and which aren’t.
But nice try, and thanx for playing. Better luck next time.
DB
“I’ve been posting the most accurate and up to date global, Arctic, and Antarctic ice data in chart form that is currently available:”
Um no you didn’t. For that see my post at 12.23 pm. What do you make of it DB? Why do you think the Antarctic is not all over the place?
Simon sez:
Um no you didn’t.
THAT is your argument?? “No you didn’t”?? Lame.
Simon, you are a complete failure. When two charts disagree, intelligent people refer to the one produced by the more credible source. As I scolled you, NSIDC is a political bureaucracy, while the Scandinavians are recognized world wide as the premier cryosphere experts. Further, NSIDC is primarily a national (ie: a U.S.) remit. They like to throw in their 2¢ on Arctic ice, but it’s out of their league.
You love being spoon-fed misinformation. I offered to re-post irrefutable evidence showing that NSIDC fabricates what it pretends is “data”.
But you avoided responding to that. Simon, tucking tail and running away shows that your mind is made up, and closed tight. Climate alarmism is your religion. Being fixated on a natural, normal phenomenon and trying to convince more intelligent readers that your propaganda source should be trusted is nothing but confirmation bias.
As for your pal Bucky… Pf-f-f-f-ft.
dbstealey September 16, 2015 at 8:20 pm
I’ve repeatedly posted examples of NSIDC fudging the numbers. The truth is not in them. They are government bureaucrats and job security is more important than honesty. They do it so mindless parrots will stay on the Man-made global warming reservation.
So I will take the time to re-post those examples of NSIDC’s diddling with the data — if you will agree that you will no longer post their fabrications. They are misinformation.
I’ve been posting the most accurate and up to date global, Arctic, and Antarctic ice data in chart form that is currently available:
It is compiled by one of the premier scholars of polar ice and climate, Dr. Ole Humlum.
You really should read the material you post!
The data for the graph that you attribute to Humlum is from NSIDC!
Now, you can be spoon-fed the fabricated NSIDC government charts that confirm your alarmist bias, or you can pay attention to someone who knows what he’s talking about.
Well the “someone who knows what he’s talking about” uses NSIDC data.
Global ice is right at its long-term average. The Arctic is below its average, and the Antarctic is above its average. This is as of last month, August, 2015 — the most recent data available.
And yet according to Cryosphere Today it’s about 2 million sq. km below average.
I suggest that it’s you who needs to do some reading.
“Phil.” is being disingenuous again. He says:
The data for the graph that you attribute to Humlum is from NSIDC!
As ‘Phil.’ prevaricates, I’ll repeat what I wrote: that I have evidence that NSIDC “adjusts” the numbers. Dr. Humlum uses a mountain of data from numerous sources, and I have no doubt that he has verified the data he used by cross-checking with other sources. I posted part of Dr. Humlum’s CV, anyone can check the sources. That does not alter the fact that NSIDC has been caught altering the data.
Next, ‘Phil.’ selects a less than totally reputable source:
And yet according to Cryosphere Today it’s about 2 million sq. km below average.
I’ve posted Dr. Humlum’s charts of Arctic, Global, and Antarctic ice. Those charts are current: as of last month (September numbers are not available yet), and they show that global ice is right on its long-term, 36-year trend line. But ‘Phil.’ cherry-picked a source that is not in agreement. Hmm-m-m. Who to believe? And why would he do that, anyway?
I might start to consider “Phil.” credible if he posted his own CV here. But so far, he’s only an anonymous screen name with an opinion. There are lots of those.
dbstealey September 17, 2015 at 10:23 am
“Phil.” is being disingenuous again. He says:
“The data for the graph that you attribute to Humlum is from NSIDC!”
As ‘Phil.’ prevaricates, I’ll repeat what I wrote: that I have evidence that NSIDC “adjusts” the numbers. Dr. Humlum uses a mountain of data from numerous sources, and I have no doubt that he has verified the data he used by cross-checking with other sources.
Humlum uses the raw data from NSIDC, he lists the link so clearly he has no problem with NSIDC data.
Next, ‘Phil.’ selects a less than totally reputable source:
“And yet according to Cryosphere Today it’s about 2 million sq. km below average.”
I’ve posted Dr. Humlum’s charts of Arctic, Global, and Antarctic ice. Those charts are current: as of last month (September numbers are not available yet), and they show that global ice is right on its long-term, 36-year trend line.
That isn’t a “trend line”, it’s the 36 year average over all seasons which isn’t relevant for the comparison you make. By your comparison global sea ice was 5 million km^2 below average earlier this year and before that about 3 million km^2 above average, not very relevant. The normal comparison is with the average for the day/month concerned, when you do that you find that it’s about 2 million km^2 below the average for the day (ref 1979-2006)
But ‘Phil.’ cherry-picked a source that is not in agreement. Hmm-m-m. Who to believe? And why would he do that, anyway?
As we see the disagreement is because you don’t understand the concept of averages and anomalies.
I might start to consider “Phil.” credible if he posted his own CV here. But so far, he’s only an anonymous screen name with an opinion. There are lots of those.
Yes and of the 4 names you’ve used on here one was a pseudonym, one a set of initials, I’ve always used my actual name to post here.
You should learn what ‘anonymous’ mean:
“(of a person) not identified by name; of unknown name.”
simon says “where as the Arctic has a plan and that is to head straight on down.” . i would be able to take you more seriously if you had some skin in the game simon. would you like to have a charity wager on the arctic heading straight on down ?
when do you foresee the minimum summer extent dropping below 1 million square km ? the offer of the charity wager is extended to every single nasa employee, in fact any person on the planet that believes we will see less than 1 million square km within the next 6 years. i would be happy to extend the timescale but not by too long,but i live a life that is fairly hard on the body in winter time and would not want to welch on the bet due to death 🙂
“Phil.”
‘Phil-dot’. Hmm-m. Never heard of anyone named that before.
Mr. Dot sez:
Humlum uses the raw data from NSIDC, he lists the link so clearly he has no problem with NSIDC data.
Yes, and notice the data Dr. Humlum posted is quite different from what Simon posted; the chart usually used by the general public. If that doesn’t make you suspicious of NSIDC, what would?
Probably nothing; rhetorical question.
Next:
…of the 4 names you’ve used on here one was a pseudonym, one a set of initials, I’ve always used my actual name to post here.
Four names? Name them. I recall using 3: At first I used a nickname, ‘Smokey’. When Anthony said he did not appreciate anonymous cowards, I changed it to the middle name on my drivers licence. That was very temporary, and I decided what the heck, why not just use my real initials and my last name (my first name is Dave, thus the ‘db’). Who wants to be an anonymous coward? And I never once used more than one name at any time. Those were all in succession.
So, your real name is Phil-dot, is it? That is as believable as runaway global warming. No wonder you won’t post your C.V. — if you even have one.
Hey, I have a suggestion! Why not use initials, too? How about: ACPhil? Unique, and it fits.
Some folks have a good reason for a screen name. The best reason I can think of is if you were on a university payroll, and you were a skeptic of dangerous AGW. Anonymity would protect your identity from retribution byt the far-Left faculty at most unis. Same if you’re a gov’t employee and a skeptic. Or a journal publisher and a skeptic.
But you’re no skeptic; far from it. You constantly argue with skeptics.
So, Mr. Phil-dot, you know exactly who I am, and no doubt my science background and employer before I retired. But we know nothing about you, except you’re pretty hypocritical, and you’re afraid to disclose your own identity. For all we know, you’re David Appell. Or Pee Wee Herman.
Now, aren’t you glad you brought that up? Did you expect no push-back from me?☺
dbstealey September 17, 2015 at 5:35 pm
“Phil.”
‘Phil-dot’. Hmm-m. Never heard of anyone named that before.
English not your strong point either.
It’s termed an abbreviation, my full name is Philip. As is customary in English when an abbreviation ends in a different letter than the full word a period is used to indicate that, thus ‘Phil.’, whereas ‘Charles’ is abbreviated to ‘Chas’, see Fowler’s Modern English Usage.
“Humlum uses the raw data from NSIDC, he lists the link so clearly he has no problem with NSIDC data.
Yes, and notice the data Dr. Humlum posted is quite different from what Simon posted; the chart usually used by the general public. If that doesn’t make you suspicious of NSIDC, what would?
Apparently you have problems with graphs too, Humlum plots the NSIDC data averaged monthly whereas the graph shown by Simon smooths over a few days. The NSIDC graph shows a maximum at about 14.5 for the arctic as does Humlum. Humlum shows an August average of ~5.5 whereas the NSIDC graph shows 6.9 – 4.7 for August, nothing suspicious there!
…of the 4 names you’ve used on here one was a pseudonym, one a set of initials, I’ve always used my actual name to post here.
Four names? Name them. I recall using 3: At first I used a nickname, ‘Smokey’. When Anthony said he did not appreciate anonymous cowards, I changed it to the middle name on my drivers licence. That was very temporary, and I decided what the heck, why not just use my real initials and my last name (my first name is Dave, thus the ‘db’). Who wants to be an anonymous coward? And I never once used more than one name at any time. Those were all in succession.
As I recall you changed from your longtime screen name, smokey, after your real name became known, to D Boehm, followed shortly thereafter by dbstealey, during that time you were also identified in your moderator role as dbs
Hey, I have a suggestion! Why not use initials, too? How about: ACPhil? Unique, and it fits.
I’m quite happy with my present one thank you.
Some folks have a good reason for a screen name. The best reason I can think of is if you were on a university payroll, and you were a skeptic of dangerous AGW. Anonymity would protect your identity from retribution byt the far-Left faculty at most unis. Same if you’re a gov’t employee and a skeptic. Or a journal publisher and a skeptic.
But you’re no skeptic; far from it. You constantly argue with skeptics.
As I have said before on WUWT the reason for my use of a screen name was a denial of service spamming attack which caused significant inconvenience (not on this site).
So, Mr. Phil-dot, you know exactly who I am, and no doubt my science background and employer before I retired. But we know nothing about you, except you’re pretty hypocritical, and you’re afraid to disclose your own identity. For all we know, you’re David Appell. Or Pee Wee Herman.
Your background is of no interest to me, it has no influence on my opinions of your postings, when you’re wrong you’re wrong. I’m surprised you’re interested in my CV since knowing my background wouldn’t change your mind, not even if I were a Nobel laureate!
ACPhil. says:
“It’s termed an abbreviation, my full name is Philip.”
An ‘abbreviation’! LOL!! You’re either posting your full name, or an “abbreviation”. Can’t be both.
Is your ‘abbreviation’ like the musician Prince, whose name is an unpronouncable symbol? ☺
‘Phil-dot’ is not your “full name”. “Full name”. We know a “full name” when we see one.
Without a verifiable identity, your comments are no more credible than if Pee Wee Herman used a fake name here.
dbstealey September 18, 2015 at 10:41 am
ACPhil. says:
“It’s termed an abbreviation, my full name is Philip.”
An ‘abbreviation’! LOL!! You’re either posting your full name, or an “abbreviation”. Can’t be both.
Is your ‘abbreviation’ like the musician Prince, whose name is an unpronouncable symbol? ☺
‘Phil-dot’ is not your “full name”. “Full name”. We know a “full name” when we see one.
Really? Are you really trying to prove your stupidity?
Without a verifiable identity, your comments are no more credible than if Pee Wee Herman used a fake name here.
How are we able to verify your identity?
“Phil.” says:
How are we able to verify your identity?
Since it’s the name on every comment I make, even you can probably figure it out.
And:
Your background is of no interest to me, it has no influence on my opinions of your postings…&etc.
So why even ask about my identity? I was asking about yours. because for what i can see, you just cut and paste answers you find with a quick search, and pretend to have the knowledge. So I’m calling you on it. Verify that you understand, and that you’re not a poseur.
And: when you’re wrong you’re wrong….
When I am wrong, I am wrong. But it doesn’t happen very often. In fact, everyone is wrong, and you have had more than your share of being wrong. That kind of schoolyard taunt takes you down to Bucky’s level. Juvenile taunts are about 60% of his comments. Is that rubbing off on you now?
Really, “Phil.”, why are you so terrified of posting your name? Claiming “Phil.” is your whole name makes me laugh, it’s such a ridiculous claim. So quit being a ‘fraidy-cat, and answer. You will be a better man for it.
dbstealey September 19, 2015 at 4:45 pm
“Phil.” says:
“How are we able to verify your identity?”
Since it’s the name on every comment I make, even you can probably figure it out.
As you said, how do we know that it’s not Pee Wee Herman using ‘dbstealey’ as a screen name?
You using the name verifies nothing, no more than most who post on here can be.
And: “when you’re wrong you’re wrong….”
When I am wrong, I am wrong. But it doesn’t happen very often. In fact, everyone is wrong, and you have had more than your share of being wrong.
You’re frequently wrong, most recently your blunder in identifying the 35 year average on Humlum’s graph as a ‘trend line’, you also apparently hadn’t realized that he used NSIDC data and then tried to make a bogus claim that his graph showed data “quite different” from the daily NSIDC graph, as I pointed out you were wrong. Needless to say in your usual fashion you avoid addressing your errors and try to switch the subject, in this case by focussing on posters identity.
Claiming “Phil.” is your whole name makes me laugh, it’s such a ridiculous claim.
I made no such claim, you apparently don’t understand what an ‘abbreviation’ is, (did no-one ever call you Dave.)?
dbstealey September 19, 2015 at 4:58 pm
Chris says:
“…about the Antarctic – why do you always bring that in on threads about the Arctic?”
Because, Chris, the basic debate is about anthropogenic GLOBAL warming: “AGW”. You are trying to limit the discussion to one cherry-picked location.
It was Anthony who chose the topic “Peter Wadhams was wrong – Arctic sea ice still there, no record low this year”, not Chris.
“Phil.” says:
As you said, how do we know that it’s not Pee Wee Herman using ‘dbstealey’ as a screen name?
Ask Anthony. End of problem, Pee Wee.
Next:
…I pointed out you were wrong.
Assertions don’t cut it. You’re just deflecting from the central point: you, and everyone on the alarmist side, has been completely wrong regarding your wild-eyed stories about Arctic ice disappearing. You have been totally, consistently, completely wrong. To quote the anonymous “Phil.”:
Needless to say in your usual fashion you avoid addressing your errors and try to switch the subject, in this case by focussing on posters identity.
The issue [see the article’s title] is Wadhams and your own busted predictions. Stand-up guys would admit they were flat wrong.
Next:
You’re still hiding behind an anonymous screen name. Time to ‘fess up — unless you like the label “anonymous coward”.
Finally, trying to deflect my comment from Chris onto Anthony is typical of your fuzzy-headed ‘logic’. Better luck next time, Pee Wee.
DB Stealey said: “Chris,
I wrote: 2006-7.
Arctic ice cover is normal. It goes up, it goes down. But the Arctic is only half the story.
You avoid discussing the Antarctic. Global ice is right on it long-term average. There is nothing either unusual or unprecedented happening.
You are just trying to sound a false alarm. That’s not honest.”
First, your picture IS of 2006. And second, there is no such thing as 2006/2007 when it comes to a low year. The lowest point occurs in September, so either you were saying 2006 was the lowest, or 2007.They can’t both be the lowest. Which was it? But it doesn’t matter – both are incorrect statements.
Second, about the Antarctic – why do you always bring that in on threads about the Arctic? It’s not a question of avoiding anything. It’s irrelevant to a discussion about Arctic ice. If you want to introduce irrelevant topics, don’t lay a guilt trip on others for not responding.
Third, introducing the topic of global ice extent is analogous to saying it’s no big deal if Africa is in drought as long as other parts of the world are getting more rainfall than normal. As long as global rainfall totals are the same as normal, then the planet is in good shape! The Arctic region has a huge impact on weather for countries in the northern hemisphere. How does growing ice in Antarctica help counter the decline in Arctic ice and the associated impact on weather in the northern hemisphere?
Chris says:
…there is no such thing as 2006/2007 when it comes to a low year… They can’t both be the lowest. &etc.
Chris, you are splitting hairs, and I know why: because that kind of nitpicking is all you’ve got.
Look at this graph. You will seee that 2006 – 2012 was the low point in Arctic ice over the past 15 years, and 2007 was lower than 2006:
http://www.climate4you.com/images/IRAC%20JAXA%20ArcticSeaIceExtentSince20020601.gif
And here we see that 2006 was not as low as 2007:
Sorry about your climate panic over “ice”, but Arctic ice isn’t disappearing. What the recent, temporary decline shows is a normal cyclical fluctuation — which is fully offset by Antarctic ice, and which is something you really wish we wouldn’t mention.
Chris is upset that I would post contrary information debunking his belief in “dangerous AGW”. Chris says:
…about the Antarctic – why do you always bring that in on threads about the Arctic?
Because, Chris, the basic debate is about anthropogenic GLOBAL warming: “AGW”. You are trying to limit the discussion to one cherry-picked location. But there are two Poles on the globe, and if there is global warming, then they are both fair game. Wadhams does the same thing. It’s called “confirmation bias”. And I note that there are very few climate prognosticators who have been as consistently wrong as Peter Wadhams. He is a perfect contrary indicator. If he says there is a problem, you can be sure there isn’t.
Climate alarmists cling to “Arctic ice” like a drowning man clings to a stick. But when we look at global ice, we see that it is completely normal, which deconstructs the wild-eyed alarmist predictions:
http://www.climate4you.com/images/NSIDC%20GlobalSeaIceAreaSince2000.gif
It amuses me no end to see people running around in circles and clucking about “ice”. They sound like Chicken Little yelling that the sky is falling. But it isn’t; it was only a tiny acorn that conked Chicken Little on the noggin. The Arctic “ice” scare isn’t even an acorn, Chris. Really, it’s nothing.
DBStealey:
You’re confusing 2 different sorts of ice.
Antarctica has 10x the mass of LAND ice that the northern hemisphere (mostly Greenland) does. The Antarctic LAND ice is declining, as observed by the GRACE mission, as is Greenland’s mass.
The SEA ice, which is what your graphics are for, and the trend lines you show are for, is declining in the Arctic, increasing in the Antarctic. Masses … well, haven’t redone the computation, but the Arctic, back when it averaged around 7 million km^2 ice at the seasonal minimum, also averaged about 3 meters thick at that time. Versus the Antarctic, whose minimum was (and still is) about 4 million km^2 of ice only about 1 meter thick. So, back then, the Arctic had about 5x the sea ice mass of the Antarctic.
The sea ice is trivial in mass compared to the land ice. Antarctic continent is about 10 million km^2, averaging far over 1000 meters of ice thickness.
Robert Grumbine said:
You’re confusing 2 different sorts of ice… The Antarctic LAND ice is declining…
Since there is no Arctic land ice, that comparison is meaningless.
The people of Greenland will be surprised to hear that they’re not in the Arctic.
In any case, it was your comparison to say 10x ice mass in the Antarctic. That’s only true for land ice (and only if you do include Greenland), but you gave sea ice plots.
Robert G says:
…you gave sea ice plots.
Yes. Note the article’s title.
I was being generous, and trying to find a way where you weren’t wrong to say 10x ice mass in the Antarctic.
For sea ice, you’re simply and strikingly wrong.
Robert Grumbine says:
I was being generous, and trying to find a way where you weren’t wrong to say 10x ice mass in the Antarctic.
Sure you were. It’s always a pleasure meeting such a generous person.☺
Depending on several factors such as the time of the year, which year in particular is being discussed, etc., Antarctic ice volume is ≈30,000,000 cubic kilometers, compared with the Arctic’s ≈3,000,000 cubic kilometers.
Those numbers vary a lot, but they are in the ball park. Thus, the Antarctic has ≈10X the volume of ice that the Arctic contains.
Next:
For sea ice, you’re simply and strikingly wrong.
Let me help you dig that hole you’re in a little deeper, Robert.
Two of the graphs show sea ice, but I couldn’t easily find graphs that showed polar ice volume, which is what I wrote about. There are probably graphs of ice volume somewhere, but the ones I posted made my point just as well.
You can see that my comment you were replying to does not have the word “sea” in it. I only wrote about Arctic vs Antarctic “ice”. (Every time I see the hand-waving over “ice” I have to larf. As if the amount of polar ice has anything to do with human CO2 emissions; which is always the basis for the whole ‘dangerous AGW’ debate.)
There is a LOT more ice in the Antarctic than in the Arctic — including Greenland. The ratio is still about 10:1. But if it makes you happy I’ll give you half, and we can agree that it’s only 5:1. See, I can be generous, too.
So you brought up sea ice. But it doesn’t matter. In fact, I can’t understand why you’re arguing, except to try and say I was “simply and strikingly wrong.” Sorry for your failure; I was right, neener.
You also contradicted yourself when you wrote:
“I was being generous, and trying to find a way where you weren’t wrong to say 10x ice mass in the Antarctic.”
Because you also wrote:
“…it was your comparison to say 10x ice mass in the Antarctic. That’s only true for land ice”
So you claimed I was wrong when I pointed out that there is 10X more ice in the Antarctic… but then you said that’s true for land ice. Climate alarmists always get tangled up in explanations like that.
Actually, I wasn’t really referring to sea ice or land ice, but to ice volume. That’s a more relevant metric, wouldn’t you agree?
The measurements of ice volume are not precise, but it’s clear that the Antarctic has much greater ice volume than both the Arctic and Greenland combined. That observation supports my argument that while the Arctic lost ice (sea ice and volume) for several years, Antarctic sea ice, land ice, and ice volume has been steadily rising. Since the Antarctic contains so much more ice, it easily offsets the decline in the Arctic and Greenland.
Result: global ice is near its long term average. The basic debate is over global warming (which anyway stopped many years ago), so what we are observing is merely regional variability.
I don’t think I’ve ever seen a radiation budget for the Arctic specifically.
Yes, some sunlight will hit the Arctic ocean when it is exposed, but the Arctic ocean also radiates accumulated heat energy out into space much more than it would if it were covered by an ice sheet.
It seems that if Arctic sea ice extent is a major concern, then there should be an exact radiation budget that has been calculated to show exact how much net energy increase to expect (+ for increased solar, – for increased heat radiation to space) for any given latitude.
I’m a bit surprised that nobody has mentioned some of Professor Wadhams somewhat more looney statements.
Comparison of temperature over the North Pole in 2014 and 2015.
http://ocean.dmi.dk/arctic/plots/meanTarchive/meanT_2014.png
http://ocean.dmi.dk/arctic/plots/meanTarchive/meanT_2015.png
Comparison of temperature over the North Pole in 2014 and 2015.
You can go all the way back to the 1950’s and see exactly the same graph. Since their 80 north temperature record began, the DMI summer air temperature has NEVER changed! (Winter temps go up by about 5 degrees, and vary greatly from day-to-day, but the summer temperatures are going down slightly since 1988.)
Wren,
Comparison of temperature over the ‘North Pole’ in 1968 and 2015.
http://ocean.dmi.dk/arctic/plots/meanTarchive/meanT_1968.png
http://ocean.dmi.dk/arctic/plots/meanTarchive/meanT_2015.png
This shows what is to me the most interesting thing that’s going on in the Arctic.
Which is “whats been keeping a cap on the summer temps from going higher”.
As its clear from the graph what warming there as been in the Arctic as been confined to the winter months.
l wonder does this have any link with the increase in night shinning cloud.
taxed
September 16, 2015 at 3:29 pm
See
Arctic clouds reflector
http://earthobservatory.nasa.gov/Features/ArcticReflector/arctic_reflector4.php