OVERVIEW
In a number of posts, we’ve discussed and illustrated the difficulties with ocean heat content data. (There are links to those earlier posts at the end of this one.) The data presented in this post is supported by the 2012 Levitus et al paper World ocean heat content and thermosteric sea level change (0–2000 m), 1955–2010 [8.1 MB].
One topic discussed but not illustrated (until now in Figure 1) was that the annual variations in temperatures at depths between 700 and 2000 meters were in terms of hundredths if not thousandths of a deg C and that it was unrealistic to think we could measure the temperatures of the oceans at depth with that type of accuracy. It turns out that the annual variations are typically in thousandths of a deg C. The total scale of the temperature anomalies of the graph in Figure 1 is two one-hundredths of a deg C.

Figure 1
Keep in mind that Figure 1 presents the approximated changes in annual temperature for the depths of 700-2000 meters—not the anomalies. The annual changes are determined simply: by subtracting the value of the previous year from the value of the year being plotted.
The ocean temperature data for the depths of 700-2000 meters is an important topic. With the surface temperatures no longer warming and with the slowdown in the rate at which the oceans are warming at depths of 0-700 meters, climate scientists are now saying the missing heat is being forced to depths below 700 meters. Of course, that assumes the missing heat actually exists.
DATA AND METHOD
The NODC provides vertically averaged temperature anomalies for 0-700 meters here, and for the depths of 0-2000 meters here. To use that data to determine the variations in temperatures at depths between 700 and 2000 meters we need to know the volume of water in the depth ranges of 0-700 meters and 0-2000 meters. In reality, we don’t necessarily need the volumes. We can work with percentages.
According to an EPA document about ocean heat content data (here):
…the top 700 meters of the ocean (nearly 2,300 feet)…accounts for just under 20 percent of the total volume of water in the world’s oceans.
“[J]ust under 20 percent” could mean many things, so we’ll use the rounded figure of 20%.
Then on the last page of the NOAA presentation here, under the heading of “ARGO Future Possibilities”, they have the bullet point:
-52% of ocean volume below 2000 m
That obviously means that about 48% of the ocean volume is above 2000 meters.
Assuming those percentages are close to being correct, that means 41.66 % of the volume of the oceans to depths of 2000 meters comes from the top 700 meters and 58.33% at 700-2000 meters. I told you this was a rough estimate. So now we can use a simple weighted-average equation, where you solve for one of the components, to determine the changes in ocean temperature for the depths of 700-2000 meters. The result is illustrated above in Figure 1, and the data is presented as the annual change in temperature.
PUTTING THAT IN PERSPECTIVE
Figure 2 compares the annual changes in global sea surface temperature anomalies (HADSST3) and the vertically averaged temperatures of the global oceans to depths of 0-700 and 700-2000 meters.

Figure 2
In Figure 3, the data has been returned to their standard time-series form and I’ve added global land+sea surface temperature anomalies (HADCRUT4) as a reference. All of the data have been zeroed at 1955.

Figure 3
Many persons find it hard to believe that global surface temperatures can be estimated to the values shown. They’ll certainly have difficulty with the warming shown at depths of 700-2000 meters.
THE NODC’S HOCKEY STICK WHEN THEY TRANSITION TO ARGO DATA
Figure 4 presents the vertically averaged temperature anomalies for the global oceans for the depths of 700-2000 meters. They warm at a relatively constant and very slow rate until the ARGO floats begin the have complete coverage of the global oceans around 2003. Then they warm at a rate that’s almost 24 times faster than the rate seen in the 5 decades leading up to it.

Figure 4
It doesn’t look very realistic, now, does it?
IS THE HOCKEY STICK DEPENDENT ON THE PERCENTAGES USED?
Let’s assume that the percentages I discovered online are wrong, and that the relationship of the volumes of the oceans at depths of 0-700 meters and 0-2000 meters is a linear one. That is, we’re going to assume that there are no continental shelves and that the volume of the oceans from 0-700 meters is 35% of the volume from 0-2000 meters (700/2000 = 0.35). Therefore, in our hypothetical example world, the volume of water from 700-2000 meters represents the other 65% of the depths from 0-2000 meters. Plugging those percentages into our standard weighted-average equation presents the curve shown in Figure 5. The hockey stick still exists, but it’s not as pronounced.

Figure 5
IS THE NODC FOOLING ITSELF WITH THE PENTADAL DATA?
Or are they trying to fool us?
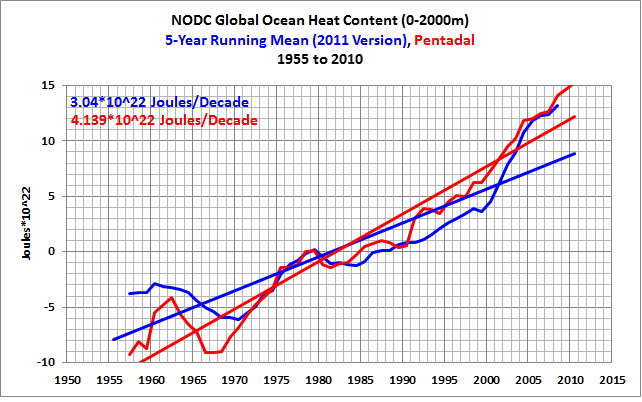
In past posts (here and here), we showed how the NODC increases the warming rate of their ocean heat content data by presenting it in pentadal form. See the comparison graphs at depths of 0-700 meters (here) and 0-2000 meters (here). Figure 6 compares the roughly estimated vertically averaged temperature anomalies for the global oceans, for the depths of 700-2000 meters, from 1955 to 2012, in annual and pentadal forms. The same percentages of ocean volumes at depth (0.4166 for 0-700 meters and 0.5833 for 700-2000 meters) were applied to calculate both. In this comparison, I did not smooth the annual data because I wanted the break point in 2002 to be visible.

Figure 6
Not only does the data in pentadal form have a significantly higher warming rate, but its curve bears little resemblance to that of the annual data.
CLOSING
To account for the slowdown the warming of surface temperatures and in the heat content of the upper 700 meters of the global oceans, the climate science community is claiming manmade global warming is bypassing those levels and warming the oceans at depths below 700 meters. But that warming of the subsurface temperatures of the global oceans from 700-2000 meters represents variations measured in thousandths of a deg C. It is not reasonable to think we can measure the temperatures of the global oceans to that accuracy. Now consider that ocean heat content data have to be adjusted—tweaked, modified, corrected, whatever—in order for it to show warming during the ARGO era. (The UKMO EN3 data in the graph here should represent the uncorrected ARGO era data for depths of 0-2000 meters.)
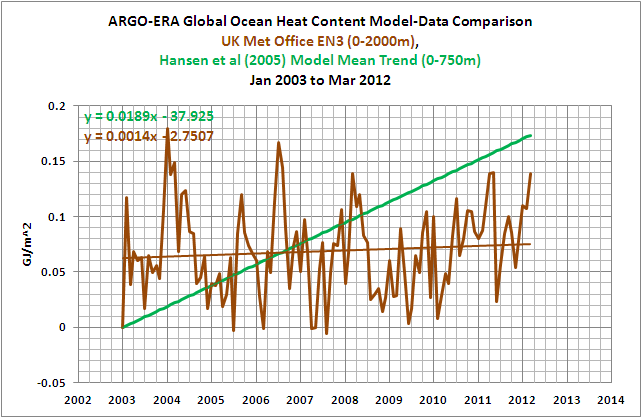
The vertically averaged temperatures for the depths of 700-2000 meters can be approximated from their data for the depths of 0-700 and 0-2000 meters. It shows a very sudden shift in the rate of warming for depths of 700-2000 meters. The shift coincides with the introduction of the ARGO floats to rarely sampled portions of the global oceans—the mid-to-high latitudes of the oceans of the Southern Hemisphere, for example. This suggests that the warming presented by the data at those depths may result from the more-complete sampling of the global oceans.
We’ve discussed the problems with ocean heat content data in numerous posts over the past few months. They include:
Is Ocean Heat Content Data All It’s Stacked Up to Be?
Ocean heat content for the depths of 0-2000 meters is not a dataset in which one should have any confidence. It appears that it was introduced solely so that global warming enthusiasts could claim global warming continues.
B0b: Want me to have a look in the same way with these data as the ENSO?
I cannot imagine a process that would ”force” the heat lower into the ocean depths.
For the ocean water to suddenly warm at 24 times the normal rate would require either 24 times the heat input and no solar increase to anywhere of that order has been observed, or an alteration of the physical properties of the water.
Whatever, their estimates are very rough.
Thanks Bob.
RichardLH, data exists so that it can be examined. Keep in mind, though, that ocean heat content data, because it’s been modified beyond recognition, could be considered make-believe data. In reality, you may be wasting your time.
Regards
When did humans start measuring ocean temperatures at the levels described in this post pre-the ARGO buoys? Or am I missing something?
Don’t the Argo buoys go with the current.
And wouldn’t the currents naturally flow from colder to warmer, as the warmer upwells.
Maybe this is what the Argo buoys are seeing.?
I have earlier read that UNEP is working to get the “scientist” that study Ocean will get a place in the UN system together with WMO.
I wonder if it’s for what they have done or for the Things they are going to do, or both?, for the Team and the cause?
A thousandth of a degree here, a thousandth of a degree there, and pretty soon, you’re talking about real temperatures. (All apologies to Everett Dirksen.)
Do they present the data in pentadal form on the basis that as there is no such word, nobody can calim it is incorrect?
Patrick says: “When did humans start measuring ocean temperatures at the levels described in this post pre-the ARGO buoys? Or am I missing something?”
Before ARGO, disposable devices (known as XBTs), tethered to long wires, were dropped over the sides of ships and used to measure temperatures at depth. The following animation shows the locations of the samplings at depths of 1500 meters (6MB):
http://bobtisdale.files.wordpress.com/2013/03/nodc-temp-obs-at-1500m.gif
As you can see, there were few measurements at those depths prior to ARGO.
The animation is from this post:
http://bobtisdale.wordpress.com/2013/03/11/is-ocean-heat-content-data-all-its-stacked-up-to-be/
Regards
Happy Independence Day to all USA citizens.
It seems that we need head capacity per meter of ocean depth and atmospheric elevation to make sense of these data. If the information was put into the form of Terawatts needed to raise the temperature of the first 700 meters of ocean, the 700-2000 meters of ocean, and the atmosphere at near surface, to 14000 ft (Lower Troposphere), Upper troposphere, and stratosphere. With total changes in heat content, it is easier to understand the path of heat flow. The much lower heat capacity of the near surface atmosphere compared to the heat capacity of the upper ocean shows that atmospheric temperature measurement are not nearly as significant as ocean temperature measurements.
buhovda says:
“I have earlier read that UNEP is working to get the “scientist” that study Ocean will get a place in the UN system together with WMO.”
More likely to ensure that he is free from FIOA requests and has dimplomatic immunity, putting him beyond any country’s national law.
Mind you, if Peter Gleick is anything to go by, climate scientists already seem to be beyond the reach of the usual criminal law. At least in the USA.
In your figure 3, what have sea surface temperatures to do with the issue at hand: ocean heat content?
Given the heat capacity of water, and if one knew the volume being affected (which I don’t know), if this energy were to be put into the atmosphere I wonder how much the deep ocean warming would translate to in terms of atmospheric temeprature (which has a much lower heat capacity).
And figure 2, I may add.
vukcevic,
Thank you, and Happy Dependence Day to you from America! ☺
@Tisdale et al – significant digits, significant digits, significant digits!!! Just because your calculator gives you 3, 4,…10 significant digits doesn’t mean they have any significance.
So, because ~20% is exactly that, about 20% = ~2.0×10^1% or 1 significant digit and 41.66% = 4.166×10^1%, 3 significant digits, it’s really 42%, 1 significant digit.
This applies to the temperature measurements, too! Looking at figure 1, if the temp sensors are accurate to say ±0.1° reporting changes smaller than that from an average is meaningless since they all lie well within the error range. It looks informative, but it is meaningless. Just like the “adjustments” and data “homogenizations” the official agencies make to the raw data.
Bob, shouldn’t the annual changes be summed to give us the accumulated heat in the period under consideration? There is also since 2010 and apparent all positive increase. Is this real or is this potentially cooked to find the missing heat (Trenberth’s life mission since the “travesty”).
Interesting, Bob.
Could you show exactly how you are calculating this. Verbal descriptions are not good for explaining mathematics. Are you, for example, assuming a linear temp gradient from 0m to 2000m . That would lead to substantial error.
The curve and values looks very much like a semiconductor fade issue as they drift out of calibration: all in the same direction, semiconductor manufacturing does have some random elements but guardband issues are usually on one side or the other..
I suspect a .01% delta would not be noticed if a multiyear old device was re-checked.
Have they published a lifetime, measured calibration curve for the Argo units and the error trend found when they checked/recalibrate the devices?
This, of course, should be for “assumed working” devices;
=> failing devices are likely to be entirely different as the failure mode may have little to do with the expected electronic slew.
AndyG55 says: “Don’t the Argo buoys go with the current.”
Yup. You can see the ARGO floats following the currents in the following animation of temperature samples at depth (500m) starting in 2003 (I set it so that it plays kind of fast so that the movement was visible).
http://bobtisdale.files.wordpress.com/2013/07/argo-era-sampling-at-500m.gif
AndyG55 says: “And wouldn’t the currents naturally flow from colder to warmer, as the warmer upwells.”
A few things: (1) Currents also flow from high latitudes (colder) to the tropics (warmer). (2) The NODC presents OHC, temperature, sea level and salinity data as anomalies, not absolutes. (3) Upwelling typically occurs along the coasts and along the equator, where cooler waters from below the surface are upwelled to the surface.
Susan Corwin says: “Have they published a lifetime, measured calibration curve for the Argo units and the error trend found when they checked/recalibrate the devices?”
I ran across a paper yesterday that discusses the numerous corrections that need to be made to ARGO data. Unfortunately, I only glimpsed at the minimum text on the search results through Google and didn’t bother to download the paper. I also can’t find it at the UCSD ARGO website:
http://www.argo.ucsd.edu/
“Bob Tisdale says:
July 4, 2013 at 6:51 am”
Thanks for the response Bob, my question was rather rhetorical. British Royal Naval records, unavailable to mere mortals, suggests alarmism, is, well, alarmism.
The Argo floats were originally reporting decreasing ocean temps. The scientists “knew” this was wrong, so they eliminated the floats showing the greatest cooling. Clearly, this is selection bias. The scientists got the answer they expected – warming – because they eliminated those floats that told them otherwise.
The floats are not perfect. They are electro-mechanical devices. Some will read high, some will read low, and some will read true. Over time there will be drift. Some high, some low. In general the errors will be randomly distributed. The high errors will balance out the low.
However, when you eliminate some of the floats based upon the reports they are providing, you are skewing the error distribution. It is no longer random and the low errors will not balance out the high errors. Instead you will get a result that shows warming – but the result is spurious. It is a result of you selection method, not a result of actual warming.
This is a classic case of “kill the messenger”. When a king executes only the messengers than bring bad news, pretty soon all he will hear will be good news. In this case the scientists eliminated the “cooling” messengers, and pretty soon all they were hearing was “warming” messengers.
I don’t see how CO2 infrared can heat deep water very much, if at all. I’m not like some that say it can’t heat water at all, but it certainly can’t penetrate the way sunlight does. Its warming would be limited to the thin surface (plus added water vapor), IMO.