By Joseph D’Aleo, CCM
Tuesday was an active severe weather day with 29 reported tornadoes (preliminary).

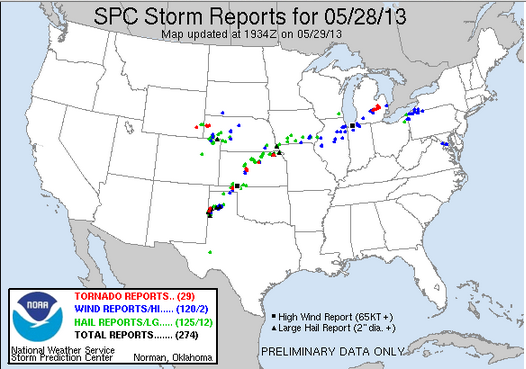
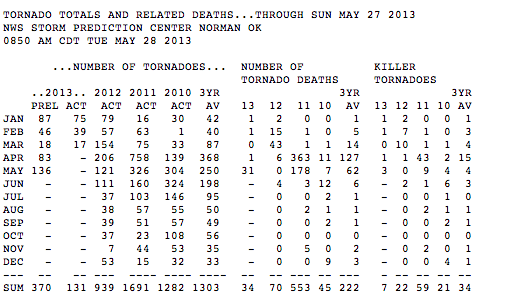
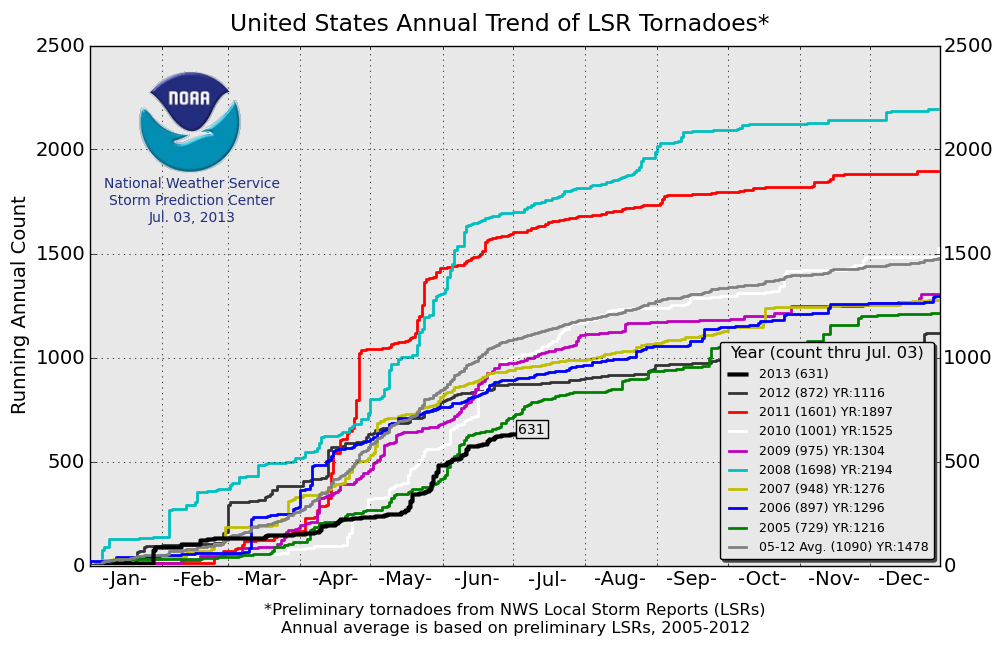
But for the season thus far, we are at the bottom end of the frequency as of the date. When it was active in 2011, the ignorant and opportunists blamed it on global warming. Last spring was very warm and activity was way down. This year, spring ranked among the coldest and activity was very low and only recently has picked up as warmth finally began pushing north to clash with the colder air to the north.
It is in the region of CONTRAST that the jet stream is energized and severe weather occurs. When it is too warm or too cold from north to south, activity is depressed. Global warming would diminish the contrast north to south and result in weaker storms, a weaker jet stream, fewer tornado outbreak and strong EF3-5 tornadoes.


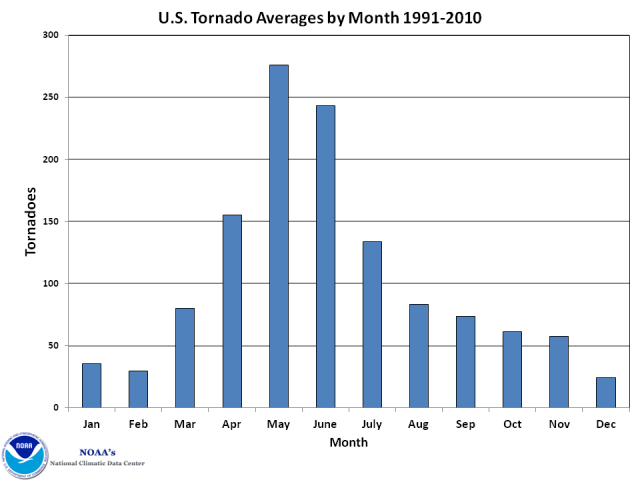
We are passing the peak of the severe weather season. The delayed shift north of the jet stream and alternating cooler and warmer weather will allow for some catch up.

See the activity year to date this year


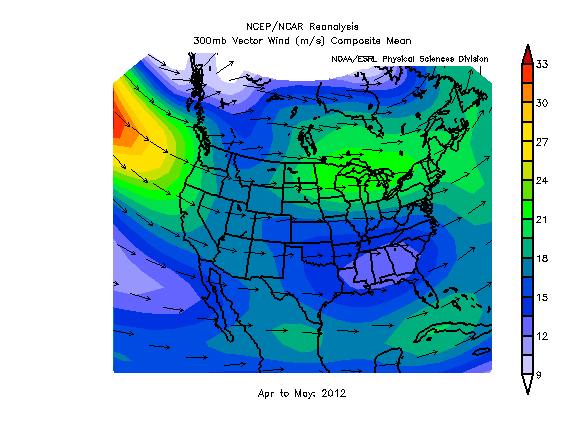
See how suppressed the 300mb jet stream has been on average.

See the activity last year (whole year).


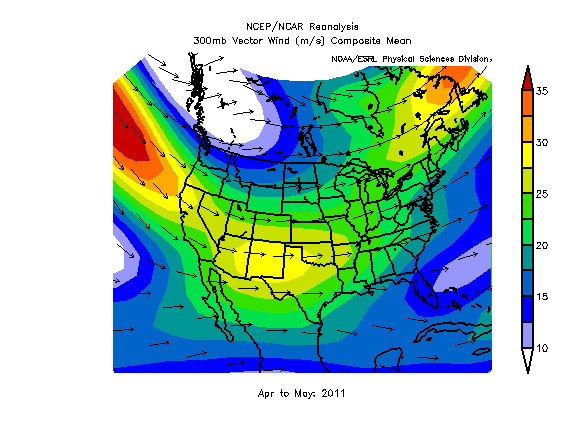
See how far north and weak the jet stream was. Tornadoes were above normal in southern Canada, below in the CONUS.

In 2011, coming off the strongest La Nina since the 1950s or early 1970s, the jet stream was ideal for severe weather with a southern jet and northern jet. Tornadoes were favored to the left front of the southern jet and right rear portion of the northern one. That is where upper divergence is favored.


See how the negative PDO which favors La Ninas by 2 or 3 to 1 and favors stronger (EF3-5) tornadoes (and more big outbreaks) correlated well with the EF3-5 counts.

Discover more from Watts Up With That?
Subscribe to get the latest posts sent to your email.
Oh what sadist puts a white line on a gray background graph…
You don’t suppose that the lunar declinational angle dropping below 20.5 degrees at culmination has had some effect on the position of the jet streams, and then the production rate and location of the tornado outbreaks?
http://research.aerology.com/lunar-declinational-affects-on-tornado-production/
A close up of the graph for the cyclic pattern of tornado production from past cycles up to 2011 (the yellow spheres) the next year would be last year or 2012,(not yet updated with the actuals) then the next would be 2013, this years expected declinational angle driving the effective jet stream positions and interactions across the fronts. We are currently about day 2737 on the bottom scale. I would say that if the trend holds the numbers of tornadoes will continue to decrease for the next four years up to 2017 or 2018 when total tornado production will start to rise again.
http://research.aerology.com/wp-content/uploads/2010/03/6558days-cycle.jpg
It doesn’t surprise me that models based on average stats do no better than random especially with their warming bias programing.
If temperatures in the area are not rising (or the temperature differentials not increasing), it is difficult to make a case that AGW is driving the increase in adverse weather.
I do not know how the temperatures have behaved on a regional basis say during the past 10 or so years, but if they follow the global average, then they have been in statsis and therefore what has changed between the beginning of this century to date?
Thanks, Joseph.
Now the question will be, will Chicken Little listen to the king, and believe the sky is not falling?
“See how the negative PDO which favors La Ninas by 2 or 3 to 1 and favors stronger (EF3-5) tornadoes (and more big outbreaks) correlated well with the EF3-5 counts.”
Funny, I see no correlation in that graph. It more says to me that the PDO has no relation to large-tornado frequency. Are we grasping at straws? Maybe take a look at how many south-bound then northward bend in the jet stream over mid-US occur in April-June, there you might find a close correlation. IIRC, during the 70’s, a jet stream over the Texas-Oklahoma border was very common and was always mentioned by the meteorologists in that era. Something there?
I really do not understand why the scientific community associated with climate science cannot see that historically cold weather is responsible for more death and destruction than warm weather by a long shot. And that by the middle of this century we could see winter drag on a month longer spawning even more deadly frontal boundaries.
LT, of COURSE they see that! But supporting the idea of ever warming weather is responsible for far more funding and career opportunities than supporting the idea of cooling, and that’s all that matters to them anymore.
When the scare dies out, most of them will be unemployed, and they know it.
… Global warming would diminish the contrast north to south and result in weaker storms, a weaker jet stream, fewer tornado outbreak and strong EF3-5 tornadoes….
So, what you’re saying is that, if global warming were happening we would expect weaker storms, and we’re GETTING weaker storms?
Don’t let Skeptical Science hear you saying that ….
The last plot is interesting and there does seem to be correspondence between the dips in PDO and rising tornado count. This may be clearer if the temperature was shown inverted, as here:
http://climategrog.wordpress.com/?attachment_id=257
HadCRUT NH may not be the most relevant dataset to choose but it illustrates the point.
comparing the record of different force categories shows >= EF3 to be consistent, excluding often cited concerns about reliability of the data.
http://climategrog.wordpress.com/?attachment_id=255
Talking about weather events, here in Sydney, Aus, we’ve had three continuous days, yes that’s right, three days of foggy starts to the day. The sun usually burns it off by the afternoon. It’s caused traffic chaos, especially ait the airport (I am sure automatic landing technology was developed in the 1960’s to land aircraft specifically in fog at London Heathrow). There was one a week ago or so before but it’s been a while since I have seen a “pea souper”. So, if my memory serves, fog in winter in a costal area, is caused buy warm/moist air blowing over a cold body of water. The Tasman sea is cold this year?
The other thing to note is that there is a very different correspondence to temperature changes during the pre-1974 cooling period than during the later warming phase.
Dodgy Geezer
You are a little behind the curve. Alarmists are claiming that bad weather is caused by increasing CO2 because they can see that a cold PDO, a cold AMO (coming), and a quiet sun are likely to produce wild weather (1950s style), which can then be claimed as proof of AGW.
Ron C., I must disagree on the point where you’ve stated that Alarmists “see” anything coming at all. It is the time-honored mantra of shrieking attention seekers, from Savanarola to Jim Jones to Chicken Little (who they have the most in common with) to claim “THE END IS COMING! FAMINE, FIRE, FLOOD!!! REPENT, YE WICKED, THAT YE MAY BE SAVED!!!”
It is an old, old act, but you know what P.T. Barnum said. It’s basically that Good Ol’ Fundamentalist Religion for people who tell themselves they’re Too Smart to fall for a hellfire and brimstone preacher. Kind of humorous, really, that one of the central doctrines of this New Faith is that everyone who holds it is, by definition, Smarter than everyone who doesn’t. (In fact, that attitude is the best way to spot the True Believers.) That’s actually an Old, Old, Religion, too, although it used to have a different name. Kind of funny how it keeps popping back up, you’d almost think it appeals to some basic dark side of human nature or something.
I’m with wayne, I don’t see a correlation either. Sometimes the dips in pdo lag the count peaks, sometimes the count peaks lag the dip in pdo. Sometimes the increase in counts continues into the spike in pdo sometimes it doesn’t.
Good work Joe – nice to hear from you again.
In the mean-time the UK Met Office has had to eat more crow with this report…
2013 – Coldest spring for more than 50 years
http://www.metoffice.gov.uk/news/releases/archive/2013/cold-spring
Time for our sun to come out of his slumber and start to warm us up a bit.
Would someone please explain how the fact that 20 years ago basically only tornados that caused destruction/damage were counted, If it was not seen by a “Certified Observer” – IT was not counted. Even if there was an obvious path of destruction and the farmer swore there was a tornado – IT DID NOT COUNT (kind of like “does a tree falling in the woods make noise if no one is around”). About 20-25 years ago they started a tornado sighting certification program. Now, in frequent tornado states, most police officers are “certified,” many Amateur Radio Operators are “certified,” the “Storm Chasers” are “Certified” (helps sell their films,) and even volunteer fireman, etc. are certified. Surely all of these “certified” sightings has to affect the increase in numbers over the last 20 years.
The “Enlarged” link on the third chart is linked to the wrong file. It should show 2013 todate, but links to as of Aug. 26, 2012.
Breaking down the regional location of tornados is key. It is local weather not global weather that causes tornados. Trenberth pushes the “warmer and wetter” world but global water vapor is on the decline and dominated by El Nino. Correct me if I am wrong, but tornados seem to happen where a strong advancing cold front triggers vertical lift and violent thunderstorms. Cold waves rapidly advance when the ground is cold and snow covered and the early May snow storms allowed a surge of cold air and provided the ground moisture to feed the storm locally.
Its still not fully explained the precise mechanisms to cause a thunderstorm to rotate, but the jet stream and regional topography seems key to creating the rotation that turns a thunderstorm into a tornado. I thought your mention of increased tornados in Canada and fewer in CONUS was a gem. Do you have a link? During a La Nina year the Jet Stream gets pushed further north and loop back down further east. The huge tornado outbreaks in 1974 happened due to a combination of strong advancing cold front and during La NIna Year when the jet stream looped back down further east. Most of the damage in 1974 was further east around Ohio.
The 2012 La Nina kept the jet stream further north and blocked moisture from reaching the southern Great Plains, so there was little moisture and a high pressure that caused a dearth of tornados in the southern great plains. I suspect that despite an increase in Canadian tornados, they are much less common due to their distance from the source of warm Gulf air
With ENSO neutral this year, but a cold PDO and strong Pacific HIgh, the jet stream at 300mB was pushed northward and California was dry. But as spring approached the ocean land contrast faded more readily relative to a PDO-/LA Nina year in 2012, Around May 18th that breakdown in the thremal contrast allowed the jet stream to dip and split and curled right over Oklahoma. San Francisco State has a great website with a do it yourself animation to recreate the jet stream. Go to http://squall.sfsu.edu/scripts/jet_big_archloop.html
Last three years prove AGW is not responsible for tornadoes.
feynman: there is no proof in science.
weird that D’Aleo would suggest that the science on this was settled. Somebody revoke Joe’s skeptic card.
Chris4692 says:
May 30, 2013 at 7:07 am
See how the negative PDO which favors La Ninas by 2 or 3 to 1 and favors stronger (EF3-5) tornadoes (and more big outbreaks) correlated well with the EF3-5 counts.
I’m with wayne, I don’t see a correlation either. Sometimes the dips in pdo lag the count peaks, sometimes the count peaks lag the dip in pdo. Sometimes the increase in counts continues into the spike in pdo sometimes it doesn’t.
I agree “correlate” is a strong word for a few dips lining up. “correlated well” I would suggest is overstating the evidence, a wee little bit.
http://climategrog.wordpress.com/?attachment_id=257
There is a relationship to be had there . The main one I see being warming periods have less activity than cooling periods.
I think that is main point Joe is trying to make. He probably ought to be careful about claiming short term correlations.
Growing up in the south, in Alabama in the middle of tornado alley we always knew that the worst times were not when it was warm and not when it was cold, but in those times when the two clashed. What part of this do these climate scientists not get?
“See how the negative PDO which favors La Ninas . . . ”
I don’t follow this bit about the PDO and it seems to be a distraction. The graph below the note (blue bars with heavy red line for the PDO) offers nothing about La Niñas and otherwise seems to be an overlay of unrelated data.
Paul Homewood [not a lot of people know that ] recently posted about tornado history. Here is one:
http://notalotofpeopleknowthat.wordpress.com/2013/05/08/long-term-tornado-trends/
There are a couple of others – just search the site –
His posts are clearly stated.
The PDO is a definite player in tornado formation but the correlations get murky by “global averaging” or in this case regional averaging. All tornados evolve from supercell thunderstorms. The triggering mechanism is usually a cold front that lifts the moist air. The more violent storms develop when there is a vigorous updraft, which requires dry cold air above and warm moist air below. Moist air has cools twice as slowly as dry air. When a cold front lifts moist air into an upper level of dry cold air it allows “free convection” creating violent updrafts. The PDO and La Ninas controls the location of that dry cold upper level air.
During a -PDO/La Nina the stronger Pacific High forces the jet stream northward over the Canadian Rockies and then it turns southward further east. A jet stream descending from Canada delivers cold dry upper level that contrasts with lower level moist air that is ideal for tornados. Typically those conditions will develop more often in eastern Great Plains during a -PDO/La Nina and the western Great PLains experience a more uniform air mass vertically. However during a -PDO/neutral El Nino, the blocking Pacific High is weaker and allows westerly winds to flow straight across the Rockies espicially in the spring when the ocean land temperature contrast weakens. This delivers cold dry upper level winds to Oklahoma and produces the contrasting vertical structure needed for violent tornados. Climate is regional not global!
I find myself in reluctant agreement with Mosher. Along the lines of Feynman, I would instead say that that theory is wrong.
Anyone interested in following the activity in Oklahoma this afternoon, at present they are following several storms that fired up along the dryline within the last hour and are now displaying typical rainfree, cloudbase ‘lowerings’ (i.e. “wall clouds”) from which tornadoes can develop:
http://kfor.com/on-air/live-streaming/
.