The Warning in the Stars
By David Archibald
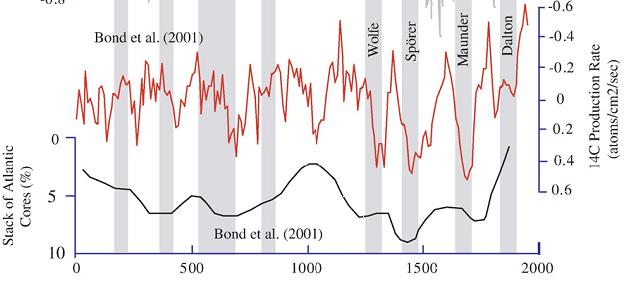
If climate is not a random walk, then we can predict climate if we understand what drives it. The energy that stops the Earth from looking like Pluto comes from the Sun, and the level and type of that energy does change. So the Sun is a good place to start if we want to be able to predict climate. To put that into context, let’s look at what the Sun has done recently. This is a figure from “Century to millenial-scale temperature variations for the last two thousand years indicated from glacial geologic records of Southern Alaska” G.C.Wiles, D.J.Barclay, P.E.Calkin and T.V.Lowell 2007:

The red line is the C14 production rate, inverted. C14 production is inversely related to solar activity, so we see more C14 production during solar minima. The black line is the percentage of ice-rafted debris in seabed cores of the North Atlantic, also plotted inversely. The higher the black line, the warmer the North Atlantic was. The grey vertical stripes are solar minima.
As the authors say, “Previous analyses of the glacial record showed a 200- year rhythm to glacial activity in Alaska and its possible link to the de Vries 208-year solar (Wiles et al., 2004). Similarly, high-resolution analyses of lake sediments in southwestern Alaska suggests that century-scale shifts in Holocene climate were modulated by solar activity (Hu et al., 2003). It seems that the only period in the last two thousand years that missed a de Vries cycle cooling was the Medieval Warm Period.”
The same periodicity over the last 1,000 years is also evident in this graphic of the advance/retreat of the Great Aletsch Glacier in Switzerland:

The solar control over climate is also shown in this graphic of Be10 in the Dye 3 ice core from central Greenland:

The modern retreat of the world’s glaciers, which started in 1860, correlates with a decrease in Be10, indicating a more active Sun that is pushing galactic cosmic rays out from the inner planets of the solar system.
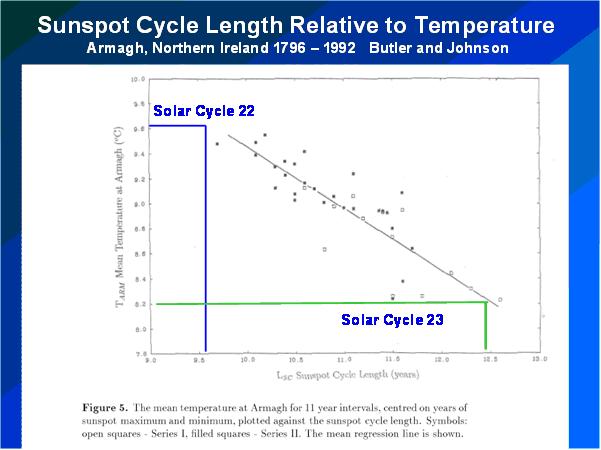
The above graphs show a correlation between solar activity and climate in the broad, but we can achieve much finer detail, as shown in this graphic from a 1996 paper by Butler and Johnson (below enlarged here)::

Butler and Johnson applied Friis-Christensen and Lassen theory to one temperature record – the three hundred years of data from Armagh in Northern Ireland. There isn’t much scatter around their line of best fit, so it can be used as a fairly accurate predictive tool. The Solar Cycle 22/23 transition happened in the year of that paper’s publication, so I have added the lengths of Solar Cycles 22 and 23 to the figure to update it. The result is a prediction that the average annual temperature at Armagh over Solar Cycle 24 will be 1.4C cooler than over Solar Cycle 23. This is twice the assumed temperature rise of the 20th Century of 0.7 C, but in the opposite direction.
To sum up, let’s paraphrase Dante: The darkest recesses of Hell are reserved for those who deny the solar control of climate.
This essay is also available in PDF form: TheWarningintheStars
Discover more from Watts Up With That?
Subscribe to get the latest posts sent to your email.
Hmmmn.
Doesn’t Bond (2001) all by itself break Mann’s hockey stick?
What did the temps do between cycle 1 and 2? 2 and 3? 3 and 4? As for the other graphs, what is the significance? How does C14 and other measures relate to temperature? Finally what were the climate mechanisms operative at the time? I mean all the mechanisms, not just solar mechanisms.
In the first graph, it appears that C14 levels peak and trough in both greater levels, and over larger time scales over time. Is data available for further back, and could this indicate solar cycles on a larger scale? Could we perhaps have seen similar data and the end of previous interglacial periods?
Thanks in advance.
Ten miles from Armagh Observatory and its cold tonight.
Since the earth is in the atmosphere of the sun it seems changes in the sun would make for changes on the earth.
Has everyone yet seen this documentary and the sun and climate on earth? I know there are new readers since ClimateGate.
in 5 parts in youtube
Leif Svalgaard, a noted solar physicist, has written a lot about the Sun. But he does not seem to believe the Sun-climate link theory. Can someone provide a link to Leif’s paper why this is so? Leif also does not seem to believe that SC 24 will behave like SC 5 (start of Dalton Minimum). Thanks.
OT, but has anyone else noticed the irony of the Google ads that appear here?
They all seem to be for hyper-green organizations.
I am all for conservation, but not for those who make wild, unscientific exaggerations to advance an anti-capitalist agenda. I know that I have never been tempted to click on one of these ads so thy are wasting their money.
These guys are nothing but Deniers! Quick, have Mann talk to editors of the journal and make sure they never get published again!
“a fairly accurate predictive tool.”
“The result is a prediction that the average annual temperature at Armagh over Solar Cycle 24 will be 1.4C cooler than over Solar Cycle 23. ”
=====
Predictions?, the data is chaotic at best.
There are 3-4 variables that could overwhelm the entire system depending on their intensity.
I.E. volcanic activity, our variable star, galactic interactions and/or a combination of all of these.
Predictions scare me, they got us into the AGW fiasco.
What a novel concept? Check and see what the furnace is up to instead of just yelling at the kids for jumping on the sofa!
I hope more research will be done about the sun, because the climate is clearly correlated with possibly a lot of complexity. The sun shines at different frequencies and different feedbacks could be discovered.
Here is an hypothesis which is probably wrong but might be worth testing:
1. A hot sun generates a lot of water vapor.
2. Dust particles and aerosols accelerates the rate of water vapor condensing to clouds.
3. When the sun is more powerful, the dust particles and aerosols get much warmer and cloud formation is lowered because the condensation on theses particles is lowered.
4. When the sun is hot, you have:
a. More water vapor in the air.(positive feedback)
b. Reduced cloud cover during the day.(positive feedback)
c. Cloud formation during the night because the dust particles and aerosols are colder and can condensate the high amount of humidity.(positive feedback)
If anybody knows the results of a study of this hypothesis, feel free to share.
This a pure Archibald, and also pure nonsense and cherry picking. You do not need to go any further than the very first Figure. The red curve is supposed to be solar activity [inverse 14C] and the gray bands solar minima. It is clear they don’t line up. Check for instance the dip of the red curve and the absence of a gray band and the high temperature around the year 1000. The rest is as bad. I would be ashamed to post junk like this, but that is, of course, only my humble opinion and David has his loyal flock, so stay tuned to hear the hymn from them.
The black line in Fig. 1 disagrees with the first figure in David Lappi’s article at
http://joannenova.com.au/2010/02/the-big-picture-65-million-years-of-temperature-swings/.
The black line suggests that the Medieval Warm Period was cooler in the North Atlantic than the climate around 1900, and David Lappi’s first figure suggests the Medieval Warm Period was much warmer than it was around 1900.
It’s a pretty interesting article.
It does seem like it’s hard to be conclusive about the solar insolation any time before 1978. Each approach gives a quite different result. Once you go back before observation of the sun with telescopes in the 1600s it’s even less certain. There are a few reconstructions with explanations in:
Here Comes the Sun.
In fact even picking up what might be significant changes after 1978 aren’t so clear as the changes are similar in magnitude to the errors in the on-board instruments!
But before 1978 the solar reconstruction really depends on the theory that’s applied. Like sunspots for example. So we have very detailed daily observations of sunspots and faculae (“bright spots”) back to 1870. People like Solanski & Fligge have worked out correlations between satellite measurements and observations – then applied these backwards. But as they note, the reconstruction is dependent on the assumption that the measured relationships have been the same for more than a century. Is that assumption correct?
Other measurements like Be10 seem to offer more – and have the advantage that we can measure back more than a millenium – but still there is more uncertainty than certainty.
Nonoy Oplas (16:42:38) : “believe”
“Believe” is the key to answer your own question. The sorts of things presented are intriguing but there are several suggested explanations as to why they are so. When you get down to one explanation that is supported by good science – check back.
Discontinuity vs. continuity, agnosticism vs.gnosticism, it seems a Dan Brown´s novel.
I agree with Leif. The presentation makes no sense. No lit review, or purpose of the study, no method or analysis, no discussion, no proposed mechanism, no suggestions for further research. Nothing. You said there is a correlation. Okay, if you did the calculations, what is it? And I don’t even want to discuss the cherry picked cycle and temperature plot. You have published? In peer reviewed journals? Are we that down low on your audience list that we rate this terrible piece of work?
How many comments will be posted before we see Archibald and those who believe him get into a boxing match with Leif?
Anyway regarding current happenings about the weather here and whether it’s been getting colder, we’ve had a generally below average January and February in Wichita at least, though it seems that lows above freezing and Spring arriving is just around the corner (the songbirds are returning and the daffodils are growing)
Leif @ur momisugly 17:42:44
Steggles puts a beetle down Harold’s back.
=======================
I’m not as harsh, perhaps, as Leif, but I think, for the prediction of a 1.4C decline in temperature, it is reasonable to ask what the prediction interval is.
Here is something written by Harrison Schmitt (link to follow) which I think states a basic reality:
“Earth’s climate changes are extraordinarily complex phenomena. They represent decadal, to millennial, to epochal changes in weather patterns as nature continuously attempts to compensate for solar heating imbalances in and between the atmosphere and oceans.”
http://pajamasmedia.com/blog/climategate-what-we-should-be-doing-about-natural-climate-change/
DId you catch that? Basically, all natural climate variation can be reduced to an interaction between (a) terrestrial atmospheric and oceanic processes and (b) and the sun (“solar heating imbalances”). I mean, how could it be otherwise? The great gulf between Archibald and Svalgaard only demonstrates how little we actually understand about the nature of this interaction.
Leif Svalgaard (17:42:44) : This a pure Archibald, and also pure nonsense and…
Which releives me of the need to follow this thread further.
Thanks for freeing up my time, Leif.
The disjunction between the views of David Archibald and Leif Svalgaard has been exercising me for some time.
Leif’s points about the smallness in the absolute level of variations in solar output are persuasive but I find it difficult to accept his complete dismissal of any correlation between cool spells and periods of reduced solar activity and also his complete dismissal of the possibility that other aspects of solar variability apart from raw power output could have a disproportionate effect on climate.
David’s work takes due note of the apparent correlations and interprets them persuasively but fails to propose mechanisms to explain weaknesses in the correlation or exactly how such proportionately small solar changes could have what seem to be large climate responses.
I have tried to square the circle by proposing that oceanic variations in the rate of energy release are the most direct climate driver with solar changes providing the longer term background trend with both oceanic and solar influences varying independently and capable of moving in and out of phase over millennia.
That provides a mechanism to explain the failures of correlation from time to time and also accounts for the size of climate shifts in the face of small solar variability. Additionally it can explain why the size and speed of climate shifts seems to vary greatly between periods of glaciation and interglacials.
As regards the scale of solar effects I have proposed that counterintuitively a more active sun increases the rate of energy loss to space more than the additional power output provided by the extra activity adds energy to the Earth system. When the active sun causes an expansion of the upper atmosphere we see an increased surface area of atmosphere exposed to space with a faster transfer of energy outward. An active sun also creates a more turbulent upper atmosphere which also increases total surface area at the interfaces between each layer of the upper atmosphere for a similar effect.
That proposition helps to explain why climate shifts are smaller during interglacials than they are during glacial epochs because during interglacials the solar effects offset oceanic influences reducing climate variability but during glaciations the solar effects compound oceanic influences giving much larger climate variability.
I am open to sensible arguement rebutting such propositions convincingly but I have yet to hear it.
I read a non-scientific paper that argued that we crossed the galactic plane in 1998. Readers here would also note that that is an anonymously warm year. I figure that as we entered the plane, the galactic rays would increase. But the chart claims they decreasing. Is there a way I can resolve the chart with my hypothesis? Of course it could be that the1998 transit date is just wrong… But I was looking for a way that might explain why it was as warm as it was.
The sun/climate issue is fraught with baggage.
On the one hand, the sun obviously determines Earth’s climate. Why else would the Aztes have been carving out people’s beating hearts as to it offerings during droughts?
On the other hand, the sun can’t possibly influence Earth’s climate because it’s too far away.
In between those two views are other views.
Be10 is useful because it stands out, but it is only a proxy for other atomic nuclei that we can’t measure because they’re ubiquitous, so it’s an imperfect measure of the state of the cosmic ray flux in a given era.
What is very useful is that the sun has finally changed modes in an era when we have the instrumentation to actually measure what’s going on. I think the next decade will be pivotal in examine the link between the sun and climate.
Hrm… I should’ve previewed but I was in the middle of a cat/wild bird war. A wild bird has taken up residence above my head due to the unusually cold weather, and I don’t have the heart to toss him out in the snow. The new kitty (rescued from the freezing woods of Eastern Kentucky) finds him fascinating and wants to play with him, but the bird is having none of it. Today I realized that the bird is ignoring all the bird feed and has been eating the cat’s food, which might explain the cat’s emotionally charged attitude regarding the bird. The bird seems to know that he’s overstepping his bounds regarding the cat because he has no qualms about landing on my bunnies.
Anyway, the wild bird pooped on my keyboard, which somehow damaged not only the keyboard (which I’ve swapped out twice to no avail) but the motherboard’s keyboard interface. This has almost randomized my cursor and delete keys. Meanwhile the rescue kitty sits on my chest insisting that I don’t preview my comments, and the rabbits think its fun to hop across me and the damaged keyboard, rendering my attention to comment review wholly inadequate.
It’s a cruel joke that mother nature has played on me, filling my house with refugees from the coming ice age even as I try to comment on global warming. The only thing that would make my life worse is a wooly mammoth in my living room.