Steve Goddard points out that warm SST events often have a downside. My view: something like capacitor discharge in an RC circuit. – Anthony

Dr. Roy Spencer reported that January, 2010 was the warmest on record at +0.72C anomaly after a relatively cool +0.28 in December. Dr. Spencer is one of the most trustworthy players in climate science and clearly does not have a warming agenda. So is earth’s climate warming out of control after all?
To answer this question, it is worth looking back at the “second warmest January” which came in 2007. Like 2010, January, 2007 also took a big jump up from the previous month and was at the peak of an El Nino. The warm weather led the Met Office and to forecast a record warm year. Hansen also speculated about the possibility of a “Super El Nino.”
4 January 2007
2007 – forecast to be the warmest year yet
2007 is likely to be the warmest year on record globally, beating the current record set in 1998, say climate-change experts at the Met Office. http://www.metoffice.gov.uk/corporate/pressoffice/2007/pr20070104.html
But the Met Office was wrong in 2007. Instead of breaking the temperature record, temperatures plummeted nearly 0.8C to below normal after El Nino quickly faded – as you can see in the graph below.

Source : Wood For Trees – Late 2006 to mid 2008
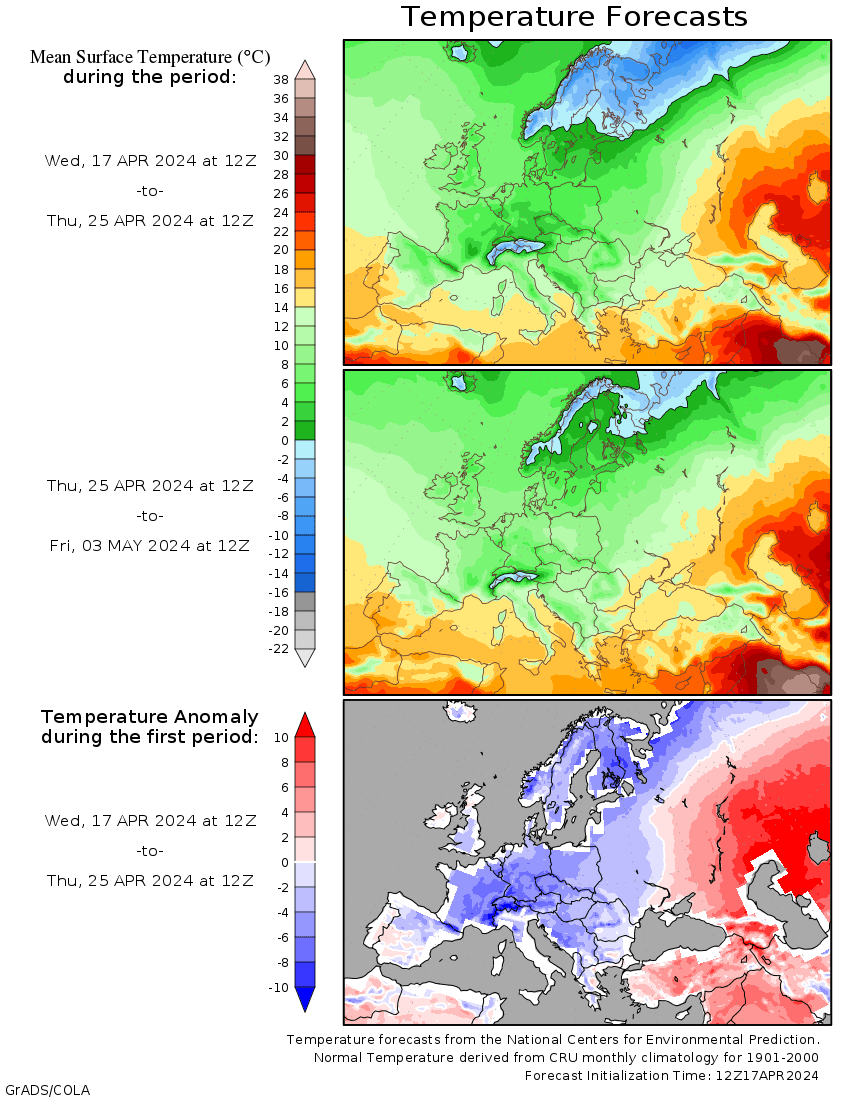
One big difference between January, 2007 and January, 2010 is that this time around, land temperatures are not so warm. Many parts of the planet have been reporting near record cold temperatures, in particular Europe, Siberia, Antarctica and the US.
So what is going on in 2010? Bob Tisdale has reported that this is the warmest El Nino since 1998.

http://bobtisdale.blogspot.com/2010/02/preliminary-january-2010-sst-anomaly.html
The ocean makes up 2/3 of the planet and dominates the global temperature average. Bob reports that “NINO3.4 SST anomalies peaked about five weeks ago and they’ve been dropping like a stone” so we may be in for a repeat of 2007. The Met Office is doing their part to make it happen.
Met Office : Climate could warm to record levels in 2010
10 December 2009
http://www.metoffice.gov.uk/corporate/pressoffice/2009/pr20091210b.html
In the meantime, try to stay warm during the “record heat.”

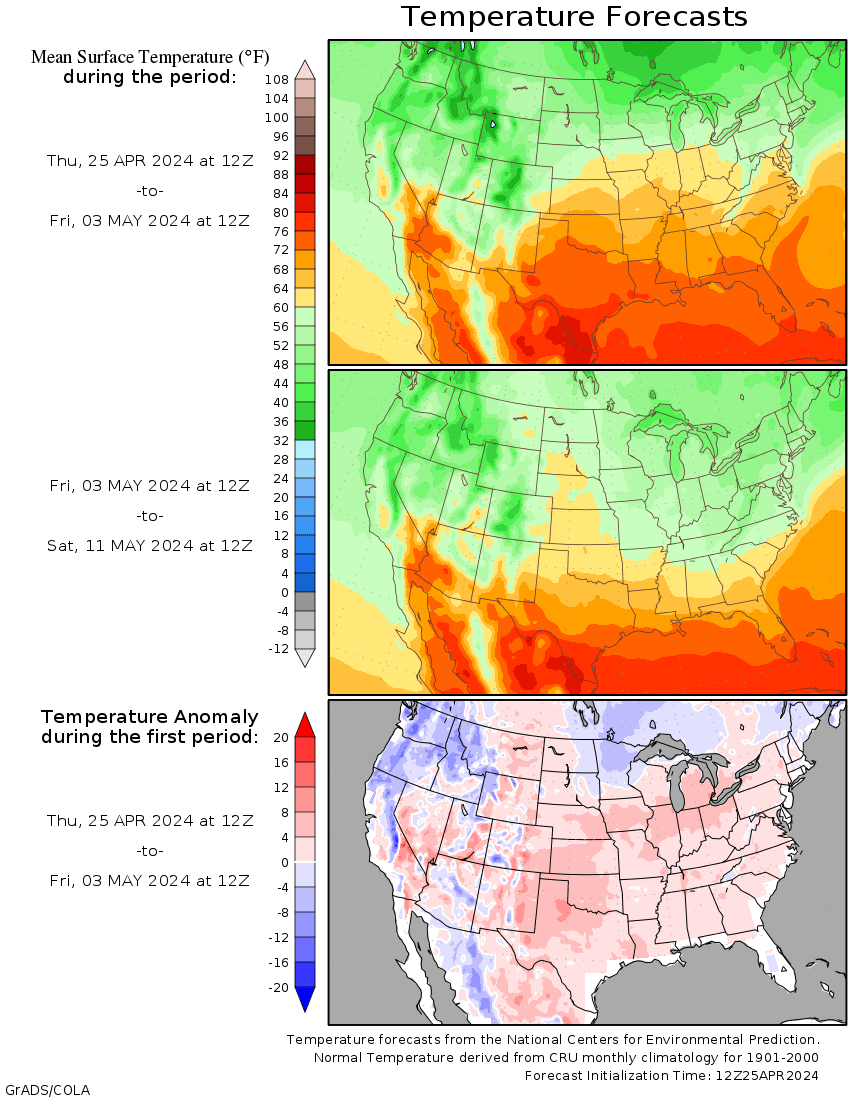
http://wxmaps.org/pix/temp1.html

http://wxmaps.org/pix/temp4.html

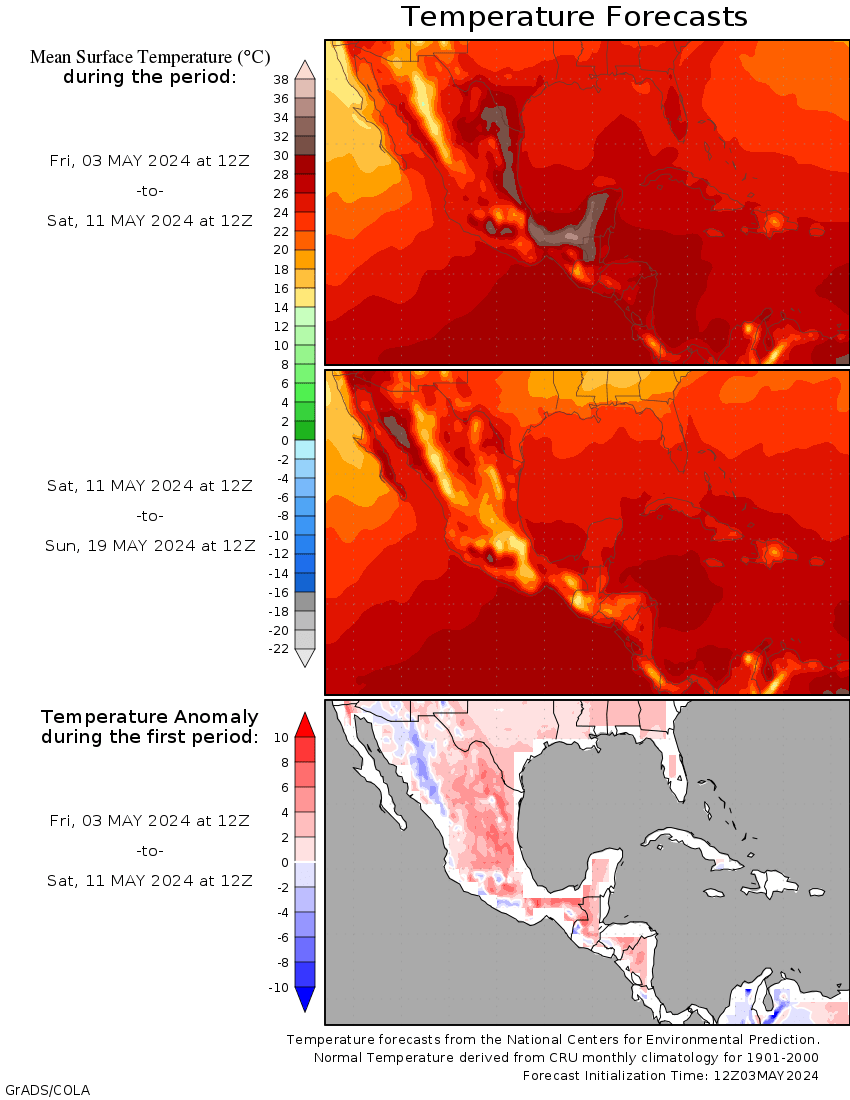
http://wxmaps.org/pix/temp3.html
Flashback to 2007
Dr. Roy Spencer reported that January, 2010 was the warmest on record at +0.72C anomaly after a relatively cool +0.28 in December. Dr. Spencer is one of the most trustworthy players in climate science and clearly does not have a warming agenda. So is earth’s climate warming out of control after all?
To answer this question, it is worth looking back at the “second warmest January” which came in 2007. Like 2010, January, 2007 also took a big jump up from the previous month and was at the peak of an El Nino. The warm weather led the Met Office and to forecast a record warm year. Hansen also speculated about the possibility of a “Super El Nino.”
4 January 2007
2007 – forecast to be the warmest year yet
2007 is likely to be the warmest year on record globally, beating the current record set in 1998, say climate-change experts at the Met Office. http://www.metoffice.gov.uk/corporate/pressoffice/2007/pr20070104.html
But the Met Office was wrong in 2007. Instead of breaking the temperature record, temperatures plummeted nearly 0.8C to below normal after El Nino quickly faded – as you can see in the graph below.

Source : Wood For Trees – Late 2006 to mid 2008
One big difference between January, 2007 and January, 2010 is that this time around, land temperatures are not so warm. Many parts of the planet have been reporting near record cold temperatures, in particular Europe, Siberia, Antarctica and the US.
So what is going on in 2010? Bob Tisdale has reported that this is the warmest El Nino since 1998.

http://bobtisdale.blogspot.com/2010/02/preliminary-january-2010-sst-anomaly.html
The ocean makes up 2/3 of the planet and dominates the global temperature average. Bob reports that “NINO3.4 SST anomalies peaked about five weeks ago and they’ve been dropping like a stone” so we may be in for a repeat of 2007. The Met Office is doing their part to make it happen.
Met Office : Climate could warm to record levels in 2010
10 December 2009
http://www.metoffice.gov.uk/corporate/pressoffice/2009/pr20091210b.html
In the meantime, try to stay warm during the “record heat.”
http://wxmaps.org/pix/temp1.html
http://wxmaps.org/pix/temp4.html
http://wxmaps.org/pix/temp3.html
You gave me a real flashback there until I realized you weren’t talking about the Super Sonic Transport.
“Lockitch gave a presentation arguing free-market economies are better positioned than socialist societies to deal with any severe weather events caused by climate change — and was called a “denier” and compared to a shill for “Big Tobacco” for his trouble. Taylor got off a little easier, receiving only scoffs and curious-to-annoyed glances for asking inconvenient questions.
But that’s not to say we were the only people to question the assumptions of the attendees who believe the “science is settled” on global warming. Perhaps the greatest challenge came from one of their own — renowned climate scientist William Sprigg — who urged his colleagues to stop treating the ClimateGate scandal as irrelevant noise promoted by “deniers.” In an amazingly telling moment, green energy consultant Andy Van Horn, who introduced Sprigg, admitted he’d never heard of ClimateGate until Sprigg suggested it a few weeks ago as a topic worthy of discussion. (Who are the real “deniers” again?)”
http://biggovernment.com/jlakely/2010/02/05/an-honest-ipcc-scientist-warns-his-colleagues-dont-dismiss-climategate/
Very Interesting, this see saw effect. Suggestive of a mechanism that can be quickly altered. (Magnetic field?) In any event, not the slow steady rise of C02, nor a steady decline.
Start bets how low the next La Nina will fall.
The el Nino, is it a result of one of the so called conveyor belt’s ?
Or is it surface temps? Or both, perhaps?
OT
“Rajendra Pachauri, chairman of the U.N.’s International Panel on Climate Change, said global warming skeptics are like people who see no difference between cancer-causing asbestos and talcum powder”
"I hope that they apply it (asbestos) to their faces every day."
What a lovely thing to say!!!
I forecast in my scenario that Pachauri will be gone by the end of the month, or at least an announcement of intention to go before end of his tenure.
The following shows that that El Nino confined to aa relatively small area in 3+4 El Nino, there is no such El Nino along the west coasts of SA. Just compare this with 1998-98, and don’t forget the solar minimum we are in.
GCR still up up and away:
http://cosmicrays.oulu.fi/webform/query.cgi?startdate=1964/01/05&starttime=00:00&enddate=2010/02/05&endtime=01:27&resolution=Automatic choice&picture=on
Oops, forgot SST chart>
http://weather.unisys.com/surface/sst_anom.html
IJIS is sea ice extent is stuck?
Interesting theory about the causes of El Nino here:
http://www.john-daly.com/sun-enso/sun-enso.htm
One big difference between January, 2007 and January, 2010 is that this time around, land temperatures are not so warm. Many parts of the planet have been reporting near record cold temperatures, in particular Europe, Siberia, Antarctica and the US.
Why trumpet Jan 2010 if this has the high potential to lead to a far colder year?
Someone may have taken a pawn sacrifice thinking of a game of attrition.
Just a thought.
I was wondering if anyone was looking into any correlation between plate techtonics and ocean temp
Given that surface temps tend to lag the ENSO index, I’d suspect the next few months will be quite warm. Channel 5 so far in February agrees: http://discover.itsc.uah.edu/amsutemps/execute.csh?amsutemps
That said, we should avoid reading too much into temperatures during major ENSO events, be it in 2008 or 2010.
REPLY: Yes, like forecasting “barbecue summers” – A
we live on a water planet. sun warms oceans. el nino smears the warmth around. oceans warm air, which convects the heat up to be radiated away. Makes sense to me.
only this time around (if you believe Svensmark) the sun is being blocked by low clouds due to the sun’s (continuing) magnetic funk.
So all this atmospheric heat will be lost to space and the recharger’s on trickle.
Better buy a coat.
OT: Penn State investigation a total whitewash
http://foxnews.com/
http://www.foxnews.com/scitech/2010/02/05/penn-state-probe-michael-mann-total-whitewash/
From the instant post:
“My view: something like capacitor discharge in an RC circuit. – Anthony Watts
I think you’re on to something, there.
http://www.rwc.uc.edu/koehler/biophys/4g.html
kwik (13:40:34) :
The el Nino, is it a result of one of the so called conveyor belt’s ?
Or is it surface temps? Or both, perhaps?
Lost UFO, upside down on the floor of the Pacific. Every now and then the powerful propulsion system turns on for a while, and since the craft is flipped over it generates a plume flowing up to the surface that brings along warmer water from under the surface, resulting in a cooler ocean as the heat is released into the atmosphere.
Actually, last I heard, no one really knows why it happens, so the above is merely an “as likely as anything else” hypothesis. Maybe.
I think we might see some “see-saw” effect in 2010, but there is at least one very important difference between now and 2007. In 2007 we were seeing a sun that was becoming less active as it headed for the minimum we saw last year. Now we are seeing an increasingly active sun with its irradiance steadily increasing toward the solar max of 2013. Plus of course, we have more CO2 and methane in the atmosphere than in 2007, so with any heat released, the more that will be trapped and continue to warm the troposphere. So far at least, there are no signs that 2010 will cool down like 2007 did…but we all can track it daily which makes this so fun & interesting…
OT: All climate scientists should reaad this:
Why Climate Science is on Trial.
“The findings of climate science will (and should) be held to a much higher standard of accuracy and certainty than normal scientific studies. Scientists can be wrong about the lesser spotted skink for twenty years and then change their minds; no harm, no foul except maybe to the skinks. But if the implications of the work of climate scientists lead to serious proposals for the entire world to make dramatic shifts in its basic patterns of energy usage, it would be utterly naive and idiotic for scientists to expect that there wouldn’t be lots of people second guessing their work and checking over it in the hope of discovering mistakes.”
http://blogs.the-american-interest.com/wrm/2010/02/05/why-climate-science-is-on-trial/
This seems like an arguement that extremes are followed by falls back to below the mean. But if the long term mean trend is up and look like continuing to go up, it has to go down and stay down to affect the mean.
Also tonight the BBC are reporting a growth in climate scepticism. But can I beleive it? Advice please.
john,
The UK is headed for yet another extended blast of snow and cold, to finish off The Met Office’s warm winter.
http://www.theargus.co.uk/news/4909843.Snow_predicted_across_Sussex/
Not surprising that climate scepticism is increasing in the UK. The emperor (or Prince Charles) can only run around in his new clothes for so long before he gets noticed.
Slightly OT, BBC Radio 4 this evening reported that, according to to an opinion poll last November, 41% of British people believed that man-made global warming was happening. But a poll at the beginning of February this year has seen this figure fall to just 26%, with 38% ambivalent (or saying it was not proven), 25% saying that man-made global warming wasn’t happening at all, and 10% saying it had all been made up by environmentalists. That’s quite a collapse in public belief in just 3 months.
kadaka (14:07:55) :
kwik (13:40:34) :
“The el Nino, is it a result of one of the so called conveyor belt’s ?
Or is it surface temps? Or both, perhaps?
Lost UFO, upside down on the floor of the Pacific. Every now and then the powerful propulsion system turns on for a while, ….”
Sure that UFO is not a volcano?
“…. so the above is merely an “as likely as anything else” hypothesis. Maybe.”
JonesII (13:50:59) :
Thanks for the chart. It looks like the water temp around Rio will be higher than normal – great for diving 🙂
Okay, I gotta say something about Pachouri’s idiotic asbestos comment. I know it isn’t really on topic and it doesn’t really matter in any big way, but it does point out what an idiot Pachouri is.
There is *Nothing* poisonous about Asbestos! In it’s raw form, it’s fibrous and rather soft. You could make a washcloth out of it and rub it on your face every day and NOTHING BAD WOULD HAPPEN TO YOU! Sheesh, Pachouri is supposed to be some kind of scientist and he only has a third graders cartoon version idea of what asbestos really is?
The *only* way asbestos is dangerous is if it is ground into a form where it becomes a dust that hangs in the air, and you stay in that atmosphere breathing it for many years.