
CBS News recently published a story “2025 was so hot it pushed Earth past critical climate change mark, scientists say,” from the Associated Press (CBS/AP), claiming that a recent temperature “blip” has pushed the planet past the Paris Agreement’s 1.5°C threshold, implying that catastrophic consequences are now unfolding or inevitable. This is false. Earth has passed that politically chosen temperature hallmark with no disastrous effect and is now cooling. Also no data supports the claims of increased severe weather consequences matching the short-term the temperature increase.
The article states that 2025 was among the hottest years on record and that a three-year average “broke through” the 1.5°C limit, warning that staying below this mark “could save lives and prevent catastrophic environmental destruction.” The story relies a great deal on rapid-attribution outputs from World Weather Attribution suggesting that specific extreme events in 2025 were far more likely because of climate change. Their implication is clear: crossing 1.5°C is a critical line, and dire outcomes should now be expected.
But a short-term temperature spike, especially one based on a three-year average, is not climate, and it certainly does not validate years of catastrophic predictions tied to the 1.5°C number. What CBS/AP also ignores is the fact that since the peak in early 2024, likely induced by huge amounts of water vapor injected into the atmosphere by the Hunga-Tonga volcanic eruption, global temperature has been trending downward as seen in the graph below.

Climate is defined and assessed over multi-decadal periods, typically 30 years, specifically to smooth out short-term variability from El Niño, La Niña, volcanic aerosols, and other natural influences. A brief overshoot during a warm phase does not establish a new long-term state. As importantly, as Climate at a Glance “Tipping Point: 1.5 Degrees Celsius Warming,” explains the 1.5°C threshold is a policy target, not a scientifically established threshold beyond which climate disaster looms. In short, the 1.5℃ target was chosen by politicians to drive policy action and never represented a physical cliff beyond which the climate system suddenly collapses.
That distinction matters, because for years the public was told that passing 1.5°C would unleash unmistakable, escalating disasters. Yet when global averages have briefly touched or exceeded that level in recent datasets, the promised cascade of unprecedented impacts did not materialize. Hurricanes have not suddenly multiplied, floods did not surge globally, and agricultural output did not collapse. On the contrary, long-term records summarized at Climate at a Glance: Hurricanes and Climate at a Glance: Floods show no clear global increases that would confirm the article’s apocalyptic framing. This is why critics have long argued that 1.5°C functions as a moving rhetorical goalpost rather than a scientifically demonstrated tipping point.
CBS/AP also amplifies claims that extreme weather in 2025 proves the danger of crossing this threshold, but those claims rest on model-based attribution rather than observed long-term trends. ClimateRealism has documented the weaknesses of such attribution studies in multiple analyses, including its coverage of World Weather Attribution claims, showing how probabilistic model outputs are routinely presented as settled fact while observational uncertainties are minimized or ignored. The Intergovernmental Panel on Climate Change (IPCC) Sixth Assessment Report (ICCC AR6), is far more cautious, assigning low or medium confidence to many asserted global trends in extremes and emphasizing regional variability and uncertainty. Later references to IPCC AR6 in media coverage often omit this caution.
What the CBS/AP piece also leaves out is historical context. The climate system has always exhibited variability, with warm and cool phases layered atop longer-term trends. Selecting a recent warm spike and declaring a “critical mark” crossed tells readers little about where the climate will settle over coming decades. While warming has occurred since the late 19th century, the rate and impacts vary substantially over time and region, undermining the idea of a single, universal danger line.
Finally, the article’s sense of urgency ignores a crucial real-world metric: outcomes. Despite rising global temperatures over the past century, climate-related deaths have declined dramatically due to improved infrastructure, forecasting, and energy access, a point documented at Climate at a Glance: Deaths from Extreme Weather. Deaths related to non-optimum temperatures have also fallen dramatically as the Earth has slightly warmed, in part because cold weather kills more people that hot temperatures. If crossing 1.5°C were truly the existential turning point portrayed, one would expect the opposite trend.
By treating a short-term temperature blip as proof that a “critical climate change mark” has been breached, CBS/AP misleads readers about how climate science actually works. The 1.5°C figure is a political benchmark, not a physical tipping point, and brief excursions above it say little about long-term climate outcomes. The fact that nothing resembling the predicted catastrophes occurred when the threshold was touched suggests that CBS/AP is engaging in doom-mongering rather than journalism.

Anthony Watts is a senior fellow for environment and climate at The Heartland Institute. Watts has been in the weather business both in front of, and behind the camera as an on-air television meteorologist since 1978, and currently does daily radio forecasts. He has created weather graphics presentation systems for television, specialized weather instrumentation, as well as co-authored peer-reviewed papers on climate issues. He operates the most viewed website in the world on climate, the award-winning website wattsupwiththat.com.
Originally posted at ClimateREALISM
I thought we had passed the critical climate mark and the climate tipping point long ago. Except as this site and many other climate reality ones have frequently pointed out, that tipping point has been standing upside down for some time now. Yet the global population keeps on growing, life expectancies lengthening, agricultural production rising, infant mortality rates falling, and worldwide GDP improving. So maybe we need a few more tipping points; in fact, maybe they should be permanently revolving.
What made you think that?
Well, when any forecasted events that have been aggressively claimed to be “settled” don’t eventuate at all, most rational people would conclude that such claims lack reliability.
Or just call it bullshit.
He was being sarcastic, Snail. Because you climate loons have been carping about tipping points for decades. But it’s over now. You lost. You’re finished. Find a new hobby. Get an actual life.
Because some fools have been whining about it for years. And of course he was being sarcastic.
No, critical climate nonsense will be around for a while longer.
There are many who’s wage depends totally on it.
Any many without the mental capacity to overcome the brain-washing…
… no matter how much “reality” gets in their way.
Why can’t the mainstream media just GROW UP..!
The alternative hypothesis to the state of maturity is that the MSM have a political agenda for which they desperately need propaganda.
“Why can’t the mainstream media just GROW UP..!”
You are wasting your time trying to reason with the Leftwing Media. They are not reasonable people. They have a political agenda.
Because those entities became corporate profit centers and the cash flow from ad clicks is more important than truth.
It’s all about the dollars. Media. Academics. “Climate” scientists. “Politicians.”
He who controls the money, controls.
He who controls energy controls the money.
He who controls energy controls EVERYTHING. That is the underlying goal of the climate bullshit – the biggest power grab in history.
Very nice Anthony. Another thing showing how arbitrary and meaningless the 1.5C benchmark is is how fast some organizations moved from it to 2.0C as the catastrophic magical number.
“how fast some organizations moved from it to 2.0C as the catastrophic magical number.”
That’s because it was clear we weren’t going to reach 2C.
We’re already on a course to far surpass 2C
You will just have to wait until the next El Nino event, won’t you..
… and hope it doesn’t cool too much before then.
“IF” warming continues at the modern rate we could be 2.6C warmer than pre-industrial times by 2100, Hardly a “far surpass”.
They changed it from 2C to 1.5C because the pause in global warming happening at the time wasn’t going to produce 2C this century. 1.5C made their lying claims more urgent also.
““IF” warming continues at the modern rate we could be 2.6C warmer than pre-industrial times by 2100, Hardly a “far surpass”.”
The modern rate is accelerating.
One can fit a polynomial of almost any degree to the data that you provide. What is your objective justification for showing the particular fit that you chose?
“The modern rate is accelerating.”
No it isn’t. Cherry picking a short term spike doesn’t change the long term trend that has been steady.
Will be cooling until the next major El Nino event.
Meaningless.
To you.. yes. !
Meaningless.
Your attribution to all of your comments is spot on.
You wouldn’t work long for me if that is how you project revenues and expenses! Exponential curves for forecasting is a standard claim of unprofessional people. Maybe you should do some learning about time series and what their analysis is.
Let me put it to you this way. You are setting yourself up for failure when that curve must start to mimic a turndown.
I forgot to say, don’t be a climate scientist that promptly revises a projection and says “See I got it right now,”. Admit up front that your previous forecast was IN ERROR. That is what those of us that live in the real world must do. Sometimes it costs us our jobs.
On course? I’m reminded of the quip by Mark Twain that he had been on the verge of being an angel his whole life.
Praise the Lord! Too dam cold here in Wokeachusetts despite billions spent on “clean and green energy”.
JZ
In Massachusetts, Dec 2025 was only the 41st coldest since 1895.
Ergo, ordinary weather. Glad you agree. 🙂
It’s still too dam cold for most people living here.
Why does this concern you, assuming you’re concerned?
Even at 2C or 3C or 5C we would not suffer any more than those optimum eras that say the population flourish.
And surpassing 1850?
What evidence is there that 1850 was the climate optimum.
No one has yet to define the climate optimum in measurable metrics.
How do we know we are not moving towards the optimum?
Without knowing the optimum, no claims that things are getting worse are valid.
Keep making the point. I have.
If climate science cannot decide on an optimum temperature, why should we believe +1.5° is a problem.
Optimum is warmer.
That’s why the warmest period during the current epoch, the Holocene, was called The Holocene CLIMATE OPTIMUM.
Only anti-human loons look back fondly at The Little Ice Age as if it was utopia. It was a period of MISERY AND SUFFERING.
Per UAH –
From January 2008 to present, the rate of warming is 3.7C/century.
You cherry picked a low in the trend to produce a faster rate. Typical of the lying alarmists rely on to produce false narratives. The rate according to UAH is 0.16C per decade.
Amazing how “skeptics” love to decry cherry picking when it contradicts their narrative. They turn a blind eye when Anthony Watts does the exact same thing:
“What CBS/AP also ignores is the fact that since the peak in early 2024, likely induced by huge amounts of water vapor injected into the atmosphere by the Hunga-Tonga volcanic eruption, global temperature has been trending downward as seen in the graph below.”
The 2024 peak is an anomalous event. It demands explanation. Not only is it the highest peak since UAH has been measuring the Lower-Troposphere temperatures, but it is the widest (FWHM) major peak. It isn’t Cherry Picking to point out something unusual and speculate on the cause.
I don’t think that you understand what Cherry Picking means; it is more akin to to what you did — converting a saw-tooth or step function to something that looks like a smoothly accelerating change, implying something for which I doubt that you have first-principle explanations.
The eruption occurred in 2022 January, so the most objective baseline is the pre eruption climate state.
Using the early 2024 peak as the reference point obscures any potential volcanic influence also because it coincides with the height of El Nino driven warming.
“I don’t think that you understand what Cherry Picking means; it is more akin to to what you did — converting a saw-tooth or step function to something that looks like a smoothly accelerating change, implying something for which I doubt that you have first-principle explanations.”
The second degree fit accounts for ~56.5% of the variance in the UAH. This exceeds the variance explained by a linear model.
It is still very influenced by the end points.
A trend on a time series should only lead one to the need to understand why it is changing. For that, you need a stationary trend that does away with auto-correlation and seasonality. That provides a baseline for a model that is then used to add various contributing variables to.
As pointed out to you before, temperature is not a good proxy for heat. So the first thing to do is to add variables that change temperature into enthalpy. Then you can other variables like CO2, atmosphere particles, albedo, EC.
It seems that your unstated assumption is that the eruptives won’t change in composition or effect over time, despite it being expected that the mass of particles vary with the cube of the diameter, and the settling velocity varying with the difference between the square of the diameter (hemispherical surface resistance) and the gravitational attraction. To make it simple, bigger and heavier particle settle out early.
The fact that just a hair more variance is explained by a second-order fit than a linear one is interesting. It gives us confidence that the correlation-prediction is probably better than a coin toss. However, what is more important is answering the question, “Is there any physical justification for the preference of a 2nd-order over a linear fit?”
That is not my unstated assumption.
How does post-injection volcanic decay logically justify anchoring the reference period at the El Nino-driven temperature maximum two years after the eruption?
[deleted]
“Amazing how “skeptics” love to decry cherry picking when it contradicts their narrative.”
Cherry picking is scientific fraud. It’s not a “narrative” to point that out. Anthony made no claim about an acceleration to the downside like you dishonestly did to produce a fake rate up.
I think Anthony was just pointing out that all the bad things that are supposed to happen, according to Climate Alarmists, after 1.5C is exceeded is not happening because the 1.5C mark is not now exceeded, the temperatures are in fact 0.5C cooler than the 1.5C mark. The Earth is down to the 1.0C mark now.
When do you think the Earth will reach the 1.5C mark again?
The “0.5°C cooler than 1.5” framing depends entirely on anchoring the analysis to the early 2024 peak, which guarantees a large subsequent decline regardless of the underlying forced trend or any potential HT influence.
We have direct analogues. From Feb 2016 to Sep 2018 (El Nino to moderate / weak La Ninas), global anomalies fell by a comparable amount and this prompted similar claims about cooling at the time. Yet ultimately what followed was more warming.
“When do you think the Earth will reach the 1.5C mark again?”
The 1996-97 and 2024-25 periods were comparable ENSO seasons yet their mean global anomalies were dramatically different. Aug 1996 – Jul 1997 averaged -0.17°C, while Aug 2024 – Jul 2025 averaged above +0.58°C, nearly an 0.8°C increase in less than 30 years. At that rate, surpassing 1.5°C is certain.
When do you think, TA?
When the new baseline becomes 1995 – 2025, where does the +1.5 go?
The baseline for the 1.5C is pre-industrial times.
There will not be continued El Nino events.
Only a mathematical illiterate extrapolates 46 year out to a century.
Below is the graph for global surface temperatures as provided by James Hansen (I presume you have heard of him.) Looking at the bigger picture, the change from 1970 to at least 2010 is about 0.18°C/decade. Limiting your view to 2008 to the present is a bit like focusing on the tail of the dog to try to find evidence of it wagging the dog. As Anthony pointed out, the eruption of Hunga-Tonga is known to have created very unusual atmospheric conditions post-eruption. It would be more instructive to revisit this topic in a few years to see whether your speculated ‘acceleration’ is real. In the meantime, if a linear fit seems appropriate to Hansen, I think that you have some ‘splainin’ to do to justify your 2nd-order(?) fit above.
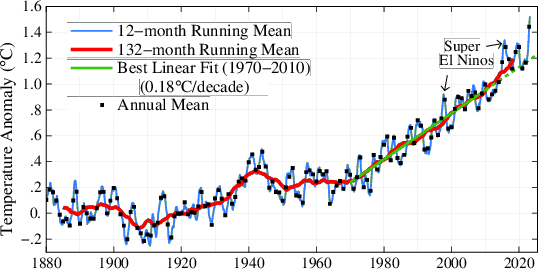
The graph is of course totally BOGUS.
Measurements for most of that period are sparce to non-existent….
… certainly not enough to justify anything that could be even remotely called “global”
Those measurements that do exist show that the period around 1930,40 was at least as warm as the period from 2000-2020
I won’t argue about the reliability of the late-19th and early-20th century reliability. I chose that mostly to demonstrate to Eldrosion that Hansen uses a linear fit, not a 2nd degree.
“Limiting your view to 2008 to the present is a bit like focusing on the tail of the dog to try to find evidence of it wagging the dog.”
The above post uses early 2024 as a reference point.
How is that germane? It comes across as you not knowing what else to say so you picked a low-diversity word salad, sans any dressing, just to have something to say.
If we agree that focusing on the “tail of the dog” is misleading, then anchoring the analysis to a large ENSO spike in the record is equally misleading.
Perhaps you should apply that criticism from your 9:09 PM comment more consistently.
SFW. Warmer is better.
From 9am this morning to present, the rate of warming is 15,555C/year
Yes, defining a “trend” from an arbitrarily chosen extreme – whether it’s 9 am or early 2024 – produces meaningless results. Thanks.
“produces meaningless results”
Thank you for your admission.
Yep, need to look at longer terms, say 3000 years..
COOLING !!
Anthony Watts is not using the last 3,000 years as his reference period. He is using early 2024.
Anthony Watts was making the point that alarmist media exclusively focuses on warm spikes and ignores cooling in their propaganda offerings.
Your weak attempts at projection accusing him of what you did are pathetic. He made no claims about future trends like you dishonestly did- “From January 2008 to present, the rate of warming is 3.7C/century.”
“Anthony Watts was making the point that alarmist media exclusively focuses on warm spikes and ignores cooling in their propaganda offerings.”
Short term cooling followed by an El Nino peak is expected and has no bearing on long term behavior. Why should it not be disregarded as trivial?
Time for a new excuse.
The point of the article went over your head. You are manufacturing a straw man issue issue that should be disregarded. Your projection doesn’t excuse the fraud you were pushing.
I am not manufacturing a straw man. I am responding one of the article’s claims that the post 2024 cooling undermines the relevance of the 1.5°C discussion.
That argument relies on a cherry picked short term fluctuation. The appropriate context is the long term trend since 1979, which is the relevant determinant of whether the warming will ultimately exceed that threshold.
Whether cherry picking is used to project trends or downplay the significance of 1.5°C, it remains cherry picking.
Your faux skepticism clearly only lets you criticize it when an “alarmist” does it.
“I am responding one of the article’s claims that the post 2024 cooling undermines the relevance of the 1.5°C discussion.”
Anthony used multiple lines of evidence to show the 1.5C fabricated tipping point is unscientific nonsense. Briefly exceeding that threshold doesn’t mean we have entered a new climate state was the point he was making that went over your head.
You are grasping at straws and flailing badly.
“Anthony used multiple lines of evidence to show the 1.5C fabricated tipping point is unscientific nonsense. Briefly exceeding that threshold doesn’t mean we have entered a new climate state was the point he was making that went over your head.”
That is not the focus of my critique. Instead, I am addressing the following:
“What CBS/AP also ignores is the fact that since the peak in early 2024, likely induced by huge amounts of water vapor injected into the atmosphere by the Hunga-Tonga volcanic eruption, global temperature has been trending downward as seen in the graph below.”
Notice the word ‘also.’
So, in addition to claiming that 1.5 °C is a climate tipping point fabricated by politicians, or arguing that briefly exceeding this threshold doesn’t signify a permanent shift to a new climate state, he is also attempting to undermine the perceived importance of 1.5°C by pointing to global cooling since the El Nino maximum – which, once again, is a cherry pick.
Your critique is nonsense. The Hunga water vapor spike is an empirical fact media glossed over to make human emissions the demon. The fictional 1.5C tipping point has no importance other than as a propaganda tool.
It’s not a cherry pick to point out media is lying that we have passed the threshold when we are currently 0.5C below that.
Nobody can know the future and Anthony isn’t pretending he does like you do by creating a phony cherry picked trend and assuming that will continue as an acceleration.
The media article is referring to the 3-year average surpassing the 1.5°C threshold, which is a common approach to smooth out short term fluctuations. So 0.5°C over the time span of ~1 year is not inconsistent with the 3-year average exceeding 1.5°C.
The CBS article also didn’t claim that briefly exceeding 1.5°C means the planet has entered a new, irreversible state. It reported that the 3-yr average crossed the 1.5°C threshold for the first time and explained why staying below that limit is considered important:
“It was also the first time that the three-year temperature average broke through the threshold set in the 2015 Paris Agreement of limiting warming to no more than 1.5 degrees Celsius (2.7 Fahrenheit) since preindustrial times. Experts say keeping the Earth below that limit could save lives and prevent catastrophic environmental destruction around the globe.”
“It reported that the 3-yr average crossed the 1.5°C threshold for the first time and explained why staying below that limit is considered important: Experts say keeping the Earth below that limit could save lives and prevent catastrophic environmental destruction around the globe.”
Totally made up nonsense with zero substance.
whether it’s 9 am or early 2024
or 2008
“Yes, defining a “trend” from an arbitrarily chosen extreme – whether it’s 9 am or early 2024 – produces meaningless results.”
Exactly what you did by choosing 2008! Can you admit what you did is meaningless?
Can you admit you’re not applying your criticism objectively?
“Can you admit you’re not applying your criticism objectively?”
How so?
You can’t fight ideology with facts.
Ideologies hate facts.
Do you have a mirror handy?
You can’t reason a person out of a position that he didn’t reason himself into in the first place (or something like that).
Indeed, as we see daily here.
You read this site daily?
Next, will you admit that you watch Fox News everyday too? Probably shop at Walmart too.
I know, as I have said many times before, if I wasn’t stupid I would ignore this site.
“Many a true word spoken in jest.”
So, you say that you’re stupid – but evidently not stupid enough to realize you’re stupid – but stupid enough to not ignore this site?
No wonder you don’t know what the hell you’re talking about.
“I know, as I have said many times before, if I wasn’t stupid I would ignore this site.”
You admit to being stupid?
Be still my racing heart.
Prime example… is you. !
Well, you know CBS is in desperate search for some easy bonus point credits after getting slammed by celebs for recent reforms. Climate change has always been the preferred easy, unchecked nonsense route to soften the blows. Just ask the Vatican, Jerry Brown, or others seeking PR first aid or budget boosters..
CBS is in a tailspin. They’ve jumped the shark. The turkey is fully cooked.
“2025 was so hot it pushed Earth past critical climate change mark, pseudo-scientists and other crazies say,”
There fixed it for you.
It was COOLING for basically all of 2025
And it was COOLING for basically all of 1999, and all of 2011, etc, etc ….
Then it warmed up again.
The long term warming tend has remained more or less constant for the past 30-years
+1
Cherry picking is empowered by variation.
-10 million. The gig is up. The chickens have flown the coop. The train left the station. The fat lady sang. Elvis left the building. You don’t have to go home, but you can’t stay here.
The long term warming tend has remained more or less constant
for the past 30-yearssince the end of the Little Ice Age.Short-term thinking is the takeaway from the article.
No , the warming has NOT been constant
There was no warming from 2001-2015.. then a major El Nino.
After that El Nino it cooled down until 2023.4, then there was another El Nino.
The warming has come in two very distinct spikes, with absolutely zero evidence of any human causation..
Again, which is better for life on Earth. Warming or cooling? There is no in-between, one or the other is always happening. Would you prefer a return to 1600?
Why stop there. James Hansen’s data suggests that linear warming started about 1964. However, the CO2 concentration has been increasing exponentially, and even during times of reduced anthropogenic CO2 emissions (COVID shutdowns) the global temperature has continued its linear increase. The apparent correlation between CO2 and temperature is only valid for annual averages since the end of the last major glaciation.
Cooling for ~6,000 years. You picked the wrong starting point.
Then so did the post above.
“The long term warming tend has remained more or less constant for the past 30-years”
Only in the averages. Many individual locations do not show warming. It’s not global.
Which rules out well-mixed CO2 as the control knob.
Don’t forget to keep the blinders on regarding cycles.
AMO GlobalAnnualIndexSince1856 With11yearRunningAverage.gif (880×471)
“It was COOLING for basically all of 2025”
Ah. So we hit a tipping point and the earth energy systems are collapsing to a lower energy state, which is what a tipping point is really all about.
UAH says 2025 about the same as 2023.. with a warmer 2024 as the EL Nino event central period.
One the upward leg of the EL Nino, (2023)
The other, 2025, the cool down phase.
How much more cooling to go….. Time will tell.
But it is absolutely nothing to do with anything humans have done.
Thank you for an interesting article.
Clouds and cloudcover plays a significant role in the else overall warming the last decades:
https://agupubs.onlinelibrary.wiley.com/doi/10.1029/2025GL119637
.
Singer, C. E., & Pincus, R. (2026). Southern Ocean clear-sky brightening from sea spray aerosol increase drives departure from hemispheric albedo symmetry. Geophysical Research Letters, 53, e2025GL119637. https://doi.org/10.1029/2025GL119637
.
.
+ NASA researchers on on clouds/ cloud cover –>storm cloud contraction and cloud cover decreases:
https://agupubs.onlinelibrary.wiley.com/doi/10.1029/2025GL114882
.
.
Tselioudis, G., Remillard, J., Jakob, C., & Rossow, W. B. (2025). Contraction of the world’s storm-cloud zones the primary contributor to the 21st century increase in the Earth’s sunlight absorption. Geophysical Research Letters, 52, e2025GL114882. https://doi.org/10.1029/2025GL114882 .’
.
.
+ Research on 2023 marine heatwaves. Indicating/pointing at some of the main drivers for these marine heatwaves:
.
—> involving REDUCED CLOUD COVER, increased shortwave fluxes, oceans advection in some regions, changes in mixing layers in North Atlantic/Norh Pacific +++
.
Read more in the abstract at:
.
https://www.science.org/doi/10.1126/science.adr0910
.
Sources:
.
Tianyun Dong et al. , Record-breaking 2023 marine heatwaves.Science389,369-374(2025).DOI:10.1126/science.adr0910
+
So, on one hand we’re saying that a three-year (36-months) average is insufficient to say anything about long-term climate; and on the other hand, we’re saying that a 13-month average is sufficient to constitute a trend?
Last 3 years is NOT long term, and it was caused by a strong El Nino event.
UAH data shows El Ninos are the only warming source in 46 years
Absolutely NO EVIDENCE of AGW.
Long term, say 3000 years.. its cooling !!
Agreed
Garbage. Magical thinking. ENSO is an oscillation. It warms and cools in equal measure over the long term, shifting heat between ocean and atmosphere; never creating heat.
Reference, please.
What part of the Pleistocene glacial advances do you not understand? The past 2.5 million years is more than enough time for a long term trend.
I understand that they ended about 12,000 years ago and that human civilisation, as we know it, did not exist before that time.
What I don’t understand is how you find this relevant to our discussion here.
Human civilisation need the much warmer Holocene optimum to start to thrive.
Has struggled at every colder period… eg Dark ages, LIA
Thrives through the warmer periods like RWP, MWP.
Why aren’t you living in say Iceland or Siberia.. you would be safe from slight natural warming there.
You continue to beclown yourself. The Pleistocene glacial advances are not over. We are nearing the end of a minor interglacial. You wanted a reference to a long term cooling trend. I gave you one. Not my problem if you didn’t like it.
“I understand that they ended about 12,000 years ago and that human civilisation, as we know it, did not exist before that time.”
Human civilizations developed world wide during the Holocene thermal optimum that was an average of 2C warmer than today for 4,000 years. It has cooled since then. Good evidence suggests that we have yet to warm beyond the Medieval warm period highs. That means the long term downtrend is still in effect.
What is surprising is that basically the temperatures have been declining for the last two of the most recent 3-year period. It is only because the peak in early-2024 was so high that they were able to get the results they hoped for.
Temperature is more like an egg rolling around the centre of a very big, almost flat, wok !
Getting an image of an egg rolling around on a flat metal plate of some sort and relating it to temperature….
Has it been cracked yet?
Is there oil in the wok?
No, and its not over a heater.
“What CBS/AP also ignores is the fact that since the peak in early 2024, likely induced by huge amounts of water vapor injected into the atmosphere by the Hunga-Tonga volcanic eruption, global temperature has been trending downward as seen in the graph below.”
Anthony this HT idea is a loser. Don’t be so attached to it and please stop promoting it.
I am concerned that you and many others have been mislead(ing) over this spurious correlation.
While the 1.5°C thing is not particularly important, how we arrived there was very important.
This HT claim is troubled by the lack of empirical analysis like a basic volumetric comparison.
Can someone please be very specific about the proportion of HT-ejected water vapor compared to the amount of normal ocean-evaporated water vapor since HT erupted?
Because when you said ‘huge’ it’s hard to picture how a discrete event’s water vapor could so overwhelm the dozens if not hundreds of tropospheric atmospheric rivers since January 2022.
It gets worse. Nowhere has any evidence been presented to establish how tropospheric or stratospheric water vapor can warm the ocean in the first place. What is the exact mechanism?
How does the atmosphere warm the ocean when world T2m is 6°C colder than the ocean?
As an AGU member I expect rigorously supported climate relationships, not hand-waved canards.
Global temperatures have recently both risen and fallen with solar cycle irradiance, as I predicted in my 2022 NASA LASP Sun-Climate Symposium poster, where I said the 1.5°C ‘limit’ would likely be exceeded by this solar cycle. The ocean is following sunshine via solar activity, not HT water vapor.
2024 was the hottest year mainly because it had the highest irradiance, following the solar cycle-related triple-dip La Niña that set albedo lower, enhancing absorbed solar radiation, driving ocean temperatures higher in another decadal step change.
I ask you to reconsider your apparent rejection of the warming effect of absorbed solar radiation.
That had to be said.
There is zero correlation between HT and global temperatures.
In fact, they dropped for months after the eruption.
Even Roy Spencer at UAH could find no correlation (and I imagine he looked pretty hard).
The nonsense becomes transparent to everyone over time.
Thank you for sticking up for the right thing. Obviously some people don’t agree.
Please note that: 1) a negative correlation is still a correlation, and 2) you appear to be confusing correlation with causation. Whether HT actually caused anything is certainly up for debate, but there is definitely a correlation. whether the correlation is significant or not can also be questioned.
And with those two contradictory statements back-to-back you’ve demonstrated that you have no idea what you are talking about and everything you say can be ignored.
1) Feel free to ignore everything I say.
2) Causation tends to result from a causative effect. No causative effect has been demonstrated between the recent global temperature spike and the HTE. In fact, what evidence we have says it was irrelevant.
The same can be said for CO2.
I think you’re being a little harsh here Phil.
Please explain where the correlation exists, outside of the initial timing.
Everyone is talking about a ‘co-incidence’, not correlation. Correlation is over time.
If you want to talk about the lag from the stratospheric water vapor decrease since HT, we still need to see how it could warm the ocean, where recent warming started.
Outside of the initial timing, there does not appear to be any correlation between HT and the ocean or UAH, with HT marked (see below) with a triangle right below the orange sun image, which represents the first month of SC#25 TSI exceeding my decadal ocean warming threshold. UAH LT is lagging at all times here.
All I see is action that looks similar to earlier periods before HT that can be attributed otherwise.
Not necessarily. A single lightning bolt is always followed by thunder. It matters not when the lightning occurs. It is correct to say that lightning and thunder are correlated, and we can go one step farther and say that the lightning causes the thunder because it always precedes it.
I would expect the aerosols to drop out of the stratosphere in about the first 18-months, but for the water vapor to take longer.
“There is zero correlation between HT and global temperatures.”
The same can be said for CO2.
HT increased the WV in the Stratosphere by some 10%.. and much of it is still there, just very spread out. This slows cooling.
HT also imparted a lot of energy into the ocean, as shown by the sea ice response in the Antarctic.
At the same time there is a continued increased level of absorbed solar radiation in the tropical oceans.
These have combined to make the El Nino event much broader than either the 1998 or 2016 El Nino events
Slows heating as well, as Tyndall pointed out at length. That’s why the hottest temperatures are found in the driest places – like Death Valley, or the Lut desert.
The sea ice response is from absorbed solar as well.
But Anthony, CBS is engaging in journalism, modern journalism. Modern journalism is part of the entertainment industry. Their job is to entertain, not inform, not to provide factual information nor reveal truths.
But Anthony, CBS is engaging in journalism, postmodern journalism.
FIFY.
It’s not part of the entertainment industry. It’s part of the Propaganda Industrial Complex.
Exactly.
CBS and all the other Leftwing Media are propaganda organs for the Democrat Party. They promote the Party line, whatever it is.
2025 was so hot that the sidewalks were getting up at dawn to fry their eggs.
World Weather Attribution is fraudulent pseudoscience. Empirical measurements prove they are lying.
The whole methodology of WWA is a total scientific FARCE !!
It’s scientific malpractice.
WWA should be condemned by all real scientists.
WWA is what Climate Alarmism is reduced to: They try to present their personal opinions as established facts. There is no evidence to support anything they say. All they have is speculation, assumptions and unsubstantiated assertions. This is your modern-day climate science.
At some point, history is going to rip these Charlatans apart.
CBS coulda and shoulda called Al Gore on this matter. I am sure Al would have made things clear.
Remarkable how malleable these ` tipping-points are .
( The only real one around is 273.15K . )
And it is not a true Tipping Point because the results are reversible.
Hurrah. Someone knows.
The Phantom knows what evil lurks in the hearts of alarmists.
Because CBS is a corporation and not a person, I often try to find the source of the information. In this case the link returned “This page cannot be found”. Actually, that is symbolic of CBS in its entirety.
2025 was so hot it pushed Earth past critical climate change mark, scientists say – CBS News
Thanks. And the source is . . .
Friederike Otto, of World Weather Attribution
Hardly surprising.
Only in the UK, as measured at the totally farcical Met-Office sites.. ROFLMAO !!!!!
Anti-science oozes from every sentence.
https://www.drroyspencer.com/2025/12/the-record-hot-uk-summer-of-2025-validation-of-the-ukmo-methodology-but-the-record-was-only-in-tmin/
Using Met Office abysmal junk stations. !
Even then, its only getting “less cold”….. a blessing for the UK.
I knew you wouldn’t read it !
I’ll make it easier – at least for a few on here who aren’t completely blinkered.
BTW: This was a featured post a week or so back.
And for which potty-mouth Sanders was moderated.
“There has been criticism of the UK Met Office’s methodology for monitoring long-term changes in UK-average temperatures, starting with Tallbloke’s (Ray Sanders’) blog post on 31 October 2024. A major criticism that Tallbloke has is the fact that most UK stations do not meet the World Meteorological Organization (WMO) criteria for a good climate monitoring station. The UKMO doesn’t actually use the WMO quality classification system, but their own 4-tiered system. Another criticism is that many UK stations have closed in recent years, and so those stations are, in effect, estimated (“fabricated”?) from surrounding stations.
No Station is Perfect
On the subject of which WMO (or UKMO) class of station is suitable for long-term climate monitoring, I think it’s important to note that a station could be placed in a non-natural, anomalously warm urban environment, but as long as that environment stays the same over time, it can probably still be used for climate change monitoring.
The uncertainty from this is massive. Temperatures even as close as 1/2 mile can vary a degree or more. There is no way to evaluate the consistent uncertainty because there is no actual measurement at the location.
This is “making up” data that no serious scientific endeavor ever supports.
This is not a justifiable assumption. An urban environment is not a static environment. UHI tends to grow because of more streets, people, buildings, waste heat, etc.
Temperatures even as close as 1/2 mile can vary a degree or more
I have two sensors that are about 50 yards apart that regularly differ by 5F, and sometimes even more. They may not be as sensitive but that is still way out of the range of their calibration. (when set side by side they’re within 0.1F)
People don’t realize what different microclimate can do. Are the similar instruments with different enclosures?
Structures can cause big differences in air flow.
Identical instruments with similar enclosures. One is in the middle of a field, the other is in the “back yard” around all the garden beds. The microclimates in my field are different enough to feel as I walk around it.
I use it to guide what I plant where.
Jim, I used to drive between UC Davis and Sacramento a lot, particularly in the 1970s. I didn’t have air-conditioning in my 1970 IH Scout so I would usually drive with at least my window down, until the temperature got up to about 110 deg F, which was not all that unusual in the Summer.
There was a section of that freeway that had two large fields of well-watered alfalfa. The change in temperature was abrupt — probably about 10 deg in less than 30 yards. The temperature dropped upon entering the influence of the green alfalfa fields, and then rose just as abruptly upon leaving their evapotranspiration influence. But, of course, alfalfa doesn’t grow year round.
LOL, still trying to justify the absolutely pathetic quality of the Met Office sites and data.
All those class 4, 5 stations give so much scope to create bogus warming, don’t they !!
Incompetence, or deliberate, that is the only real question.
I find itt fascinating that they monitor climate by measuring temperature.
Because CBS is a corporation and not a person, I often try to find the source of the information. In this case the link returned “This page cannot be found”. Actually, that is symbolic of CBS in its entirety.
2025 was so hot it pushed Earth past critical climate change mark, scientists say – CBS News
Whenever I see “scientists say” I stop reading and move on.
I see that the Associated Press is a party to this article. I checked with an AI platform (Chat), and it confirmed my recollections that the AP received what were called “philanthropic” payments to cover the climate change issue back in 2022.
I won’t go so far as to call this corruption of the MSM. However, when they are paid to cover the climate issue, I’m willing to bet that they sure as hell are not going to post any article that questions the CAGW narrative. AI says the AP receives most of its operating revenue from selling its news articles, not from donations. Note below what the KR Foundation advocates.
From AI:
1. Major $8 million climate‑coverage grant (2022)
AP announced in 2022 that it received an $8 million philanthropic grant to hire more than two dozen journalists worldwide to cover climate issues.
This was described as AP’s largest single expansion funded by philanthropy.The funding came from a coalition of donors (not a single individual), including well‑known foundations.2. $300,000 donation from the KR Foundation (2022)A Danish climate‑activist foundation, the KR Foundation, gave AP roughly $300,000 in December 2022 to support climate‑related reporting.
The KR Foundation advocates for a rapid phase‑out of fossil fuels.AP added the foundation to its list of philanthropic supporters only later, which drew some scrutiny.
********
Does the article say anything about how warm the Earth was at the peak of the Holocene Warm Period?
Orwellian Climate Big Brother lives, and we are all supposed to listen when he speaks.
The flip side of that coin is that when I asked ChatGPT if it could find the times and amounts of money allegedly paid by fossil fuel companies to ‘skeptics,’ it could not verify any public record of the alleged payments. It instead initially claimed ‘guilt by association’ for SEPP supposedly taking tobacco company money. I chastised it for innuendo instead of the facts I had asked for.
If the claims of fossil fuel companies funding the skeptics cannot be backed up with any actual evidence, it becomes apparent that such claims are the product of the greed for money and power over our energy infrastructure and sheer hatred for the fossil fuel industry.
Which takes us back to the observation that the climate scare industry is a religion and a cult. It is heresy to question the climate scare. It operates on faith in the CO2 and climate scare claims rather than on science and the facts.
For a US temperature check, I went to:
https://www.extremeweatherwatch.com/countries/united-states/average-temperature-by-year. The Tmax and Tmin data from 1901 to 2024 are displayed in a table. Here is the Tmax and Tmin data for these two years:
Year——Tmax——-Tmin——-Tavg Temperatures are ° C
2024—–16.8———4.3———10.5
1901—–14.9———1.6———-8.2
Change-+1.9——-+2.7——–+2.3
Note that although the three metrics has exceeded the 1.5° C limit, I don’t recall any reports on the TV of the any waves of climate catastrophes afflicting the US in 2024. I await for EWW to post temperature data for 2025.
2024 is the warmest (although not any warmer than 1934).
1901 is the coolest.
The separation between the warmest days and the coolest days is about 2.0C or a little more.
Just what the U.S. regional chart (Hansen 1999) shows, a 2.0C+ spread between the warmest and the coldest temperatures since the Little Ice Age ended about 1850.
And, the 1.5 degrees “warming” includes a large dose of “urban heat island” effect that is misattributed to Earth’s general climate.
And a large part that is totally made up.
In the late 1800’s there were very few temperature sites around the world, and basically zero coverage of the oceans.
And in the USA, where the majority of site are.. We know that the 1930s, 40s was far warmer than now.
Any “global” fabrication is totally FAKE.
Actually, going by the written record, it hasn’t warmed since the 1880’s.
It was just as warm in the 1880’s, as it was in the 1930’s, and it was just as warm in the 1930’s as it is today. So, no actual warming today, other than the short-term warming from the 1980’s, which today, has not exceeded the warmth of the recent, recorded past.
The bogus, bastardized Hockey Stick Global Temperature Chart has polluted a lot of minds. It does not represent reality. There is no unprecedented warming today. The Hockey Stick Chart is a fraud created to sell Human-caused Climate Change.
Here is a regional temperature chart (U.S., Hansen 1999) next to a bogus, bastardized Hockey Stick chart.
The U.S. chart shows the real temperature profile of the globe. All the original, regional temperature charts from around the world, have the same basic temperatur profile of the U.S. regional chart, where the temperatures warm for a few decades and then cool for a few deaces, and the temperatures stay within a band of about 2.0C+ between the warmest periods and the coolest periods.
None of the regional temperature charts have a “hotter and hotter and hotter” temperature profile like the bogus Hockey Stick chart. There is no factual support for a Hockey Stick temperature profile. It is one of the biggest frauds ever perpetrated on humanity.
We have actually gone over the 1.5C tipping point? Then physics says the Earth will warm at an ever increasing rate! Dogs and cats living together, mass hysteria.
We’re doomed, doomed I say!
“Dogs and cats living together, mass hysteria”
Humor – a difficult concept
— Lt Saavik
Minor update:
Human sacrifice, dogs and cats living together… MASS HYSTERIA!
(per Google AI)
— Peter Venkman (aka Bill Murray)
Sadly if this insanity does not cease and desist, humans will be sacrificed.
“a three-year average”
Bonkers.
The current definition of climate, derived from the micro climate definition, is 30 years.
The whole bases of the trans-reality alarmism is humans evolved to fear the unknown, a species survival trait. Change puts the unknown in sight. By prestidigitating fearful outcomes, the alarmists play on human nature and create imaginary daemons are reality. Monster under the bed as it were.
The logic fallacy of Appeal to Authority cements the alarmism and once the glue sets, it is very hard to undo.
In other words:
The insanity will continue until sufficient damage is accrued.
There was never a “critical climate change mark.” Just some number(s) pulled out of somebody’s nether region.
1.5 degrees Celsius warmer that The Little Ice Age IS GOOD NEWS, not a “crisis.”
The 1.5°C figure is not so much a ‘political benchmark’ but a pure guess. There is zero evidence behind this figure, and remember, it used to be 2°C.