By: Charles Blaisdell PhD ChE
Abstract
According to many sources, the earth’s Cloud Fraction, CF, is the major source of climate change uncertainty. Cloud Fraction varies a lot from northern hemisphere to southern hemisphere and in-between. Global measurement of CF has a narrow range (64% to 60%). With accuracy challenging climate change models. This essay will slice the earth by latitude and analyze the larger cloud fraction range (82% to 52%) and vapor pressure deficit, VPD. The results show the logical correlation of sun angle to cloud fraction, VPD, and Enthalpy, En, and an unexpected correlation to land fraction. The land fraction correlation is most likely related to the lower water evaporation (per unit of global surface) from land vs ocean. On a global basis land fraction is constant implying that any change in cloud fraction or VPD is related to a change in land’s ET.
Resent research by H. Wu et al (2023), (2), and H Liu et al (2022), (1) have uncovered the effects of El Nino and La Nina on cloud fraction. This essay will show these perturbations in the cloud fraction do not affect the albedo, VPD, or En.
The H. Liu et al paper (1) also shows land moisture is related to climate change. Water evaporation change from land is the basis of the Cloud Reduction Global Warming, CRGW, theory (and model), (3). Global VPD and En are the main variables in the CRGW, theory of climate change.
Introduction
Climate change occurs when the radiation to the earth’s surface does not match the radiation back to space. Cloud reflectivity and surface reflectivity (albedo) are the main measurements of the total radiation to the surface. Cloud reflectivity being larger than surface reflectivity. Total cloud fraction has many sub reflectivity components (all contributing to the uncertainty): Type, height, density, degree of partly cloudy, and probably some others (this author is not a cloud expert, please excuse oversimplification of a complex subject).
Clouds are a small mass of the earth’s total ET mass, but very controlling part of the water cycle. Water evaporated from the oceans and land by the sun’s radiation is a major part of the water cycle. Oceans have the largest part of the cycle.
The basic mechanism of cloud formation is the cooling of moist air as it rises (or meets cooler air or lower pressure air or is forced up) and condense and makes clouds and possibly rain. Where clouds form depends on the global air circulation and where the evaporation of water occurred. Therefore, the main variables of cloud formation are temperature, pressure, and specific humidity. Dewpoint is one measure of probability of cloud formation. Vapor Pressure Deficit, VPD, is another way of looking at dewpoint. (Particulates or aerosols in the air can promote cloud formation. Particulate free air can be super saturated and not form a cloud.) VPD is defined as the difference between the saturated vapor pressure and the actual partial pressure of water.
The equations used in this essay for calculating VPD and En at 1000mb are:
Water saturation pressure, Pws, is from Vaisala Oyj (2013), (4):
| Pws = 6.116441*10^((Temp * 7.591386/(240.7263+Temp))) | (in hPa) Eq 1 |
(Note: the above is not an Arrhenius equation but give similar results.)
Water vapor, Pw, pressure is from Vaisala Oyj (2013) (4):
| Pw = SH *1000/(621.9907+SH | (in hPa) Eq 2 |
| VPD = Pws – Pw | in hPa) Eq 3 |
Enthalpy, En, Vaisala Oyj (2013) (4):
| En = Temp * (1.006+0.00189*SH)+2.501*SH | (in kJ/kg (da) ) Eq 4 |
These equations are not in Clausius–Clapeyron format but simplified for more convenient use with water
The source of water for clouds is evaporation from land and oceans. The dominate evaporation variable is the sun angle (followed by cloud fraction): the more orthogonal and the larger the area the more evaporation. From land the evaporation is from lakes, rivers, groundwater, and vegetation, and all together is called evapotranspiration, ET. For simplicity this essay will use the term ET for all evaporation of water land or ocean. The ET (per unit area of earth) from oceans is 6.45 (1000km^3/% of earth) and from land 2.79 (1000km^3/% of earth), 2.3 times smaller (from data in K. Trenberth et al (2011), (10)). Therefore, it is suspected that the size of land in a slice of earth may influence cloud formation, VPD, and En.
Global Specific Humidity, SH, is proportional to Global ET and the slice data (Google it). This essay will use ET and SH interchangeably since for the most part all the graphs deal with multipoint averages and not specific points. The SH and temperature data is for 1000mb from Physical Science Laboratory, PSL (6). Higher altitude PSL data all have very good correlation to PSL 1000mb data (not shown too many graphs already)
The preferred indicator of the probability of cloud formation is the Vapor Pressure Deficit, VPD. VPD can be measured at a single point or altitude or A representative average of many points VPDs can measure the VPD of a slice of the earth, hemisphere, or the whole earth.
The earth’s Enthalpy, En, has been shown, (9) to be related to the outgoing, LW, radiation, OLR. VPD and Enthalpy are strongly correlated. For atmospheric En, changes in En are changes in OLR radiation.
For incoming short wave radiation, ISR, the albedo (fraction of ISR reflected) from Loeb (2021), (9), and Dubal et al (2022), (7), will be used as the bests measure of ISR for comparison to cloud fraction, VPD, and En.
H. Wu et al (2023), (1), using reanalyzed data set, ERA5, has already done similar earth slicing studies to reveal cloud fraction, CF, changes with ocean vs land and is influenced by EL Nino and La Nina.
H Liu et al (2022), (2), continued with ERA5 data to show a decrease in specific humidity, (SH), correlation to CF as well as H. Wu observation of land vs ocean differences and El Nino and La Nina influence.
Cloud data has been re-calculated by many researchers, this essay will use Climate Explorer, CE, (5) data for it’s graphs. Climate Explorer and ERA5 comparisons are shown in Figure 1. The shift in both CE and ERA5 data in about 2000 is clearly seen.

Figure 1. Comparison of Climate Explorer and ERA5 data
El Nino and La Nina (unpredictable weather patterns, see Figure 2) in the southern Pacific Ocean were correlated to perturbations in cloud cover (1) (2). The contiguous large shifts from El Nino to La Nina were suspected to be related to cloud fraction shifts. Encouraging the search for better predictors of radiation to the earth’s surface. (For further information on El Nino and La Nina please consult the internet.)

Figure 2. Internet graph of El Nino and El Nina perturbations
Methods
Temperature and specific humidity, SH, data from Physical Science Laboratory (6), PSL, for each chosen slice of the earth, VPD, and En were calculated. Cloud fraction data for each slice of the earth was obtained from Climate Explorer and ERA5 data in H. Liu (2023) et al (2).
The slice land fraction was obtained from an internet graph. Slice fractions were estimated for each slice, see Figure 3.

Figure 3. Slice of the earth vs fraction that is land (graph from internet red lines from this essay)
Results
The expected horseshoe plots of temperature, cloud present, VPD, and Enthalpy are shown in Figure 4 (A,B,C,D). Two time periods (start of global warming and current) also plotted in Figure 4 showing where and when the most change occurred. Note that for temperature, VPD, and En the most change occurred in the middle to northern latitudes, while little change in cloud fraction is indicated there but the cloud change is indicated toward the poles. The gap in the curves for temperature, VPD, and En is wider in the northern hemisphere. The northern hemisphere gets more sun and has more land.

Figure 4 (A,B,C,D). Composite graph of Temperature, A, Cloud Percent, B, VPD, C, Enthalpy, D, from earth slicing.
Plotting sun angle instead of latitude range gives two points for each angle which should be the same if sun angle was the only variable related to cloud fraction. In Figure 5, VPD should relate to Cloud Fraction (increasing VPD decrease Cloud Fraction) and Enthalpy (increasing En increases LW radiation out). The Enthalpy correlation is Figure 5 are good for VPD vs En (they should be – they use the same data in different formulas). The correlation of VPD vs cloud percent is not as strong as expected. One point gives a clue to a possible why. The red circled data point is for a slice that has little to no land in the slice.

Figure 5. VPD vs CF and En.
To investigate the land correlation further a two variable linear regression table was created from the data in Figure 5, see Table T1.

Table 1 Data from Figure 5 for Regression analysis
The results (see attachment here) of the regression analysis show that the R^2 of the expected sun angle vs cloud percent is only 0.30, when land fraction of the slice is added the R^ jumps to 0.83; therefore, land fraction is playing a role (statically) in the cloud fraction of the slice. Sun angle and land fraction corelate to VPD better than to cloud fraction with an R^2 of 0.90. Enthalpy had the best correlation to sun angle and land with an R^2 of 0.95. Since Enthalpy has been correlated to outgoing LW, OLR, radiation implies that in addition to the expected slice correlation of OLR to sun angle there is also a correlation to land fraction in the slice. That land fraction in the slice has two components related to cloud fraction: physical area and ET. The sliced profiles shown in Figure 4 (A, B, C, D) show the shift in slice data with time. Since the land fraction area is not changing during the time change, this implies that the ET must have changed (ET decreased on land). On a global basis, CRGW theory (3) mathematically shows how this land decrease in ET can cause a global increase in ET and global warming.
The 20 years of CERES data presented by Loeb et al (2021) (9) and Dubal et al (2021) (7) show the albedo (the reflectivity of the earth) of the earth decreasing, R^2 = 0.73. This decrease in albedo should correlate to CE cloud fraction decrease. In 20 years of CE data (that matches Dubal 20 years) this correlation is very poor (R^2 = 0.1) (not shown). For about 40 year of CE data the R^2 improves to 0.61, see Figure 6.

Figure 6. CERES albedo data (Dubal) vs Cloud Percent (CE)
VPD which has been shown to correlate to cloud fraction (poorly) correlates well to CERES albedo, see Figure 7. Global Enthalpy (related to OLR) correlates to CERES albedo even better, see Figure 7. The perturbations of El Nino and La Nina seem to be affecting cloud fraction data but not albedo, VPD, or Enthalpy data.

Figure 7. VPD and En vs CERES albedo
Discussion
Slicing the earth’s data has revealed expected correlation of sun angle to cloud fraction, VPD, and Enthalpy and interesting correlation to land fraction. The land fraction seems to be related to a change in the ET of the land.
El Nino and La Nina are causing perturbations in the cloud fraction data that are not visible in the albedo, VPD, or Enthalpy data. This could be related to cloud type change when the circulation patterns switch rotation from El Nino to La Nina (see internet for more information).
Strong correlation of Enthalpy (related to OLR) to albedo suggests one of earth’s albedos components is related to global warming. Since incoming radiation is relatively constant and the earth’s cloud free albedo is small (about 15% of total albedo) and not changing very much that leaves cloud fraction. VPD is poorly correlated to cloud fraction on a slice and global basis, but very well correlated to CERES albedo making VPD a candidate to replace cloud fraction in climate change models until a better measurement of cloud fraction is found. Enthalpy is strongly related to VPD. The CRGW theory (3) ties all this together.
CRGW theory: a change (-/+) in land’s ET starts a natural chain of events that changes the earth’s energy balance (+/-). In more words: less ET on land leads to higher land VPD. Higher VPD on land leads to a plume of hotter air than mixes with upper atmospheric air to reduce clouds over land and ocean. The reduced clouds let in more sunlight increasing the En of the earth to warm the earth and evaporate more water (the ratio of ocean ET to land ET increases). The final observation is that a lower land ET results in a higher global ET, higher temperature, and lower relative humidity. The CRGW theory is reversable.
CO2 is innocent but clouds are guilty.
Bibliography
- “Opposing trends of cloud coverage over land and ocean under global warming” (2023) by Huan Liu, Ilan Koren, Orit Altaratz, and Mickaël D. Chekr web link acp-23-6559-2023.pdf
- Variation and comparison of cloud cover in MODIS and four reanalysis datasets of ERA-interim, ERA5, MERRA-2 and NCEP (2023) by Haopeng Wu Xiaofeng Xu Tianyang Luo , Yudi Yang, Zixu Xiong, Yuan Wang web link Variation and comparison of cloud cover in MODIS and four reanalysis datasets of ERA-interim, ERA5, MERRA-2 and NCEP – ScienceDirect
- “Cloud Reduction Global Warming, CRGW 101. A Competitive Theory to CO2 Related Global Warming” (2025), by Charles Blaisdell, web link Cloud Reduction Global Warming, CRGW 101. A Competitive Theory to CO2 Related Global Warming – Watts Up With That?
- “HUMIDITY CONVERSION FORMULAS” by Vaisala Oyj (2013) web link Humidity_Conversion_Formulas_B210973EN-F (hatchability.com)
- “Radiative Energy Flux Variation from 2001–2020” (2021) by Hans-Rolf Dübal and Fritz Vahrenholt web link: Atmosphere | Free Full-Text | Radiative Energy Flux Variation from 2001–2020 | HTML (mdpi.com)
- Norman G. Loeb,Gregory C. Johnson,Tyler J. Thorsen,John M. Lyman,Fred G. Rose,Seiji Kato web link Satellite and Ocean Data Reveal Marked Increase in Earth’s Heating Rate – Loeb – 2021 – Geophysical Research Letters – Wiley Online Library
- Can Annual Irradiance = Annual Enthalpy? If So, What Does It Show About Climate Change (2025) by Charles Blaisdell web link More Evidence on Vapor Pressure Deficit, Cloud Reduction, and Climate Change – Watts Up With That?
- Atmospheric Moisture Transports from Ocean to Land and Global Energy Flows in Reanalyses (2011) by Kevin E. Trenberth, John T. Fasullo, and Jessica Mackaro web link Atmospheric Moisture Transports from Ocean to Land and Global Energy Flows in Reanalyses in: Journal of Climate Volume 24 Issue 18 (2011),
More essays by Author
- Where have all the Clouds gone and why care? – Watts Up With That?
- CO2 is Innocent but Clouds are Guilty. New Science has Created a “Black Swan Event”** – Watts Up With That?
- More on Cloud Reduction. CO2 is innocent but Clouds are guilty (2023). – Watts Up With That?
- An Unexplored Source of Climate Change: Land Evapotranspiration Changes Over Time. – Watts Up With That?
- VPD, Vapor Pressure Deficit a Correlation to Global Cloud Fraction? – Watts Up With That?
- Soundings, Weather Balloons, and Vapor Pressure Deficit – Watts Up With That?
- Not that ET! The Terrestrial ET: EvapoTranspiration, the Unexplored Source of Climate Change – Watts Up With That?
- CRGW 101. A Competitive Theory to CO2 Related Global Warming – Watts Up With That?
- More Evidence on Vapor Pressure Deficit, Cloud Reduction, and Climate Change – Watts Up With That?
Big leap of faith there. What about all of the lost surface ice and snow? Permafrost is still receding. I expect it will be 200 years before it starts expanding again.
There has been a gradual reduction in snow cover through the CERES period. Sure winter snow extent is higher but it melts faster because the solar intensity is rising strongly through March and April in the Northern Hemisphere.
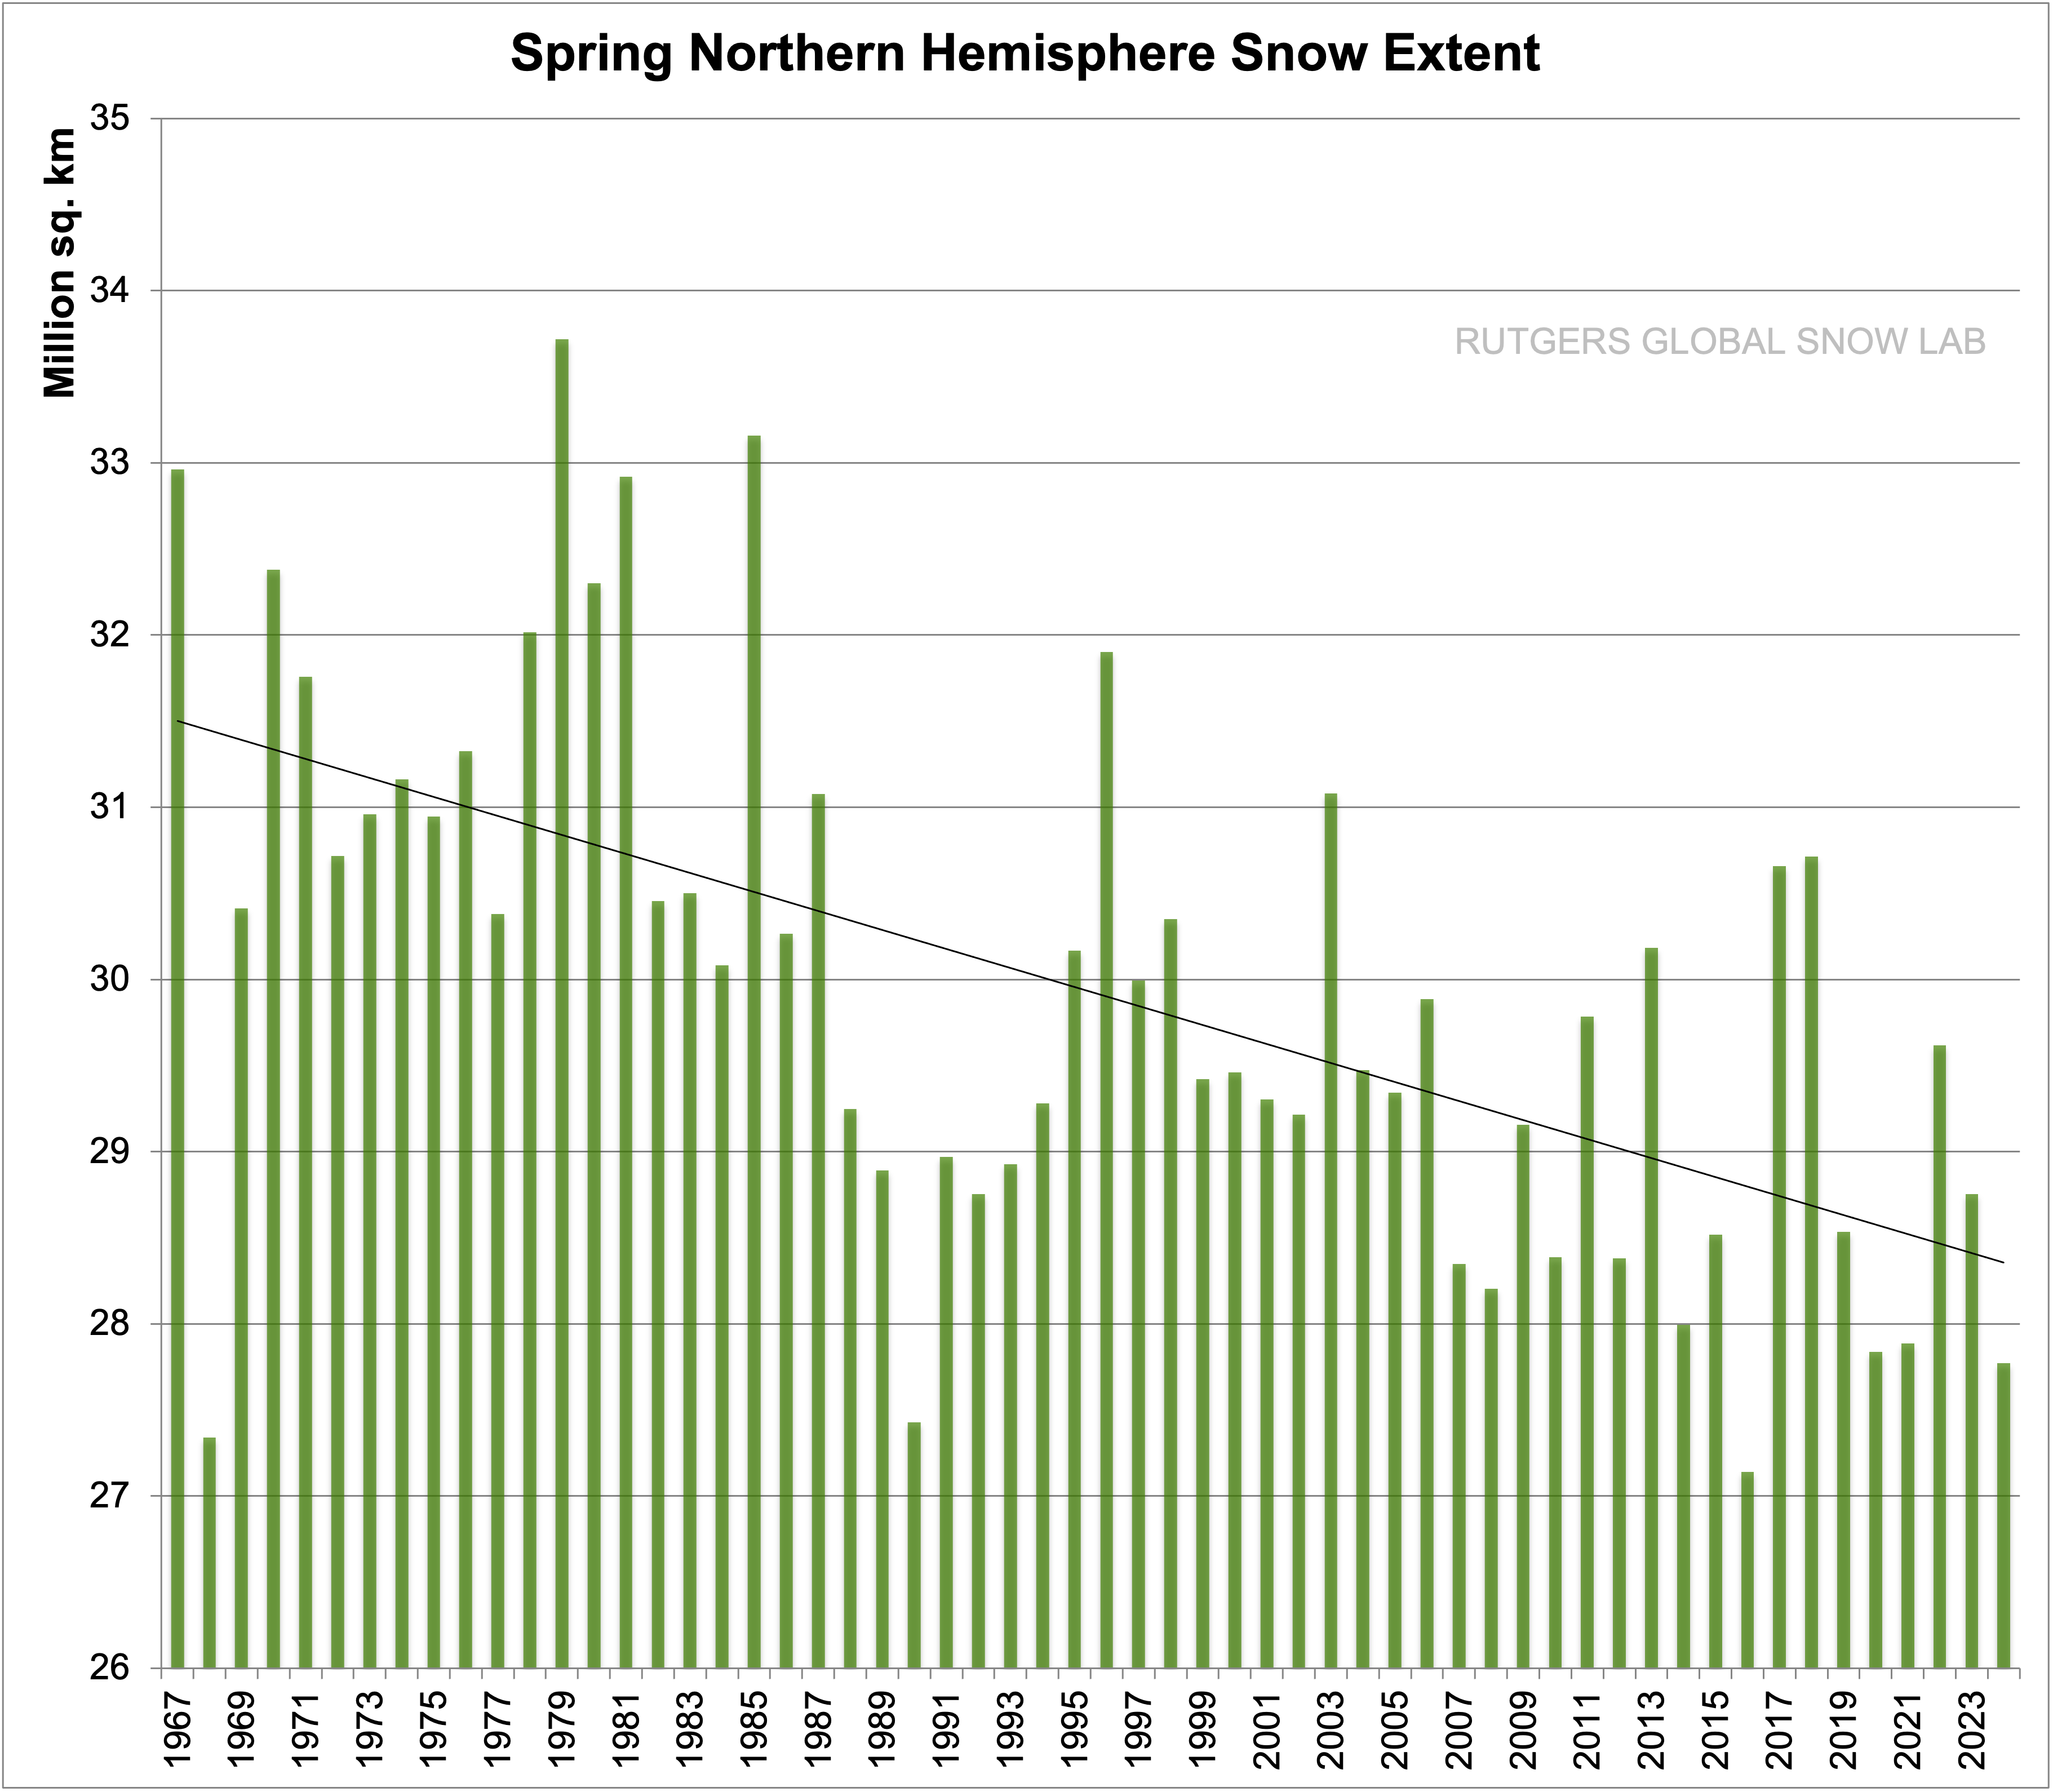
The winter snow extent is increasing but there is not much sunlight then. So the accelerating loss in autumn is dominating the change in Albedo due to changes in surface ise/snow..
Is there a reason the vertical scale does not start at zero? I notice the same thing in some of the graphs in the article.
The chart comes from Rutgers Snow Lab – ask them. From my perspective, the scale highlights the downward trend I am pointing out.
Highlights = exaggerates?
Highlights the trend at the expense of exaggerating the rate of change. Joe public falls for it all the time.
Software for charts usually allows for “broken axes”. Such could have been used but just like non-defined acronyms, this happens too much. Find the first use of “ET” in the post.
Yeah, that got me too. I thought he might me talking about that guy on the flying bike.
I had professors, and bosses, who believed that all graphs had to start at zero. I had other professors, and bosses, who wanted the vertical scale chosen to encompass the data only. thereby allowing a better understanding of the data. I did my graphs the way the professor or boss wanted them. I was smart enough to be able to interpret the data either way.
Rick,
You are one of the leading measurement and interpretation people with some aspects of the water cycle. Thoughts? If the measured evaporation rate is higher over sea than land, should the effect show more rain over land than sea, with river runoff mainly restoring the balance? This water cycle takes a bit of energy if treated like a heat engine – is this energy high enough to have a place in models? What effect does it have on air temperatures as measured above the surface from transport of hot waters here, cold waters there?
There is so much meat in this article that my brain is getting tired and seeing many questions. Will have to read it a couple more times. Geoff S
Geoff,
I have only looked closely at the most powerful convective cells. They absorb most heat in the lower part and bottom of the column (ocean surface) at around 295K average and release it to space at average around 220K mostly above 6,000m. So the limiting efficiency of the associated Carnot heat engine is 25%.
The actual work averages around 55W/m^2. So if you consider the area of tropical ocean at 30C you can get some idea of the power of the Hadley cells that drive poleward advection..
The advective heat transfer is almost 50/50 latent heat to sensible heat. So you get a good idea of the heat transport from ocean to land by looking at the runoff, calculating the latent heat win the rain and then doubling that to determine the sensible heat.
This chart shows the net radiation heat uptake or loss for ocean in and land as well as the calculated heat from the rainfall for 2019::
 ?quality=75&ssl=1
The moist tropics have net positive radiation uptake because they act like the ocean.
This next chart shows where the majority of the runoff comes from but just for May, which is the highest month:
 ?quality=75&ssl=1
The role of the moist tropics is noticeable; particularly the Amazon. Runoff from the high northern latitudes in May is predominantly associated with snow melt.
“The water cycle takes a bit of energy” the way the oceans cover “a bit” of the surface! One day’s precipitation transports more energy into the clouds than a decade of CO2 heat energy could manage.
How fortunate we are that the GCM’s do such a wonderful job of modeling the effects of clouds! /s
Also, what about the decrease in Earth’s albedo due to the “greening” of Earth over the last fifty or so years (attributed to both increasing levels of atmospheric CO2, aka “plant food”, and gradually warming temperatures) . . . you know, green vegetation having a lower albedo (0.07–0.25) compared the rocky ground (0.1–0.4), dry sand/deserts (0.35–0.40), and fresh snow (0.8–0.9) and ice (0.5–0.7).
Climate science has a bad habit of thinking they can “guess” at an accurate average of a non-linear, chaotic process that varies over time and space. That pretty much applies to albedo as well as temperature.
You mean “climate science”, not climate science?
You say the clouds are guilty.
I think they are doing a good job, as is CO2.
Hiding in the background, phytoplankton and terrestrial plants that emit compounds leading to cloud condensation particles agree.
Harold The Organic Chemist Says:
At the Mauna Lao Obs. in Hawaii, the concentration of CO2 in dry air is 425 ppmv. One cubic meter of this air has a mass of 1.29 kg and contains a mere 0.83 g of CO2 at STP.
In air at 70° F and 70% RH, the concentration of H2O is 17,780 ppmv. One cubic meter of this air has mass of 1.20 kg and contains 14.3 g of H2O and 0.77 g of CO2. To first approximation and all things being equal, the fraction of the greenhouse (GHE) effect due to H2O is given by:
GHE=moles H2O/(moles H2O+moles CO2)=0.79/(0.79+0.017)=0.98 or 98%
This calculation assumes that a molecule of H2O and a molecule of CO2 each absorb about the same amount of out-going long wavelength IR light. Actually, H2O absorbs more IR light than CO2.
These calculations falsify the claims by the IPCC that CO2 causes global warming and is the control knob of climate change. The purpose of these claims is to provide the UN the justification for the distribution of donor funds, via the UNFCCC and the UN COP, from the rich countries to the developing (i.e., poor) countries to help them cope with the alleged harmful effects of global warming and climate change.
After EPA administer Lee Zeldon rescinds the 2009 CO2 Endangerment Finding. the greatest scientific fraud since the Piltdown Man will finally come to an end.
Water vapor absorbs more infrared (IR) light than carbon dioxide, making it the most significant/versatile greenhouse gas.
Whereas CO2 is a strong absorber mostly at 15 micrometer, it contributes practically nothing to global warming,
H2O absorption is broader and more pervasive, contributing almost all of the greenhouse effect, especially in the tropics, where its concentration is at least 50 times greater than CO2.
Minimal Temperature Change due to CO2: The climate is not any different, even though, atmosphere CO2 increased from 280 ppm in 1850 to 420 ppm in 2025, 50% in 175 years. During that time, world surface temps increased by at most 1.5 C +/- 0.25 C, of which:
.
1) Urban heat islands account for about 65% (0.65 x 1.5 = 0.975 C), such as about 700 miles from north of Portland, Maine, to south of Norfolk, Virginia, forested in 1850, now covered with heat-absorbing human detritus, plus the waste heat of fuel burning. Japan, China, India, Europe, etc., have similar heat islands
https://wattsupwiththat.com/2025/05/16/live-at-1-p-m-eastern-shock-climate-report-urban-heat-islands-responsible-for-65-of-global-warming/
2) CO2 accounts for less than 0.3 C, with the rest from
3) Long-term, inter-acting cycles, such as coming out of the Little Ice Age,
4) Earth surface volcanic activity, and other changes, such as from increased agriculture, deforestation, especially in the Tropics, etc.
.
BTW, the 1850 surface temp measurements were only in a few locations and mostly inaccurate, +/- 0.5 C.
The 1979-to-present temp measurements (46 years) cover most of the earth surface and are more accurate, +/- 0.25 C, due to NASA satellites.
Any graphs should show accuracy bands.
The wiggles in below image are due to plants rotting late in the year, emitting CO2, plants growing early in the year, consuming CO2, mostly in the Northern Hemisphere. See URL
https://gml.noaa.gov/ccgg/about.html
Here are four articles attesting to the small global warming role of CO2 in the atmosphere
.
Eight Taiwanese Engineers Determine Climate Sensitivity to a 300 ppm CO2 Increase Is ‘Negligibly Small’
https://www.windtaskforce.org/profiles/blogs/eight-taiwanese-engineers-determine-climate-sensitivity-to-a-300
By Kenneth Richard
.
The Fairy Tale of The CO2 Paradise Before 1850…A Look at The Real Science
https://www.windtaskforce.org/profiles/blogs/the-fairy-tale-of-the-co2-paradise-before-1850-a-look-at-the-real
By Fred F. Mueller
.
Achieving ‘Net Zero by 2050’ Reduces Temps by 0.28 C Costing Tens of $TRILLIONS
https://www.windtaskforce.org/profiles/blogs/achieving-net-zero-by-2050-reduces-temps-by-0-28-c-costing-tens
By Kenneth Richard
“BTW, the 1850 surface temp measurements were only in a few locations and mostly inaccurate, +/- 0.5 C. “
I’d multiply that by at least 3.
“The 1979-to-present temp measurements (46 years) cover most of the earth surface and are more accurate, +/- 0.25 C, due to NASA satellites.”
Which is bullcrap. No one *knows* what the actual measurement uncertainty is because NASA assumes that all measurement uncertainty is random, Gaussian, and cancels. They can’t even *measure* the path loss through the atmosphere associated with each measurement so they just ignore it. Chalk up one more problem with not handling clouds correctly.
Hey, Tim, I’m kinda surprised. This “article” above is an extensive exercise in what you call “data matching”. Or was it “data fitting”? Anyway, I can’t see the steaming rage you usually drive yourself into when you detect this reprehensible 😉 behavior.
As almost always with you, this is wrong on multiple levels.
And this gem is from another comment of yours:
The ancient question is: how do you know all this? You have to have high good climate and biosphere reconstructions with dense temporal and spatial resolution for an assertion like this. You deniers violently (literally) reject each and every modern, really high quality reconstruction. Mann’s was among the first here.
You are confusing the instrument laboratory-calibration certificate with the system uncertainty, which includes influences beyond just the sensor. The researcher(s) has(have) a responsibility to consider, and report, all environmental variables that impact the conclusions of the research. That includes even such things as the sampling protocol.
That is not true. The most critical requirement is stationarity. That typically requires a correction for the autocorrelation inherent in time-series that have a trend. At the very least, one has to remove the trend, but that is done by subtracting the trend line, which has an uncertainty because of the large standard deviation created by the trend. There is an issue of the definition of what is being measured. In the case of temperature, one only gets one opportunity to measure the temperature of a particular air parcel. Were there many measurements (>100) taken with negligible time between measurements, then one would be justified in increasing the claimed precision by one significant figure. Instead, what climatologists and their apologists do is measure ‘balls’ (such as golf balls, pickle balls, tennis balls, baseballs, basket balls) and claim that because the number is very large, they are justified in dividing the SD by the sq. rt of the number of samples to increase the resolution of the measurement. Despite the fact that the diameter will change as the fractions of the various balls changes. That violates the requirement that the thing being measured multiple times must be the same and not a population of similar things.
Surely you aren’t defending Mann’s ‘hockey stick!”
Why do you think I thought otherwise?
This has nothing to do with the autocorrelation. Autocorrelation is a property of the measured quantity (the measurand). The measurement uncertainty is the measurement reading’s difference from the measurand, not the measurand’s differences from itself, ie. its evolution, where the autocorrelation would be important.
“Why do you think I thought otherwise?”
Because of your statement “The uncertainty value comes from the instrument’s vendor,”
Measurement uncertainty has many factors. Field measurements typically are *NOT* done immediately after vendor calibration of a particular instrument in a lab.
“The measurement uncertainty is the measurement reading’s difference from the measurand, not the measurand’s differences from itself, ie. its evolution, where the autocorrelation would be important.”
What are you babbling about here? Temperature measurements made at different locations or at different times are *NOT* the same measurand. Yet climate science treats them as if they are. Therefor the measurands difference from itself, over time, *is* the very definition of autocorrelation.
Type A measurement uncertainty *only* works if the measurements taken are of the same thing, using the same calibrated instrument (sometimes even calibrated between measurements), under the same conditions (typically taken over a short period of time to minimize environmental change).
This is why Type A measurement uncertainties are typically only part of the measurement uncertainty budget in field measurements.
The fossil record for one! Are you a Creationist?
No, we reject the assumption of accuracy of the reconstructions down to the hundredths digit of temperature.
I’d like to remind you that this is all about your assertion that no one knows the uncertainty of NASA’s instruments.
Please take a look around a typical NASA mission and see why it takes years to prepare a few cubic meters of stuff that goes into a probe.
I knew you wouldn’t understand it… Clyde was bsing about why measurements are NOT independent. I just explained it why autocorrelation was irrelevant here. This is at least the fourth or fifth time that we run this circle.
This is calibration. We are talking about the use of these instruments.
I don’t understand why you think it’s not included.
Exactly. It doesn’t matter whether it’s non-Gaussian, or asymmetric. This is a mathematical thing, it’s very simple to prove, freshman level.
I have to tell you again, bsing won’t get you far. You always forget this 😉
So what? Rain fade is part of the measurement uncertainty budget. It prevents accurate measurement of the measurand.
Again, so what? I’ve done similar stuff trying to fit temperature measuring equipment into a maze-solving robot for use in firefighting. Most of the time is spent in minaturizing the instruments and insulating them from external conditions.
Autocorrelation in a time series *IS* relevant. As is the variance over time. Trending only works with stationary data. That implies same mean and variance over time as well as being independent. You are *still* showing you simply have no concept of metrology basics.
What in Pete’s name do you think a Type A measurement of an instrument is for? It’s a *starting* point in the measurement uncertainty budget!
How do you think it is included? You can’t measure it in a field instrument unless you have a portable calibration lab and actually use it.
Of course the shape of the distribution matters! It has to do with the ACCURACY of the resulting measurements!
“I have to tell you again, bsing won’t get you far. You always forget this”
You didn’t answer the question. That is telling.
You just keep digging your hole deeper. Stop digging.
Why don’t you think NASA knows the lessons of metrology? Why do you think NASA knows less than any other entity that does measurements? Why don’t you think they take into account all these? Be careful, I’m not claiming they can miraculously compensate for all the problems, I only claim they do what we can expect from them to do with all these.
The autocorrelation of the measurand is irrelevant to the independence of measurements.
This is hilariously wrong 😉 This is literally the slapstick version of metrology. Why do you want to do trending (ie. calculating a certain type of general change over time) with stationary data (ie. non-changing data)? But this is not even important. I think you are expressing your belief that science is all about trending, but you’re, of course, wrong.
When they use the instrument the uncertainty budget is calculated from the known characteristics, as supplied by the vendor, or if they need it, they calibrate it after integration, or even they use a field lab, if it’s so important (and NASA is known for doing these things) And so on. They don’t care about Type A measurements after they have mapped the characteristics of the instrument, they just use the results in the budget.
It doesn’t matter for the “cancelling” part. Again, this is just maths. What you are doing is like arguing that 2+2 is 5.
Well, that wasn’t a question, that was a clumsy attempt on your side to sneak out from answering the real question: how do you know that “the higher CO2 in the past did not cause catastrophic climate change on the earth…” This is the real question. Yeah, the fossil record. How? You deniers doubt even the reconstructions for recent times based not on the fossils but the instrumental record, not to mention the times when CO2 concentration was much higher, millions of years ago. How do you know there was no catastrophic climate change? How do you know anything about these? (I know the answer, you don’t, you just like to mention it as something self evident.)
It’s not a matter of not knowing, it’s a matter of ignoring.
Can *YOU* find any white papers that take into account raid fade measurement uncertainty in the satellite measurements? I can’t.
Again, independence is only ONE of the factors to be considered. It’s not the *only* one involved. If you are going to trend the measurements of the measurand then what factors do *YOU* think need to be considered?
You just showed your ignorance for everyone to see. When the data is part of a time series (the basis for autocorrelation) you have to insure the measurement is not affected by the time point at which it is measured. Stationary does *NOT* mean non-changing.
you are in a hole. I suggest you stop digging. You don’t even seem to know what this whole forum is about.
Just how many temperature measurements used for climate science are made using a field calibration lab. How many calibration runs are done on field temperature measurement devices over a year? Over a decade? How many were made from 1850 to 1950? How do you calibrate a LIG thermometer?
you are in a hole. I suggest you stop digging.
ROFL!! So a field measuring device whose calibration drifts upward due to heat drift in the components or from UV degradation of the container surface paint will always see cancellation of its measurement uncertainty? Tell all of us just how that works out mathematically!
“how do you know that “the higher CO2 in the past did not cause catastrophic climate change on the earth”
Mammals didn’t die out when CO2 was higher, did they? The fossil record shows that. But you don’t really believe the dinosaurs existed do you? What do you think *very* large dinosaurs ate? How much of it do you think they had to eat every day?
No, that is *NOT* what we sceptics believe. We believe the temperature reconstructions have measurement uncertainty that prevents knowing values down to the hundredths of a digit. The same thing applies to calculation of a “global average temperature” today! I can’t find anywhere that accounts for the different variances of cold temps and warm temps when calculating the GAT. Yet that data *should* be weighted to account for the different variances – and anomalies don’t help since they inherit the variances of the parent averages. Cimate science just jams it all together willy-nilly and doesn’t even account for the fact that their mid-range temperatures at the base of everything don’t actually describe CLIMATE!
First differencing of data created from non-weighted measurements can’t correct for the time dependence of the measurements. Removing seasonality doesn’t help correct the for the different variances of the component data!
Have you dug your hole deep enough? Are you going to keep on digging?
Then why do you think they are ignoring it? 😉
I’m not looking for it at all. Again, these missions are prepared for years, and science is science for it precisely being non trivial. Perhaps you should ask them. You know scientists and engineers are eager to answer your questions if you don’t alienate them with your bs and hostility.
Again, for uncertainty propagation, autocorrelation is irrelevant, while measurement independence is literally the most important factor.
None. Field calibration labs are for (surprise) calibration.
The necessary number. The number that is required by the relevant standards and manuals. Why do you think it is otherwise?
Please don’t drift away from the subject. We were talking about the shape of the distribution. For the various drift factors, see above. They are handled in the way they have to be handled.
Is this supposed to be a serious answer? There are, of course, serious climate and biosphere reconstructions, and they, of course, do not contradict climate science. Your problem is that you can’t point to any study even if you knew one (I doubt) because these are all coming from researchers like Mann. This is why you are bsing about this.
For the hundredth time, this is not how it works. Your inability to understand a few simple formulas may be the reason why you are a “skeptic” 😉
No comment about the UN’s fraudulent scheme to transfer wealth form the rich countries to the poor countries?
Here some casualties of this fraud: NY, CA, WA, Australia, Germany, and especially the UK.
“Climate change occurs when the radiation to the earth’s surface does not match the radiation back to space.”
No, it doesn’t. Global warming or cooling is what occurs when “radiation to the earth’s surface does not match the radiation back to space.” A change in climate parameters other than temperature is what may occur when the globe warms or cools. So what is it your are talking about?
I agree, but the battle for the meaning of some words has been lost. Humpty Dumpty famously claimed that words mean exactly what he chooses them to mean.
Think of the difference between these: 1.5°C and 1.5C°
A mismatch between incoming and outgoing energy will likely cause a climate change. But it could happen even without the mismatch. Possibly there can be several climate configurations with the same incoming/outgoing energy.
The big problem is that the higher CO2 in the past did not cause catastrophic climate change on the earth. Vegetation didn’t disappear because of high temperatures. Animal life didn’t disappear from the earth because of high temperatures. Same for cold temperatures.
I can’t find where hardiness zones have changed at all over the past 200-300 years. Corn still grows where corn has always grown. Same for wheat. Places like Texas has not turned into more of a desert climate than it has been. South Dakota isn’t frozen over or growing palm trees. Boston and New York are not underwater. Neither is San Diego or Tokyo. Desertification has not increased, in fact it has decreased just like hurricane occurences have.
Where is the “C” in CAGW?
The Sun and how it affects us directly and indirectly – cosmic rays etc – remains an enigma. While this area is certainly worthy of much more investigation, the climate remains a political issue in need of a cover story. Namely CO2.
Melissa Fleming, Under-Secretary-General for Global Communications at the United Nations, tells the WEF, “We own the science, and we think that the world should know it
And that science is?
Climate change ‘beyond scientific dispute,’ National Academies report says – Politico
A riposte, rebuttal even, to the recent Trump administration’s report. Yet, given the inexorable slow increase in temperatures which they took every opportunity to blast at us… “Summer 2025 is the warmest on record for the UK says Met Office“. It really wasn’t… their projections/predictions/prognostications/scenarios etc etc were in line with their extreme weather idea; the warmer, the more extreme the storms… obviously
NOAA predicts above-normal 2025 Atlantic hurricane season
Above-average Atlantic Ocean temperatures set the stage – NOAA
The BBC is more than baffled that the alarmist predictions all went west (again).
It’s the peak of the Atlantic hurricane season but – very unusually – there are currently no tropical storms or hurricanes. – BBC
They should ask the UN c/o Melissa Fleming – owner of the science.
In Fig. 5 the 74.15 would be more an 83? And what is x in fig. 6?
And La Nino and El Nina in fig 1.
Charles. Great article, great research, and congratulations on a proper bibliography, so often missing on internet essays. Your classically trained engineering background is showing through. Gonna take more than a morning coffee break to absorb the info.
Been a “statistical cloud guy” myself for a long time, pointing out to CO2 Chicken Littles that doubling CO2 is 4 watts of forcing….and we live on a water world planet where only 76 watts of evaporation at surface produces 65% cloud cover…which is the root cause of much of the entire planet’s albedo, downwelling IR, advection, convection, you-name-it. So a couple of degrees of warming at surface causes a significant amount of clouds….just a day later and a few hundred km away….or maybe overhead this afternoon.
Following graphic credit to Willis…himself a tropical thunderstorms guy…
Nonsensical pseudoscientific bafflegab. What does that even mean? As Fourier said, the Earth loses all the heat it receives from the Sun, plus a little internal heat.
Only the ignorant and gullible could believe that the Earth is miraculously getting hotter!
Unfortunately, there seem to be a lot of them about – intelligence and education notwithstanding.
Your lack of understanding of how doubling of CO2 results in a little bit of IR to be emitted down from the sky and reemitted up again from surface (a phenomenon called “temperature”) means that any scientifically trained mind would consider your statements to be not worth listening to….
-Richard Feynmam.
You may be smarter than Baron Fourier, Professor John Tyndall, and Richard Feynman all put together, for all I know.
That still doesn’t protect you from being ignorant and gullible.
Adding CO2 to air does not make it hotter. Sorry about that, but it’s true.
Well, consider a column of atmosphere…say the size of your yard by the height of the atmosphere…..and basic radiative considerations…..if the same amount of sunlight comes in the top of the column, and you double the amount of IR absorbing and re-radiating gas within the column….it turns out that the temperature at the bottom of that column is going to go up a bit to maintain outgoing=incoming at the top…by 1% or so in the case of CO2….It is, however a very small amount of energy compared to the kinetic energy of the air in that column due to convection and advection, not to mention energy reflected and emitted by clouds, transferred by evaporation, and so on.
No, it doesn’t.
Michael Flynn said –
You pointedly refuse to mention “most important Greenhouse Gas – H2O”. Is that due to animal cunning, or memory impediment?
A loaded question, of course.
“double the amount of IR absorbing and re-radiating gas within the column”
“it turns out that the temperature at the bottom of that column is going to go up a bit”
Why? You’ve doubled the amount of IR radiating gas which means *more* heat loss out of the column.
Are you implying that doubling the amount of radiating gas does *not* also double the radiation from the radiating gas?
Reminds me of someone else’s post about the perils of modeling circa 2010 – “In a world with spherical cows, all steaks are round”.
Nonsensical word salad. There is no “global warming. Hotter thermometers are due to increased heat. Clouds produce no heat, and the Earth is cooling, anyway.
Another meaningless article, directed at the ignorant and gullible.
“Climate change occurs when the radiation to the earth’s surface does not match the radiation back to space” ……not really. Radiative theory (CO2) likely only plays a relatively minor role at the poles. Thermodynamics via the water cycle from tropics out to the pole dominate. If radiative model (aka GHG effect driver) is the dominant climate driving mechanism, why is it that earth is hottest in July when furthest from Sun and coldest in January when closest?
Answer: Land v ocean exposure.
Collection by David Siegel is a tech entrepreneur from Silicon Valley.
https://youtu.be/X1Z2G5QOhFU?si=3i1bjBUZbSmf1Ca9
Supported here by William van Wijngaarden chaired the Faculty of Science and Engineering Council (2005-06) and York’s Senate (2010-13) at York University.
https://youtu.be/WfwnKWIWPzk?si=aBCKe2qkE6RTTX4Z
For those that like to quote Arrhenius, Angstrom responded pretty quickly (<1yr later) .
https://journals.ametsoc.org/view/journals/mwre/29/6/1520-0493_1901_29_268a_kaoaa_2_0_co_2.xml
I read a recent article pointing out how albedo of the earth is not thoroughly understood by scientists. However, it is no doubt that clean green virtuous scientists understand that man made CO2 is causing evil global warming. The albedo and the intricacies of climate are not understood because it is very complicated.
It’s a matter of it being a non-linear chaotic process that varies over time and location. And climate science just does it’s usual “simplification” and assumes they can accurately guess at an “average” value that will work in a model parameterization.
But science is hard.
From the abstract of the above-cited paper:
“The land fraction correlation is most likely related to the lower water evaporation (per unit of global surface) from land vs ocean. On a global basis land fraction is constant implying that any change in cloud fraction or VPD is related to a change in land’s ET.”
I have to dispute that argument. In the Pacific ocean the sea-surface temperature can vary significantly with the seasons and with cloud coverage, which is not constant. Pacific ocean SSTs at mid-latitudes can vary up to 10 °C over the course of a typical year as the elevation of the Sun in the sky and consequently the hours of sunshine change. (Atlantic ocean seasonal variation at mid-latitudes is slightly less at about 8 °C).
Conservatively calculating the theoretical rate of water evaporation from a smooth ocean surface—at an assumed 50% relative humidity and with an assumed average gentle breeze (2 m/s, or 4.5 mph)—at a SST of 20 °C versus that at a SST of 10 °C, the difference is about 460 g/hr/m^2 compared to about 240 g/hr/m^2, respectively. That’s about at 2:1 difference in ET over the world’s ocean area as the seasons change.
Next one would also have to factor in the fact that in the NH land covers about 39% of the surface, but in the SH land only covers about 19% of the surface.
Based on just the above, I assert that worldwide changes in cloud coverage and VPD are equally, even more likely, to arise from changes in ET occurring over Earth’s oceans rather than changes in ET occurring over land.
That is generally true for terrestrial materials such as soil and vegetation, but only true sometimes for water.
https://wattsupwiththat.com/2016/09/12/why-albedo-is-the-wrong-measure-of-reflectivity-for-modeling-climate/
. . . and generally NOT TRUE for surfaces covered by snow and/or ice.
From Google’s “AI overview”:
“Snow and ice have a significantly higher reflectivity (albedo) than most clouds, reflecting up to 90% of sunlight, while clouds typically reflect between 30% and 80%.”
Since about 10% of the Earth’s surface is permanently covered by snow and ice, this is not something that can be easily dismissed.
That surface area isn’t even slightly evenly illuminated however.
Errrrrr . . . during the respective summers at both the North Pole and the South Pole, the Sun reaches maximum elevations in the sky of about 23.5 degrees, yielding plenty of sunlight then.
At the edge of the Arctic Circle during the peak of NH summer, the Sun is at an elevation above the horizon of about 47 degrees, providing an even greater duration of sunlight compared to being directly at the North Pole. Same goes for the Antarctic Circle.
I do believe these facts are taught at high school level . . . at least in the US.
I am aware that sunlight shines on the polar regions, but I’m pointing out that the overall level of illumination is much lower there than it is at the tropics say. This is why there aren’t too many beachfront resorts in the area, so that 10% area needs to be scaled down some if one wishes to compare apples to apples.