Introduction
A recent paper published in the Journal Nature by Dean et al. provides an interesting and compelling argument that a significant source of atmospheric CO2 has been underestimated by carbon budget models. The study, Old carbon routed from land to the atmosphere by global river systems looks at the origin of the CO2 released by river water into the atmosphere and concludes that the amount of ancient (millennia old) CO2 is higher than has been used in the current carbon cycle models.
This “leakage” of ancient carbon, found in soil, sediments, and geological stores, is reported to be comparable in magnitude to the net exchange of carbon between land and the atmosphere. The findings also suggest that plants and shallow soil layers may be removing more CO2 than previously thought, but this is offset by the release of old carbon from rivers.
A recent interpretation of this paper and its use of carbon isotopes called into question the well-established connection between human CO2 emissions and the 50% increase in atmospheric CO2. Here, we re-establish the validity and linkage of 13C/12C isotopic ratio to human emissions of CO2 from the burning of fossil fuels.
Fluvial (River) Discharge of CO2
The release of CO2 locked up in older sediments largely is incorporated in the CO2 and isotopic carbon balances of millennia ago and only changed in the past when the natural sources or sinks changed. These releases are not a new source of CO2 in the atmosphere, as these releases have been occurring for many millions of years and are as old as the water, land and plants are on this planet. The same kind of more or less continuous natural emissions can be seen in volcanic emissions or natural coal seam fires which have gone on for millennia.
The authors made a mistake by attributing all CO2 river discharge to the human influence, by conflating the total discharge/year with the net increase of CO2, caused by fossil emissions. The real attribution may be from some 50% increase of CO2 pressure in the atmosphere (pCO2), leading to a 50% increase of dissolved CO2 by river waters and 50% extra CO2 released again in the atmosphere. In other words, release of increasing CO2 was directly offset by the increased absorption by the same waterways, so there was no net increase in atmospheric CO2.
A second important finding in the report is that there is likely an underreporting in carbon budgets of removal of atmospheric CO2 by ecosystems. The importance of this fact was emphasized by the authors who stated, “This budget adjustment suggests that the decadal-aged biosphere is storing more anthropogenic carbon than previously suggested….” The primary author stated, “we do know plants and trees must be taking up more carbon from the atmosphere today to account for this unrecognized release of old carbon.”
Increased Erosion Leading to Increasing CO2 Fluvial Release
The authors surmise that increasing erosion (perturbation) is leading to more CO2 supply because of climate change. “Anthropogenic climate change may increase CO2 supply to rivers as soils warm and/or get wetter and microbial respiration increases.” The authors provided no evidence to support this claim and admit that “Whether or not anthropogenic perturbation has increased the leak of old carbon to the atmosphere through rivers that we observe here remains a notable knowledge gap.” In other words, they have nothing to support the claim of increasing erosion due to climate change.
According to Professor Dean, “Our findings show some of this old carbon, as well as ancient carbon from rocks, is leaking sideways into rivers and making its way back to the atmosphere. We don’t yet know how humans are affecting this flow of ancient carbon…” He continues, “we do know plants and trees must be taking up more carbon from the atmosphere today to account for this unrecognized release of old carbon.”
In order for river-sourced CO2 to have significantly influenced atmospheric CO2 concentration, an incredibly huge increase in erosion and river flow would be required, beginning slowly in the 1800s, increasing into the 20th century and escalating quickly over the last 70 years. Simply put, the increase in atmospheric CO2 by 150 ppm by increased erosion and river output is not geologically possible in the timeframe of decades or hundreds of years.
Isotopic Evidence Supports Linkage Between Human Emissions and Rising Atmospheric CO2
The international research team studied more than 700 river reaches from 26 different countries across the world. They took detailed radiocarbon measurements of carbon dioxide and methane from the rivers. By comparing the levels of carbon-14 in the river samples with a standard reference for modern atmospheric CO2, the team was able to date the river carbon.
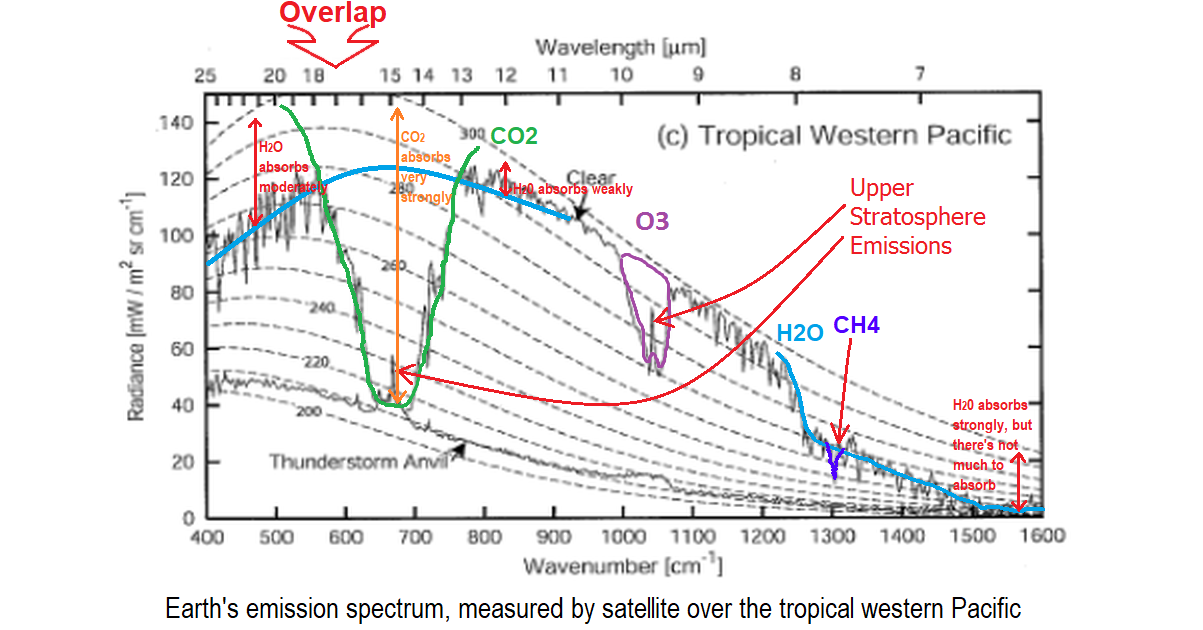
Concerning the main isotopic changes: there is very little change in the 13C/12C ratio (expressed as δ13C) in the past 800,000 years as seen in ice cores at -6.4 +/- 0.4‰ δ13C, up to about 1850. After 1850 there is an enormous drop in δ13C, down to below -8‰. Recently confirmed by a similar drop of δ13C in the ocean surface layer as measured in coralline sponges over the past 600 years.
Compared to the human introduction of nowadays 10 PgC/year of 14C-free CO2 in the atmosphere, the paper’s alleged extra release from the increase of 50% extra 14C-free CO2 from rivers, indirectly caused by our use of fossil fuels, gets around 0.6 PgC/year or about 6% of the direct human contribution of 14C-free CO2 to the atmosphere. One may see the extra CO2 release of rivers as indirectly caused by humans, thus for the 14C decrease (expressed as Δ14C), that acts as a fortifying factor or positive feedback for our fossil fuel emissions.
No figures were given for δ13C of the rivers CO2 involved. As most of the dissolved old CO2 is from carbonate rocks, that gives near zero ‰ δ13C in river water and about -6.5‰ δ13C when released in the atmosphere, which is slight negative feedback, compared to human emissions. We recommend a more detailed investigation.
Because the observed drop of δ13C in the atmosphere is only 1/3 of what can be expected if all human CO2 remained in the atmosphere, the new finding only confirms a small increase in replacing of fossil fuel CO2 in the atmosphere by CO2 from other reservoirs, mainly the oceans and vegetation.
Summary
That river-sourced CO2 from ancient sediments has been overlooked by carbon models used by the IPCC and government sources is an important scientific issue that should be investigated further. However, both the carbon isotope data and the geologic record strongly support that human emissions of CO2 are the primary source of the approximately 50% increase in atmospheric CO2 since the beginning of the Industrial Revolution.
Ferdinand Engelbeen
David Burton
Renee Hannon
Ganapathy Shanmugam
Gregory Wrightstone
Authors of the CO2 Coalition investigation of the carbon cycle:
Human Contribution to Atmospheric CO2
https://co2coalition.org/wp-content/uploads/2024/12/Human-Contribution-to-Atmospheric-CO2-digital-compressed.pdf
Ferdinand Engelbeen
David Burton
Renee Hannon
Discover more from Watts Up With That?
Subscribe to get the latest posts sent to your email.
P.S. – Note that isotopic analysis gives us clues about some aspects of the carbon cycle, but it is not how we know that human emissions are the cause of the ongoing (beneficial!) increase in atmospheric CO2. Simple “mass balance” arithmetic proves it:
tl;dr:
Mankind is adding CO2 to the atmosphere.
Nature (the net sum of all natural “carbon fluxes,” positive & negative) is removing CO2 from the atmosphere.
Mankind is currently adding CO2 faster than Nature is removing it, so the amount of CO2 in the air is increasing.
tl;dr + numbers:
Mankind is currently adding CO2 faster than Nature is removing it, so the amount of CO2 in the air increasing. Measurements show that it is increasing by about 2.5 ±0.1 ppmv/year. (1 ppmv CO2 = 7.8024 Gt CO2 = 2.12940 PgC.)
Mankind is adding 4.7 ± 0.5 ppmv/year of fossil CO2 to the atmosphere, plus 0.5 ±0.3 ppmv/year CO2 from “land use changes” (clearing forests and draining swamps). That increases the amount of CO2 in the air by 4.4 to 6.0 ppmv/year. (The fossil CO2 figures are calculated from economic data: the amount of coal, oil & natural gas produced and burned.)
The difference between those two numbers is the rate at which nature is removing CO2 from the atmosphere: (5.2 ±0.8 ppmv/year) – (2.5 ±0.1 ppmv/year) = 2.7±0.9 ppmv/year.
The higher atmospheric CO2 levels go, the faster natural “carbon sinks” remove it from the atmosphere. That is a powerful “negative feedback,” which helps to stabilize the Earth’s climate.
The two most important of those sinks are marine uptake and terrestrial “greening” / soils. They both accelerate approximately linearly as the CO2 level rises.
W/r/t absorption of CO2 by water, that linearity is probably obvious: the more CO2 molecules there are in the air, the more frequent are their collisions with liquid water. (It’s more complicated than that, because of chemical and biological processes, but it’s nevertheless roughly linear.)
Terrestrial biosphere uptake is less obviously linear, but it we know from agronomists’ studies that “CO2 fertilization” enhances C3 plant growth nearly linearly to above 1000 ppmv, and the plants that sequester most carbon (trees, sphagnum moss) are C3 plants.
So it shouldn’t surprise you to learn that the net rate of natural CO2 removals from the atmosphere is an approximately linear function of the CO2 level in the atmosphere. In fact, the rate of natural CO2 removal from the atmosphere accelerates by about 1 ppmv/year for every 50 ppmv rise in the atmospheric CO2 level (about 1/50 = 2%). That means the effective atmospheric lifetime (“adjustment time”) of CO2 added to the atmosphere is about 50 years.
(Aside: the IPCC’s Second Assessment Report acknowledged that fact, in a roundabout way; it reported that, “Within 30 years about 40-60% of the CO2 currently released to the atmosphere is removed.” [SAR WGI TS B.1 p.15] That implies a half-life of 23 to 41 years, which implies an adjustment time (effective atmospheric lifetime) of halflife/ln(2) = 33 to 59 years. That means the rate of annual natural CO2 removals accelerates by 1/59 to 1/33 of the increase in CO2 level, which is 1.7% to 3.0% per year.)
That means the atmospheric CO2 level cannot rise indefinitely unless the emission rate does, too. The level is currently rising by about 2.5 ppmv/year. So if anthropogenic emissions were to continue at the current rate for the long term, the atmospheric CO2 level would plateau at just 2.5 × 50 = about 125 ppmv above the current level.
That’s a mere 37% of a doubling. For comparison, the Earth has already seen 60% of a doubling since the “preindustrial” 1700s, with only benign effects, so there’s no reason to suppose that another 37% would be harmful.
BTW, you can cite the CO2 Coalition investigation of the carbon cycle like this:
Engelbeen F, Hannon R, Burton D (2024). The Human Contribution to Atmospheric Carbon Dioxide. CO2 Coalition. https://doi.org/10.31219/osf.io/het6n
“That is a powerful “negative feedback,” which helps to stabilize the Earth’s climate.” since CO2 has nothing to do with the earths climate thats just nonsense on stilts ..
1. It is well established that CO2 has a warming effect. It is modest and benign, but it isn’t zero:
https://sealevel.info/learnmore.html?0=physics
2. Climate is more than just temperature. A high CO2 climate is significantly different (better!) for the creatures which live in it (including us).
https://sealevel.info/learnmore.html?0=benefits#benefits
“It is well established that CO2 has a ransferredwarming effect. It ansferedis modest and benign, but it isn’t zero”
The issue isn’t temperature. The issue is heat. Higher temperatures mean more heat transferred per unit time. Planck called it compensation. Reflected heat from CO2 only replaces heat that has already been lost. The current reflected heat gets lost by new “rays” – compensation. Temperature is not a direct metric for heat. The integral of the temperature profile over time is a better indicator. Enthalpy is even better! But climate science refuses to start using Enthalpy.
Reid Bryson used to say that CO2 had the same effect on atmospheric temperature as spitting into the wind – also not a completely negative effect!
The change in solar energy over a solar cycle is only some 1 W/m2 change. Despite that small change, it has a measurable effect on several climate related items.
The current CO2 level is good for already 2 W/m2 extra input…
Not sure if I can call that negligible…
Dave, I agree with Tim on this point:
It is about energy content, not temperature. The specific heat of the atmosphere changes with humidity,
Note that when the IPCC types are calculating the “energy in the system” them happily talk about the energy content of the oceans using sporadic water temperature + salinity measurements, projecting over huge areas, and calculate the heat content. Fine – it is legitimate if not very accurate.
But when it comes to the atmosphere, specific heat goes out the window and it is only the temperature that is considered. When they come to a “total energy content” it is by adding two things with a different number of dimensions which is not legitimate.
The positive (uncertain) temperature change in the ocean only has to be tiny in order to compensate for any imaginable drop it the atmosphere’s temperature. I see a perfect set up for a scam, like this:
You ask your accountant how much money your company made last year. If he is good, he will reply, “How much do you want it to make?”
“It is well established that CO2 has a warming effect. It is modest and benign, but it isn’t zero…”
The static radiative effect may indeed not be zero, but the influence of incremental CO2 on the sensible heat gain or loss result cannot be reliably distinguished from zero by any means we have available to us. This is because the dynamic operation of the atmosphere as the compressible working fluid of its own circulation completely obscures and overwhelms the very minor “effect.” The modelers know this. Please take the time to absorb the implications of energy conversion, as it is fundamental to understanding the general circulation.
https://youtu.be/hDurP-4gVrY
Dave B
This aligns well with Willem Nel’s PhD thesis showing that it is just about impossible for humans to get the atmospheric CO2 concentration above ~525 ppm. The limit is framed by the availability of fuels, accessing those fuels, the behaviour of the oceans and the uptake by all photosynthetic organisms.
Given the non-linear temperature response to an increase in concentration, it is unlikely GHG’s can raise the global temp more than 1/2 to 1 degree. It could even be undetectable.
It raises the question as to how the temperature 8000 years ago was 3 degrees higher than now when CO2 was lower. It seems we have yet to identify the main causes of global temperature variation. It just might be that glowing nuclear furnace in the sky…
Thank you for that information, Crispin in Val Quentin, it is interesting. I found Willem Nel’s ResearchGate page here:
https://www.researchgate.net/profile/Willem-Nel/research
Several of his papers appear to be related to this topic, but I haven’t found his PhD dissertation. Do you have a link?
Here’s another paper (by different authors) on the same topic:
Wang, J., et al. (2016). The implications of fossil fuel supply constraints on climate change projections: A supply-side analysis. Futures, 86, 58–72. https://doi.org/10.1016/j.futures.2016.04.007
“Nature (the net sum of all natural “carbon fluxes,” positive & negative) is removing CO2 from the atmosphere.” an assertion without evidence …
Just the law of conservation of mass, which is not an assertion without evidence. We are putting CO2 into the air about twice as fast as it accumulates. So where is it going?
From a science point that is just a correlation even your mates at skeptical science can at least get that.
https://skepticalscience.com/co2-emissions-correlation-with-co2-concentration.htm
They were then relying on an isotope argument which was the problem that was discussed several posts ago.
We get your not a scientist but correlation does not equal causation.
If you want a counter argument it could equally be industrialization and land clearing is destroying natural carbon sinks. The rate of industrialization matches that of burning fossil fuels so now a scientist needs to do there work and prove the link. If the isotope argument falls it’s back to the drawing board.
From my perspective FF burning and industrialization are not going to stop so we are going to have to deal with the cards we are dealt and we are looking at CO2 levels north of 500 ppm.
Nothing to do with correlation, just using a simple housekeeping budget:
If humans add about twice the amount of CO2 as is measured as increase in the atmosphere, one doesn’t need statistics or correlations to know that fossil emissions are the cause of the increase… No matter if some natural CO2 flux doubled of halved over time.
Except for a few borderline El Niño events, fossil emissions were larger than the increase in the atmosphere. Thus in near all years since 1958, nature was a net sink for CO2, even with the Covid drop of 2020…
That is a model.
What model? There are two rather accurately known parts in it: human emissions, calculated from fossil fuel sales (taxes!) and the very accurately measured increase in the atmosphere.
The only “model” used is a first grade subtraction of these two from each other. That gives the calculated sink rate.
About the accuracy of the temperature measurements, that is a different question, but not so relevant here. The main relevance is that human emissions of fossil fuel CO2 is larger than the increase in the atmosphere…
In a controlled experiment, one can define the independent and dependent variables. Therefore, there can be no unknowns. The calculation is therefore straight forward. In the real world, one is not only dealing with errors in measurement, but there are multiple variables and potentially unknown unknowns. What makes it a model is the (unstated) assumptions about the relative importance of the various variables and the assumption that all the variables and feed-backs are accounted for and/or are so trivial as to be smaller than the precision of all the measurements. That gives the impression that the mass-balance calculations prove what you assume they are proving.
Clyde, in this case, the errors in the two variables (emissions and increase in the atmosphere) are much smaller than the increasing difference between the two variables.
The difference between these two known variables includes all unknown other variables and their variability…
The problem is, you are dealing with the net annual difference between all the sources and all the sinks. You have little ability to determine whether a net increase in CO2 is the result of a decline in natural sink capacity, an increase in natural sources, or some combination of both because there is no way to distinguish the individual sources and sinks.
Those studying the Carbon Cycle have made a good-faith attempt to estimate the magnitude of the reservoirs and the annual average flux rates, but they are hindered by the nature of the fundamental problem of being uncertain about the origin of the CO2. They are examples of circular reasoning. [As I’m sure that you are well aware, I’m familiar with the argument about carbon-isotope ratios; I have pointed out that it is actually a weak argument because it doesn’t thoroughly take into account isotopic fractionation during all the various chemical reactions (buffering), Polar-waters absorption, and phase changes like out-gassing.)
Those doing the modeling seem to have decided a priori that the system was coincidentally in equilibrium (despite Ice House Climates not being the norm) just before the Industrial Revolution, instead of transitioning to a different equilibrium after the end of the last major Pleistocene glaciation. This is important because one would naively expect that like so many other things, the vastness of the oceans would be more important than the small flux rates assigned to them. There has been no rigorous marine sampling program to confirm the assumptions about oceanic fluxes.
For that matter, most of the assumptions about global CO2 fluxes have been demonstrated to be wrong by empirical measurements from OCO-2. The argument about the correlation between the essentially constant anthro’ emissions and the annual rise in atmospheric CO2 is not compelling for me. The 5th in a series of 5 submissions was declined here at WUWT; in it I attempted to make that clearer.
The anomalous El Nino years demonstrate that the system has the capacity to emit considerably more CO2 during the seasonal ramp-up phase, and to subsequently sequester most of it. That is, the demonstrated flexibility of the system calls into question the claim that it is the inability of sinks to keep up with anthro’ emissions that is responsible for annual increases. It looks to me more like a lagging response to a warming world on track to establish a new equilibrium. Remember, the Carbon Cycle basically cannot distinguish between the sources of carbon. Therefore, an absence of anthro’ CO2 should only result in about a 4% decline in annual increases.
Clyde, that criticism is awfully vague. Let’s try to make it concrete, shall we?
The way to handle uncertainty is to quantify it, and propagate it in the calculations. When adding, subtracting or comparing imprecise figures, the uncertainties must be added as well (unless they’re known to be independent, in which case you may be justified in adding them in quadrature).
I think you’re saying that you doubt I did that correctly, or I got some of the numbers quite badly wrong, when I wrote the following:
(I’ve also mentioned that 1 ppmv CO2 = 7.8024 Gt CO2 = 2.1294 PgC.)
The proof that nature is removing CO2 from the atmosphere, rather than adding it, and thus cannot be responsible for the ongoing increase, is the fact that the rate of anthropogenic emissions (5.2 ±0.8 ppmv/year) is greater than the rate of atmospheric CO2 increase (2.5 ±0.1 ppmv/year).
If that proof is incorrect, then at least one of those figures must be wrong.
So, will you please be specific? What, exactly, do you dispute or doubt?
What I’m suggesting is that you have focused on a spurious correlation that only amounts to about 4% of the annual CO2 flux. I would be more inclined to accept your calculations if you used a finer temporal resolution, at least seasonally for a given hemisphere.
During the Northern Hemisphere Winter seasonal ramp-up phase, as commonly monitored at MLO, there is CO2 being contributed from trees by respiration in the Tropics, as evidenced by NASA animations showing diurnal flickering. There is also year-round CO2 respiration from tree roots, particularly boreal trees, where they convert stored sugars into energy to keep the trees alive in the Winter. There is also some leakage of CO2 from the Southern Hemisphere from diffusion into the Northern Hemisphere as a result of the Summer draw-down
The seasonal variations as shown in graphs showing the range by latitude from the South Pole to the North Pole demonstrate that CO2 concentration is controlled by biogenic sources. Bacteria and fungi operate year round, as does respiration from photosynthetic organisms. It is probably even stronger during the Summer, unless it is restricted by lack of nutrients. Clearly, photosynthesis of marine and terrestrial organisms overpowers the background of all sources locally in the summertime.
I accept the annual rate of increase of CO2, at least for MLO. I also accept the fossil fuel emissions rate, which I presume to be better than the land use changes. Calcining of limestone for cement is probably somewhere in between the two for accuracy. However, it should be noted that the seasonal CO2 variation with latitude and season, is compelling evidence for the natural emissions being biogenic.
What I think that you are missing is that the summertime draw-down (sinks) takes from all the sources in proportion to their abundance (partial pressure) in the atmospheric reservoir. Anthro’ sources are only about 4% of the total flux, assuming that the Carbon Cycle estimates are correct. Yet, you are assigning all the increase to something that only amounts to a single-digit fraction of the total involved in the Carbon Cycle fluxes, and is relatively constant, while ignoring the evidence for warmth driving the biogenic production of CO2.
See Figure 2, here: https://wattsupwiththat.com/2022/03/22/anthropogenic-co2-and-the-expected-results-from-eliminating-it/
And, the El Nino curve in Figure 3, and the annual variations in annual increases, particularly the 1998 increase of 3.6 PPMv in Figure 4 here:
https://wattsupwiththat.com/2021/06/11/contribution-of-anthropogenic-co2-emissions-to-changes-in-atmospheric-concentrations/
What would happen to your argument if you were to treat, say, just the respiration from tree roots in exactly the same way as you are treating anthropogenic emissions?
Clyde wrote, “You have focused on a spurious correlation that only amounts to about 4% of the annual CO2 flux… Anthro’ sources are only about 4% of the total flux”
It’s not a spurious correlation, it is just accounting. When mankind adds CO2 to the air it increases the amount of CO2 in the air by exactly the amount that mankind adds.
What you call “annual CO2 flux” or “total flux” is the summation of the absolute values of many individual processes, some which add CO2 to the air, and others which remove it. That sum is irrelevant. What matters is the net sum of those processes.
That net sum of all natural CO2 fluxes is what we’re calling “nature,” in this context. It is negative, meaning that nature removes CO2 from the atmosphere each year, but that net sum is considerably smaller in magnitude than anthropogenic CO2 emissions.
Clyde wrote, “I would be more inclined to accept your calculations if you used a finer temporal resolution, at least seasonally for a given hemisphere.”
That’s the wrong approach. We’re interested in long-term changes in the total amount of CO2 in the atmosphere, not local seasonal fluctuations. Local seasonal fluctuations are “noise” for our purposes.
The ongoing annual increase in the amount of CO2 in the atmosphere is not contributed to by CO2 from rotting leaves and grass which grew within the last year or two.
The way to eliminate noise is to average over longer periods, not shorter. For example, over the last four years (2020 to 2024) the CO2 level rose at an average rate of (424.61-414.21) / 4 = +2.60 ppmv/year.
Clyde wrote, “you are… ignoring the evidence for warmth driving the biogenic production of CO2.”
In the first place, the data show that the net sum of all natural sinks and sources (including biogenic production of CO2) is negative, not positive. So biogenic production of CO2 is more than offset by natural CO2 sinks.
In the second place, biogenic CO2 comes from plants, which have harvested that carbon from CO2 in the atmosphere, mostly quite recently. Removing CO2 from the air and then releasing it back into the air does not increase the amount of CO2 in the air. Only if biomass (sequestered carbon) were decreasing would those processes contribute to rising atmospheric CO2 levels. That would happen in a “browning” world, but our world is greening, not browning.
https://www.youtube.com/watch?v=zOwHT8yS1XI
In the third place, we can can eliminate warming-driven processes as significant contributors to rising CO2 levels because we know that prior to the Industrial Revolution temperature changes comparable to or larger than the recent warming trend resulted in only very slow changes in the atmospheric CO2 level.
We know from ice cores that over relatively recent climate cycles (IACP 🡕 RWP 🡖 DACP 🡕 MWP 🡖 LIA) CO2 levels in the atmosphere changed at an average rate of only about 0.02 ppmv/year, and over glaciation cycles it was no more rapid than that. That’s two full orders of magnitude slower than the current, ongoing rise in the amount of CO2 in the atmosphere.
Clyde wrote, “What would happen to your argument if you were to treat, say, just the respiration from tree roots in exactly the same way as you are treating anthropogenic emissions?”
We can’t, because we don’t have that data. Also, whatever CO2 tree roots release is made from carbon taken from the atmosphere, mostly fairly recently.
In contrast, we know how much CO2 humans are producing (an average of 5.2 ±0.8 ppmv/year), and it is mostly one-way releases, that is, not balanced by recent uptake from the atmosphere.
The sinks are a model as per the statement the emissions may be just showing you how much the sinks have dropped off. So yes the emissions may be adding to the problem but that doesn’t mean they are the root cause of the problem. Scientifically you have a hypothesis.
As I said it doesn’t really matter CO2 levels don’t look like they are going down anytime soon so there will be plenty of time for it all to play out.
Leon wrote, “the emissions may be just showing you how much the sinks have dropped off.”
No, most of the emissions (the “fossil” part) are determined from economic data (the amount of coal, oil & natural gas produced and burned), and chemistry.
E.g., every molecule of methane burned produces exactly one molecule of CO2. So if you know how much natural gas is burned then you know exactly how much CO2 it produced.
Leon wrote, “…the problem…”
What “problem?” CO2 is not a problem! This is not a problem:
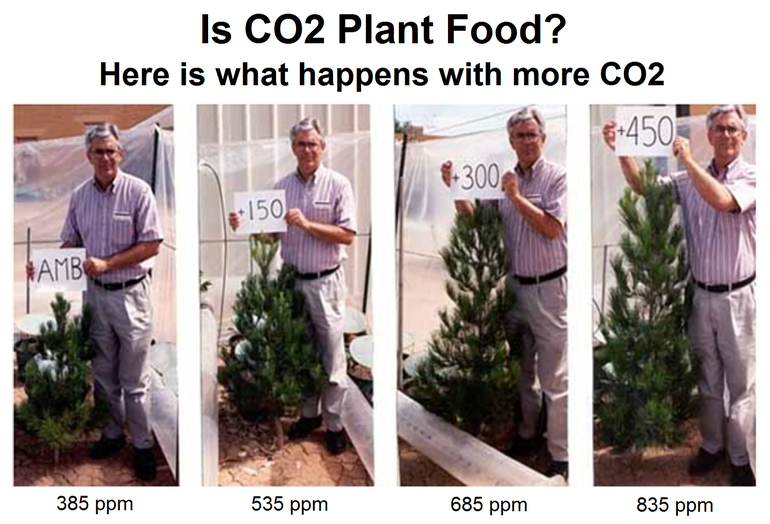
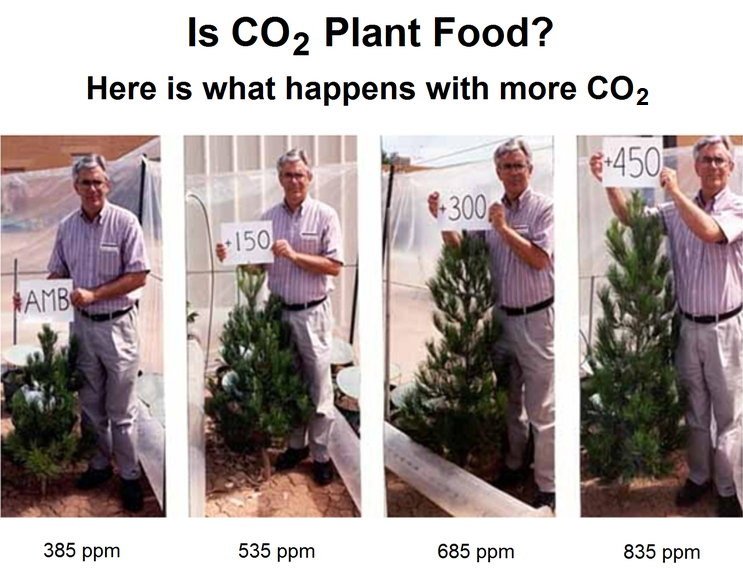
http://co2science.org/data/plant_growth/plantgrowth.php
This is not a problem, either (NASA video):
https://www.nasa.gov/centers-and-facilities/goddard/carbon-dioxide-fertilization-greening-earth-study-finds/
https://www.youtube.com/watch?v=zOwHT8yS1XI
This is not a problem, either:
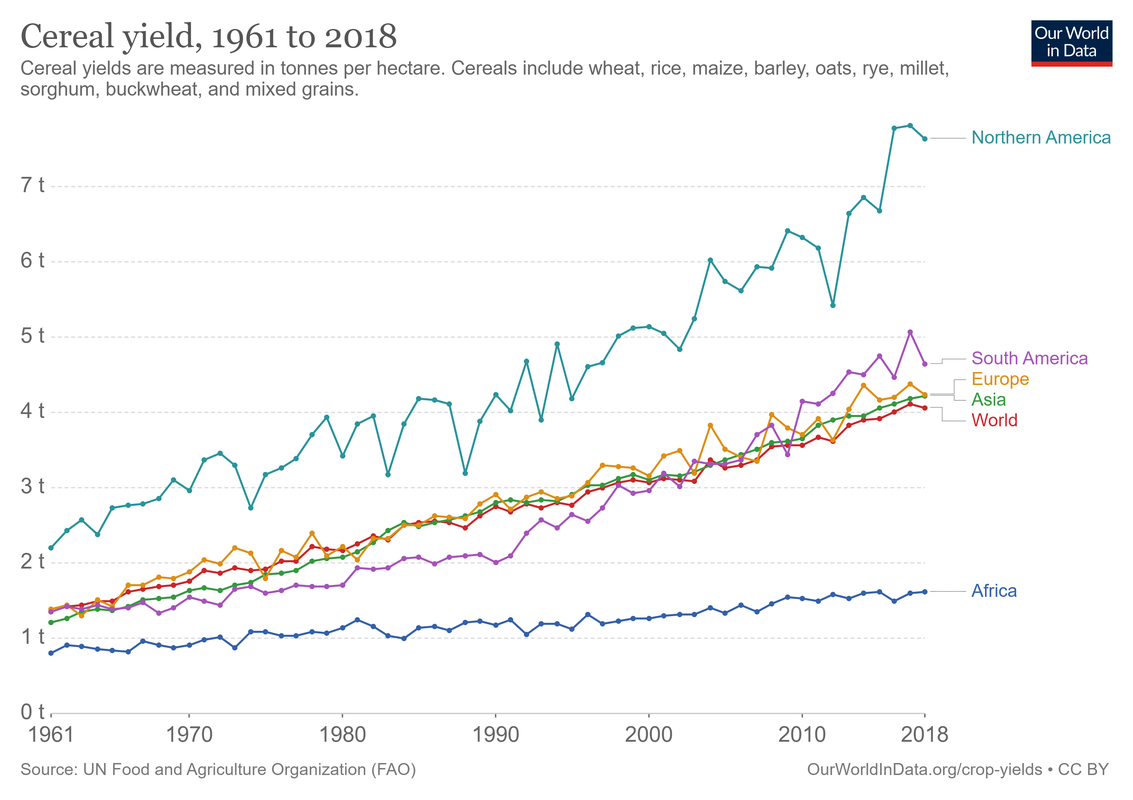
https://ourworldindata.org/crop-yields
This is not a problem, either:
https://sealevel.info/learnmore.html?0=benefits
This is not a problem, either:
https://x.com/ncdave4life/status/1871630376764166615
In whatever world you inhabit, there are no plants and no weathering of rocks? Let me guess, your planet doesn’t have an atmosphere?
Plants breathe in CO2, with water create sugar, and exhale O2.
That is proven with evidence.
Hi Dave
The problem with your argument is that this isn’t a mass balance problem.
It’s an equilibration problem.
The amount of CO2 in the atmosphere is primarily controlled by the equilibrium relationship between the partial pressure of CO2 in the atmosphere and the solubility of CO2 in the ocean.
As the world has warmed since the end of the Little Ice Age, the proportion of available CO2 in the atmosphere has had to increase to counterbalance the effect of the reduced solubility of CO2 in the ocean, caused by the warming oceans.
If humans were not putting any CO2 into the atmosphere, the atmospheric CO2 would still have risen, although not by quite as much.
You are seeing this as “Mankind is currently adding CO2 faster than Nature is removing it, so the amount of CO2 in the air is increasing.”
The alternative, which I think is a better explanation, is that humans are putting more CO2 into the atmosphere than is needed for the equilibration process, the balance of which is taken up by the oceans and terrestrial biosphere.
We can that see this is what is happening by looking at the change in sea surface temperatures (SST) and the change in atmospheric CO2 over time.
Changes in sea surface temperatures happen a few months before changes in atmospheric CO2.
The attached graph is using monthly sea surface globe data from https://www.metoffice.gov.uk/hadobs/hadsst4/data/download.html and monthly CO2 data from https://gml.noaa.gov/ccgg/trends/data.html I think I used the Mauna Loa data for this graph, rather than the globe data, but both show the effect.
The change is the annual change in monthly values for both SST and CO2. I have also calculated the 5 month running mean for both to smooth out the graph.
The important thing to note is that changes in SST can be used to predict changes in atmospheric CO2. In July last year, SST started to fall, and when it continued for a few months, it was reasonable to predict CO2 growth would start to reduce as well.
It is not possible to use changes in anthropogenic emissions to predict changes in atmospheric CO2.
No, John, atmospheric CO2 is very, very far from equilibrium. Equilibrium would be less than 300 ppmv.
That’s why “nature” (the net sum of all natural fluxes, both positive and negative) is removing CO2 so rapidly (2.7±0.9 ppmv/year).
The effective half life of CO2 added to the atmosphere is about 35 years (which means the “adjustment time” is about fifty years). So if anthropogenic CO2 emissions were to suddenly cease, perhaps due to an energy breakthrough, then the atmospheric CO2 level would decrease toward equilibrium, initially at a rate of 2.7±0.9 ppmv/year. It would take about 35 years to drop halfway to equilibrium (i.e., to about 360 ppmv).
But the rate of decrease would gradually decelerate, tapering off to a “long tail” decay curve, as “greening” would turn into “browning,” and the biosphere would become a source rather than a sink. (That hypothetical “long tail” is the basis for climate activists’ claims that CO2’s lifetime in the atmosphere is very long.)
On page 8 of the first IPCC assessment report it say the turnover time for CO2 is about 4 years.
I never said it was in equilibrium. I said it is an equilibration problem.
The rate at which it equilibrates is temperature dependant. I am writing this on me phone so I’m not able to give you a detailed response. The atmospheric consentration is below the amount at which the system would be in equilibrium. When there is a large or prolonged increase in temp, there is an increase in CO2growth. A decrease results in a decrease in growth.
Yes, but the “turnover time” is not the effective lifetime for human CO2 emissions. The effective lifetime is called “adjustment time” in the IPCC assessment reports. It’s the duration of the effect from adding CO2 to the atmosphere, and it is about 10× to 15× longer than the turnover time; i.e., about 50 years, instead of 3-5 years. (That fact was mentioned in the Second Assessment Report, but not in later Assessment Reports.)
When a CO2 molecule is absorbed by a puddle or raindrop, That’s the end of its “turnover time.” When that puddle or raindrop evaporates, releasing the dissolved CO2 molecule back into the air, that’s the start of a new “turnover time.”
Similarly, if a carbon atom is exchanged between the air and the terrestrial biosphere or ocean, either immediately or perhaps after a growing season, that exchange “resets the timer” if you’re counting “turnover times” of carbon atoms, but it does so without affecting the amount of CO2 in the air.
The “turnover time” and “adjustment time” are two of the four (4) different “lifetimes” of atmospheric CO2. All four are described here:
Burton, D. A. (2024). “Comment on Stallinga, P. (2023), Residence Time vs. Adjustment Time of Carbon Dioxide in the Atmosphere.” OSF Preprints. https://doi.org/10.31219/osf.io/brdq9
Hi Dave.
You are still seeing this as a mass balance problem. your reference Burton, D. A. et al.(2024) also treats this as being about mass balance.
It is a very understandable and widely held misunderstanding, but it is not what is really happening.
When the temperature of the oceans increases, the solubility of CO2 decreases and atmospheric CO2 has to rise.
Have a look at this graph. It shows change in atmospheric temperature (lower troposphere)and change in CO2 growth.
I made it a 3 year running mean to smooth out the short term variations.
You might think that the CO2 is driving the temperature change but look more closely. The change in temperature is matching the change in CO2 growth.
The change in the growth is a change in the rate of change. It is a second order derivative.
The important thing to note is that a decrease in temperature is correlated with a decrease in growth, that is a decrease in the rate of increase. The rate of increase, however, does not fall below zero. This means that we have a correlation between an increase in CO2 (at a lower rate) and a fall in temperature. That is supposed to happen under the “greenhouse gasses are causing the warming” paradigm.
There is a very good relationship between temperature and growth. There is no relationship between emissions and growth.
The temperature data gor the graph is from https://www.nsstc.uah.edu/data/msu/v6.1/tlt/uahncdc_lt_6.1.txt
CO2 growth data from https://gml.noaa.gov/ccgg/trends/gr.html
John, You are looking at second derivative comparisons
Yes I am. Andhere is a reason why.
If a change in emissions is the cause of growth, then a change in emissions should cause a change in growth. Which is a second derivative.
Similarly, when a change in temperature is related to a change in growth, it is reasonable to conclude that the temperature is driving change in growth.
Again, Oops. That should have been “If emissions is the cause of growth, then a change in emissions should cause a change in growth.”
OOps. I said “. That is supposed to happen under the “greenhouse gasses are causing the warming” paradigm.”
That should have been “not supposed to happen”.
The warming-oceans-caused-recent-CO2-rise hypothesis is disproven by several lines of evidence:
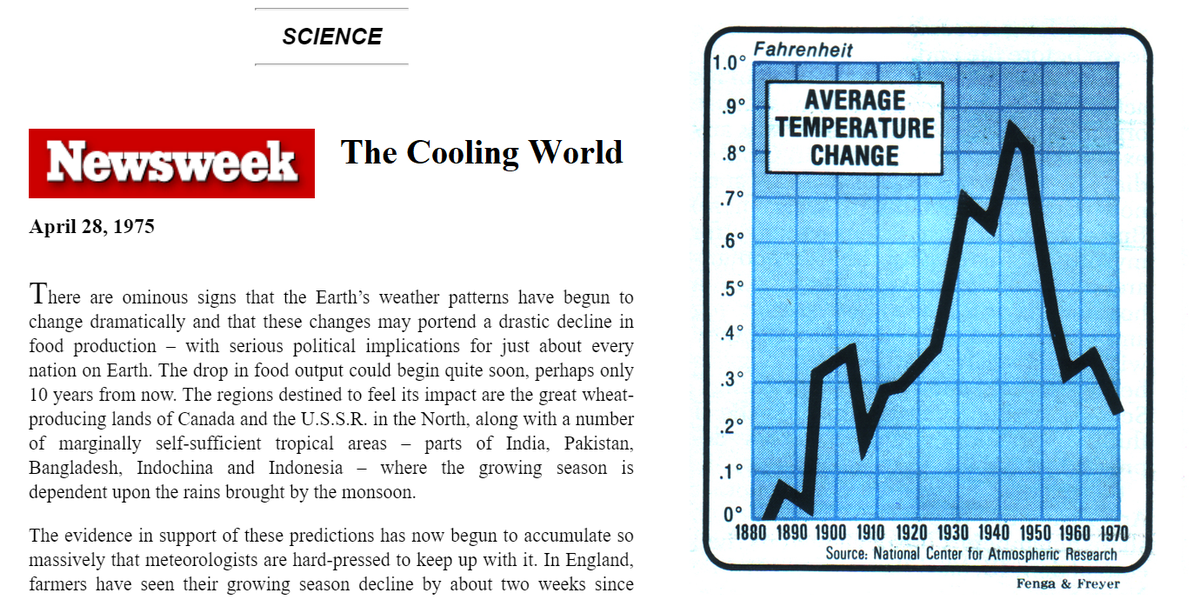
1️⃣ First, and perhaps most obviously, global temperatures and sea surface temperatures (SSTs) declined in the 1950s, 1960s, and early 1970s, yet CO2 levels nevertheless kept on rising. Obviously rising water temperatures didn’t cause rising CO2 levels when water temperatures were falling.
https://sealevel.info/newsweek_old.htm
2️⃣ Next, consider that SSTs are believed to have risen only about 0.5 °C over the 2/3 century since 1958 (when precise CO2 measurements began). Yet over that same 2/3 century period atmospheric CO2 levels rose by 110 ppmv.
Compare that to glaciation cycles, over which (we know from ice cores) that CO2 levels varied by only about 90 ppmv, despite SST temperature variations that were certainly at least 3°C.
3️⃣ Next, consider the relative effect of a 0.5 °C SST increase (since 1958) and a 35% atmospheric CO2 level increase (since 1958) on the CO2 fluxes between ocean and air. We know from the temperature dependence of Henry’s Law that a 0.5°C water temperature increase will reduce CO2 solubility in water by about 2%. But a 35% increase in CO2’s partial pressure in the atmosphere will increase CO2 dissolution into the ocean by 35%. Since 35% > 2%, we know that the net effect of the two changes (temperature and atmospheric CO2 level) must be an acceleration in ocean uptake of CO2.
4️⃣ Next, consider the “mass balance” arithmetic. We’ve actually added enough CO2 to roughly double the atmospheric CO2 concentration (+85% just from fossil fuels). We’ve produced about 505 PgC from fossil fuels (perhaps ±10%), plus an estimated 100-300 PgC from land use changes. 1 ppmv of CO2 = 2.1294 PgC, so 600 PgC = 282 ppmv = a +100% addition compared to the preindustrial level of about 280 ppmv.
Ref: https://globalcarbonbudgetdata.org/
But nature is simultaneously removing CO2 from the air, so the net increase is only about +52% (280 ppmv → 425 ppmv). Nature removed the rest: mostly by dissolving it into the oceans, and uptake by the terrestrial biosphere (“greening”) & soil.
Since 1958 we have excellent measurements of atmospheric CO2 level, so we can see how much it changes from year to year. We also have pretty good data for emissions, calculated from the consumption of fossil fuels. By comparing the two, we can calculate the rate at which nature is removing CO2 from the atmosphere. It is instructive to plot that removal rate against the atmospheric CO2 level. Here’s a graph, which shows how CO2 uptake is increasing as CO2 levels rise:
(That’s Fig. 1 here; here’s the spreadsheet.)
You can see from that graph that the rate of those natural CO2 removals (mostly by the oceans and the terrestrial biosphere) accelerates by almost 1 ppmv/year for every 50 ppmv increase in the atmospheric CO2 concentration (2% of the increase). That makes the “adjustment time” (effective atmospheric lifetime) of emitted CO2 1/0.02 = about fifty years.
You won’t find that in the latest IPCC reports, but it was acknowledged, in passing, in the IPCC’s Second Assessment Report. That report mentioned that “Within 30 years about 40-60% of the CO2 currently released to the atmosphere is removed.”
Ref: https://archive.ipcc.ch/ipccreports/sar/wg_I/ipcc_sar_wg_I_full_report.pdf#page=29
That implies a half-life of 23 to 41 years, which implies an adjustment time (effective atmospheric lifetime) of half-life/ln(2) = 33-59 years. That means that the rate of annual natural CO2 removals accelerates by 1/59 to 1/33 of the increase in CO2 level, which is 1.7% to 3.0% per year.
Roughly the same result has also been reported by many other researchers, including:
Spencer, Roy W. (2023). ENSO Impact on the Declining CO2 Sink Rate. J Mari Scie Res Ocean, 6(4), 163-170. https://doi.org/10.33140/jmsro.06.04.03
Dr. Peter Dietze: http://www.john-daly.com/carbon.htm
Engelbeen, Ferdinand (2022). The origin of the increase of CO2 in the atmosphere, http://www.ferdinand-engelbeen.be/klimaat/co2_origin.html (section 3)
Berrien Moore III and B. H. Braswell (1994). The lifetime of excess atmospheric carbon dioxide. Global Biogeochem. Cycles, 8(1), 23–38. https://doi.org/10.1029/93GB03392
Excerpt: “The single half-life concept focuses upon the early decline of CO2 under a cutoff/decay scenario. If one assumes a terrestrial biosphere with a fertilization flux, then our best estimate is that the single half-life for excess CO2 lies within the range of 19 to 49 years, with a reasonable average being 31 years.”
Correcting a botched link…
3️⃣ Next, consider the relative effect of a 0.5 °C SST increase (since 1958) and a 35% atmospheric CO2 level increase (since 1958) on the CO2 fluxes between ocean and air. We know from the temperature dependence of Henry’s Law that a 0.5°C water temperature increase will reduce CO2 solubility in water by about 2%. But a 35% increase in CO2’s partial pressure in the atmosphere will increase CO2 dissolution into the ocean by 35%…
1️⃣ First, and perhaps most obviously, global temperatures and sea surface temperatures (SSTs) declined in the 1950s, 1960s, and early 1970s, yet CO2 levels nevertheless kept on rising. Obviously rising water temperatures didn’t cause rising CO2 levels when water temperatures were falling.”
I agree this explanation does not work if CO2 is rising while temperatures were falling. But I already knew that and yet I am still trying to get you to understand something.
We need an explanation for why changes of atmospheric CO2 growth follows changes in sea surface temperatures. A paradigm that can explain this is that the system is not in equilibrium, but it is equilibrating. That is, it is moving towards a state at which it would be in equilibrium.
Unfortunately, I don’t have time to adequately respond to your comments at the moment.
John, looking at the growth rate variability as function of temperature variability doesn’t give you a clue about the cause of the increase in the atmosphere. It only gives you a clue what the cause is of the variability…
If you plot everything as derivatives at the same scale then you have the following picture:
Where the variability of dT/dt causes all variability in the net sink rate, but has no trend, only a small offset from zero, due to the linear increase of T (mainly due to sea surface temperatures).
Human emissions have twice the trend in the derivatives than the increase in the atmosphere. Thus are fully responsible for the trend, even if they have zero correlation with the variability of the CO2 increase…
Ferdinand you didn’t recognize that you made a mistake in your plot.
Your upper aqua line is not the derivative of emissions, it is CO2 emissions other than land-use as of 2020.
This is unacceptable as were the conclusions drawn from it.
Bob, the upper line are human emissions per year. Not exactly the mathematical derivative of the total CO2 increase, but anyway of the same order:
Emission per year compared to CO2 increase per year and temperature change per year…
Bob, we will replace the text for human emissions in the above plot with ΔCO2/year to be clear. Other two lines are real derivatives of T and CO2 in the atmosphere and the net sink rate is a mix of dCO2(atm)/dt and ΔCO2(em)/year or may get expressed as ΔCO2(sink)/year.
Or we can make it all Δ/year. The net effect will remain practically identical…
Has atmospheric CO2 ever been in equilibrium? Can it ever be while there are plants?
You know this 300 ppm equilibrium how?
Not a math calculation.
Not a model.
Global field measurements and perhaps experimentation.
Back calculation for the net sink rate since 1958. Where the net sink rate gets zero, that is the equilibrium level. In the past, the rather stable CO2 levels, with a small change in CO2, following T changes.
Further, once the equilibrium for one temperature is known, the formula of Takahashi can be used to calculate the equilibrium for other sea surface temperatures:
(pCO2)seawater AT Tnew = (pCO2)seawater AT Told x EXP[0.0423 x (Tnew – Told)]
That gives some 13 ppmv since the LIA or less than 10 ppmv since 1850 and if you don’t trust ice core CO2, only a few ppmv extra since 1958 for the equilibrium.
Sparta Nova 4 asked, “You know this 300 ppm equilibrium how?“
What I wrote was that it is “less than 300 ppmv.” It’s the x-intercept, here:
(That’s from this spreadsheet.)
A second line of reasoning yields a similar conclusion:
Note that the oceans contain about fifty times as much CO2 & DIC as there is CO2 in the atmosphere (AR6 estimates 45×), and less than 1/3 of mankind’s CO2 emissions have found their way into the oceans. So we haven’t affected the oceans very much.
AR6 estimates that mankind’s fossil carbon emissions have increased the total amount of carbon in the air + oceans + soil + terrestrial biosphere by just 1.1%. Even if you omit the deep oceans, it’s still only about 10%.
So even with our current relatively warm climate, equilibrium would leave the atmospheric CO2 level only slightly above what it was in preindustrial times and past interglacials, which we know from ice cores was about 250-290 ppmv.
The issue with taking the derivative, made even worse by taking the 2nd, is that the derivative detrends the data. The argument is that the trend is a different process than the variations on the trend and that by detrending you’re removing the anthropogenic contribution. To counter this argument, I’ve shown that temperature and [CO2] are related by a single equation in both integral and differential forms. One equation, one process. Where the derivative amplifies noise, the integral accumulates error.
It turns out this is a good way to detect UHI.
“It turns out this is a good way to detect UHI.”
Nice. Turns out CO2 is a pretty good proxy for SST too.
Turns out UAH is also a pretty good proxy for SST.
Robert, you make the “classic” error of comparing variables of different order.
Not the first to do that: the late Salby, recently Koutsoyiannis and many others did it.
Please compare derivatives with derivatives and variables with variables, not one variable with the integral of the other variable…
The problem is this case, fooling many smart people, is that a more or less sinusoidal function like temperature has near exact the same variability in its variable and direct form, only a shift of -pi/2 for the derivative and in this case, the variable T(anomaly) has a linear trend, where the derivative has only a small offset from zero.
Here plotted for the derivatives of CO2 increase and T and for T(anomaly):
If you plot the human emissions besides them, these are near twice as high in trend for every level…
Take in your calculation that there is a sudden increase of 1°C in temperature. That will lead to an increase of CO2 that never will stop until eternity.
In reality, the temperature induced increase in CO2 pressure (pCO2) of the ocean surface initially will give an increase of CO2 flux into the atmosphere, directly proportional to the pCO2 difference between ocean surface and atmosphere, but the increase of pCO2 in the atmosphere will reduce the pCO2 difference to what it was before the T increase. At that moment, the CO2 increase stops and the new CO2 level is a direct function of T, not of its integral:
The exact increase in pCO2 of the atmosphere for a T increase can be calculated with the formula of Takahashi and gets less than 10 ppmv for the warming seas since 1850…
BTW, what happens with the human emissions with your integrated temperature?
Should reread before publishing…
The sentence:
“has near exact the same variability in its variable and direct form, only a shift of -pi/2 for the derivative”
Must be:
“has near exact the same variability in its derivative and direct form, only a shift of -pi/2 for the derivative”
The mistake is yours. The relationship is integral over the time period of measured data. I first noticed this when I computed the coherent frequency response between temperature and [CO2]. The amplitude response is 1/frequency, and the phase response is -90 degrees except where it exhibits a 6-month delay at the lowest frequencies (and for the seasonal spike in the middle).
The 6-modth delay for long cycles is consistent with longer-cycle solar forcing alternating between hemispheres with the seasons. It masks the 90-degree delay, but the integral response is more observable with southern hemisphere analysis where oceans dominate.
A time-constant modification to the equation might be appropriate for longer time scales, but I’m not worried about integrating to infinity, CO2 concentrations will likely start falling sometime after 2200.
Don’t be an integral denier. It’s just an empirical relationship.
Robert,
The relationship is between T and CO2 or dT/dt and dCO2/dt, not the integral of T with [CO2],
The increase in [CO2] by temperature is exactly known by the formula of Takahashi: less than 10 ppmv since 1850 or some 3 ppmv since 1958.
∂ln pCO2/∂T=0.0423/K
That is all.
The current net CO2 flux is from the atmosphere into the oceans, despite warming oceans, as can be seen in the increase of DIC (inorganic CO2 and derivatives) in the ocean surface:
https://tos.org/oceanography/assets/docs/27-1_bates.pdf
Table 2 and Figure 3.
And from the atmosphere into vegetation:
http://www.bowdoin.edu/~mbattle/papers_posters_and_talks/BenderGBC2005.pdf
The biosphere is expanding…
Thus the “integral of T” is completely dwarfed by the human influence…
What part of empirical don’t you understand?
Mathematically CO2 concentrations have an observed integral relationship to temperature, I don’t say why, but I expect that warming oceans integrate solar activity.
People can argue about sources and sinks all they want, [CO2] doesn’t drive temperature. Temperature drives CO2. Have a good day.
Robert, you are not the first who found that (false) relationship: both human emissions and temperature anomaly have a trend. And temperature has all the variability that can be found back in the rate of change of the CO2 increase.
The slope of human emissions is twice the slope of the change in CO2 in the atmosphere. Thus nature is a net sink for CO2 and, while being the cause of all variability, is is a variability in sink capacity, not in source capacity.
Integrating temperature anomaly gives you a nice fit with the observed increase in the atmosphere, but that does half human emissions plus the zero-slope dT/dt also. That is less empirical and far more derived from physical properties…
CO2 increase/year = emissions * 0.53 + 5*ΔT/year
But CO2 ppm has not varied much for several thousand years, warm or cold climate, except since about 1900, largely due to fossil, and a little due to increased
greening.
Not so wilpost. As recently as the Little Ice Age, temperatures began rising and CO2 followed.
Moberg is a highly respected recontruction of NH temperatures over the last 2000 years. It shows peak warming after 1000, followed by a sharp cooling hitting bottom by 1600. Kouwenberg is a CO2 time series based on plant stomata proxies. For 250 years during the cooling, CO2 was rising, and then later CO2 was declining for 240 years while temperatures were rising.
Looking at more reconstructions, the drop of CO2 after the T drop was more in the order of 50 years, but that is not the most interesting part.
The interesting part of the story is that the drop in CO2 between MWP and LIA was less than 10 ppmv for a drop of 0.9°C. Or about 10 ppmv/°C. That is all.
The current increase is over 100 ppmv/°C, which is simply impossible from warming oceans…
BTW, stomata data are proxies that are calibrated against the gold standard: ice cores CO2. If the average of stomata data differs from the average of ice core CO2 beyond the resolution of the ice cores, then the stomata data need to be recalibrated…
What’s interesting is that for what appears to be a 1000-year (Eddy) temperature cycle, The phase delay is consistent with an integral response: -90 degrees, or a 250 year delay.
Right on, John! The other thing your graph shows is that CO2 spikes after El Nino year peaks in temperature, despite anthro’ emissions being essentially constant. CO2 is much more sensitive to temperature changes than anthro’ emissions, and the seasonal draw-downs remove most of the excess El Nino CO2. That is, the sinks have flexibility in their ability to sequester CO2, but lag behind the biogenic pulses.
Clyde, the sinks are near completely insensitive to human emissions of one year, they are sensitive to the extra pressure of CO2 in the atmosphere above the equilibrium between the sinks and the atmosphere. And especially plants are very sensitive to temperature (and rain pattern) changes, far more than the ocean surface.
The point is that for plants, the influence of temperature (El Niño, Pinatubo) is gone after 2-3 years and that the oceans take over. The latter have a very modest pCO2 change of the sea surface pCO2 in equilibrium with the atmosphere for temperature changes.
For the current about 120 ppmv extra CO2 pressure in the atmosphere above equilibrium, the net absorption in oceans and vegetation is around 2.4 ppmv/year, which results in an effective adjustment time (Tau) of around 50 years,
There is the end of the Little Ice Age, which coincided with the Industrial Revolution. When three things are going on at the same time, what is causing what?
hmmmm…. kinda an example of the “three body problem” in astronomy
well I’m pretty sure that neither increasng CO2 nor the end of the Little Ice Age “caused” The Industrial Revolution … since CO2 has never ended an Ice Age in recorded history then maybe the Industiial Revolution may has caused the CO2 increase … the end of the Litte Ice Age had nothing to do with either other thing …
What I meant was that temperatures were increasing, CO2 levels were increasing, and fossil fuel burn rates were increasing. But what caused the LIA?
The LIA was caused by changes in solar activity. The Jovian plants modulate solar activity on a number of different time scales, the most significant of which is a 938-year cycle. The cycle will peak 2100-2200.
The end of the LIA resulting in the wealth in society increasing as agriculture flourished.
This meant more money for research and investment, some of which resulted in the industrial revolution
The Little Ice Age was from about 1350-1850 (±50 years at each end). The atmospheric CO2 concentration bottomed out around 1615 (at 275.3 ppmv, according to the Law Dome ice core data). By 1900 it had risen by 20 ppmv, to about 295.7 ppmv (again, according to ice core data).
I don’t know to what extent that 20 ppmv rise contributed to ending the LIA, nor how much the CO2 level would have risen just due to rising temperatures, if temperatures had risen without the Industrial Revolution contributing to CO2. However, from the MWP peak (circa 1170) to the LIA’s 1615 low, Law Dome ice core data shows an 8.8 ppmv atmospheric CO2 decrease, so my guess is that absent the Industrial Revolution’s CO2 emissions the end of the LIA would have probably increased atmospheric CO2 level by <10 ppmv.
Since 1900, the atmospheric CO2 concentration has increased by about 130 ppmv. That’s 10 to 20× the increase that we could get just from rising temperatures.
You are right.
Climates, hot or cold, had very little effect on CO2 ppm, as proven by near constant CO2 for thousands of years.
See my above comment.
What humans make is unnatural.
What everything else makes is natural.
Therefore, humans cannot be natural.
Humans are supernatural?
unconvincing argument … assumes “facts” not in evidence and slips in a change to the measurement of CO2 … “:10 PgC/year of 14C-free CO2″ .. nobody measures PgC and certailny not on a global scale and since CO2 is NOT a WELL MIXED gas its just useless …
1 ppmv CO2 = 7.8024 Gt CO2 = 2.12940 PgC. If you don’t like the units used, convert to the units you prefer.
Calculations of human CO2 emissions start with economic data on production/use of coal, oil & natural gas. CO2 is (12.0107/44.0095) = 27.29115% carbon by weight, so, for example, if you fully burn 1 tonne of 94% carbon anthracite coal, 0.94×44.0095/12.0107 = 3.444 tonnes of CO2 are emitted.
Except near sources and sinks, CO2 is considered a well-mixed gas. The average CO2 level at Mauna Loa (northern hemisphere) in 2024 was 424.61 ppmv. At Cape Grim (southern hemisphere) it was 420.01 ppmv. That’s only about a 1% difference. (The difference offers a clue to the rate at which wind currents mix CO2 emitted mostly in the northern hemisphere into the southern hemisphere’s atmosphere.) That’s pretty well-mixed.
Clarity convinces people, except those willfully ignorant.
CO2 is around 420ppm, with variations of 5 to 10ppm depending on where you measure. That’s a well mixed gas.
True. CO2 is a reasonably well mixed gas. But methane, which is less well mixed, is supposed to have a turnover time of 9.1 years. That does not make sense. CO2, with a lifetime of 3.9 years should not be more well mixed than methane. the highest concentration of methane is in the north of the northern hemisphere and about 8% higher than in the south of the southern hemisphere.
It raises the question, why is methane less well mixed than CO2 if it has a longer lifetime?
This suggests the lifetime of methane is less than the lifetime of CO2.
Less than 4 years.
Which would mean, natural emissions of methane were much greater and the anthropogenic portion much less.
Here is a graph showing the different concentrations of methane at different lattitudes.
John, you are mixing different definitions of residence time (as good as the IPCC frequently does)…
Both CH4 and CO2 are well mixed gases. It takes some time to get fully mixed when there are huge sources and sinks at work, but in general within a few years, the different stations follow each other.
The residence time (one of the definitions) for CO2 in the atmosphere is about 4 years. That means that some 25% of all CO2 in the atmosphere (~210 PgC/season) is moving from the oceans, via the atmosphere to vegetation in spring/summer and back in fall/winter. That CO2 is only moving through the atmosphere, not removed out of the atmosphere! Really removed is only some 5 PgC/year.
The latter gives the decay rate or better “adjustment” time of about 50 years to remove extra CO2 out of the atmosphere above the equilibrium with the CO2 pressure of the ocean surface, which depends of the sea surface temperature per Henry’s law. For the current average SST that would be around 295 ppmv.
If one plots the different stations over time, there is a difference that shows that most CO2 emissions are in the NH (with 90% of all industry) and it takes about 2 years to reach the South Pole with the same CO2 levels as near the North Pole (Point Barrow).
For CH4, no such cycle exists. Again it is mainly released in the industrial NH (by the use of natural gas – fracking, exploring oil, coal excavation,…), but there are, as far as I know, only a few small processes that absorb CH4 out of the atmosphere in nature.
What happens is a chemical reaction in the higher atmosphere / stratosphere itself, which oxidizes CH4 to CO2. That is a chemical process and takes about 9 years half life time. Some call that the “residence time”, I should call that the lifetime, but that is a matter of definition.
Anyway, the residence time of CO2 of about 4 years and the “residence” time of CH4 of 9 years are quite different kind of processes and not comparable…
BTW, during the warmer last interglacial, the Eemian, temperatures were higher than today, much permafrost and 1/3 of all Greenland ice melted, CH4 levels were around 700 ppbv. Currently near 2000 ppbv in the NH increased mainly after 1850…
https://www.methanelevels.org/
John, don’t be misled by the adjustment time notion. See The rebuttal of IPCC CO2 hysteria coming from Peter Stallinga in his 2023 publication Residence Time vs. Adjustment Time of Carbon Dioxide in the Atmosphere.
My synopsis:
https://rclutz.com/2023/03/26/co2-fluxes-not-what-ipcc-telling-you/
(1) The adjustment time is never larger than the residence time and is less than 5 years.
(2) The idea of the atmosphere being stable at 280 ppm in pre-industrial times is untenable.
(3) Nearly 90% of all anthropogenic carbon dioxide has already been removed from the atmosphere.
Ron, (1) by Stallinga is true if, and only if, all CO2 fluxes are unidirectional from input to atmosphere to output. That is completely at odds with the real world, where 95% of all (mainly seasonal) fluxes are just cycling in and out and only 5% is unidirectional: human emissions!
(2) Nobody says that, but the largest changes were not more than 15-20 ppmv/°C for glacial – interglacial transitions. The current changes over centuries less than 10 ppmv/°C, over years 3-4 ppmv/°C and seasonal -5 ppmv/°C (negative!).
(3) What did you expect, that all human CO2 remained in the atmosphere? If that was the case, then the total increase in mass would have been twice as high and the 13C/12C ratio drop three times stronger. The difference is present in oceans and vegetation.
BTW, with only 1.5%, growing to 5% in the inputs since 1958, the current level of fossil CO2 in the atmosphere is already 10%…
Impossible, if the model of Stallinga was right…
Stallinga (2023) is wrong. Read this comment on it to understand what is wrong with it:
Burton, D. A. (2024). “Comment on Stallinga, P. (2023), Residence Time vs. Adjustment Time of Carbon Dioxide in the Atmosphere.” OSF Preprints. https://doi.org/10.31219/osf.io/brdq9 (and there’s supplementary material here)
(The pay-to-publish journal which Stallinga published his paper in initially promised to publish my comment on it, but later reneged, so I just published it as a preprint.)
It is easily shown that, contrary to Stallinga’s claim (1), the adjustment time is much longer than the “residence time” (which the IPCC calls “turnover time”), because some of the processes which reduce the residence time do not reduce the adjustment time. E.g., when carbon is temporarily removed from the atmosphere, but soon released into it again, e.g. when taken up by leaves and grasses in the spring & summer, which die and rot in the fall and winter, or when it is absorbed by water which soon evaporates, those processes restart the residence time, but they do not affect the amount of CO2 in the air or the adjustment time.
Even if you don’t burn it, methane in the atmosphere oxidizes fairly rapidly, changing ultimately into small amounts of CO2 and water:
CH4 + 2⋅O2 → CO2 + 2⋅H2O (that’s very simplified; see details [html] [2])
Various sources give the half-life of CH4 in the atmosphere as 6 to 8 years, which would make the average lifetime 1.4427 times that (because oxidation of methane is an exponential decay process), yielding an average lifetime for a molecule of CH4 in the atmosphere of 8.7 to 11.5 years. The AMS gives a figure of 9.1 years (from Pranther et al 2012, which actually reports a figure of 9.1±0.9 years). However, page 11 of this presentation by Prof. Lyatt Jaeglé gives the directly-calculated atmospheric lifetime of CH4 as ≈8 years, but identifies a feedback mechanism which she says effectively increases the atmospheric lifetime of additional CH4 to ≈12 years.
Call it 9-12 years (compared with about 50 years for CO2). The half-life is ln(2) times that, which is between 6 and 9 years.
That’s pretty short. It means the only reason CH4 levels are as high as they are (about 1.9 ppmv† = 5.58 Gt) is that total CH4 emissions (natural + anthropogenic) are already high (between 580 and 710 Mt/yr). There would have to be a very large,‡ sustained increase in CH4 emissions to cause much increase in long-term average atmospheric CH4 levels.
Note that CH4 removal processes (mainly oxidation) dwarf the rate of CH4 accumulation in the atmosphere, and they accelerate with increasing atmospheric methane concentration, making them negative feedbacks. Assuming the Pranther atmospheric lifetime estimate (9.1±0.9 years), we can calculate that the rate of increase in CH4 level (which averages about 0.01 ppmv/year) is only about 1/60-th of the rate of the CH4 removal processes, and only about 1/35-th the rate of anthropogenic emissions. That means the CH4 level responds very quickly to changes in CH4 emission rate, and if the CH4 emission rate were to cease increasing then the level of CH4 in the atmosphere would rise at most only a few percent before plateauing.
†Methane levels vary slightly with measurement location; this site has some maps.
‡How large is “very large?” Well, for comparison, it would take about 3 Gt of CH4 to increase the atmospheric methane level by 1 ppmv.
John, Methane and Climate is a paper by W. A. van Wijngaarden and W. Happer.
“So the contribution of methane to the annual increase in forcing is one tenth (30/300) that of carbon dioxide. The net forcing increase from CH4 and CO2 increases is about 0.05 W m−2 year−1 . Other things being equal, this will cause a temperature increase of about 0.012 C year−1 . Proposals to place harsh restrictions on methane emissions because of warming fears are not justified by facts.”
“The paper is focused on the greenhouse effects of atmospheric methane, since there have recently been proposals to put harsh restrictions on any human activities that release methane. The basic radiation-transfer physics outlined in this paper gives no support to the idea that greenhouse gases like methane, CH4, carbon dioxide, CO2 or nitrous oxide, N2O are contributing to a climate crisis. Given the huge benefits of more CO2 to agriculture, to forestry, and to primary photosynthetic productivity in general, more CO2 is almost certainly benefitting the world. And radiative effects of CH4 and N2O, another greenhouse gas produced by human activities, are so small that they are irrelevant to climate.”
John,
I looked at this interesting offset and growth situation with respect to atmospheric methane (CH4) several years ago but, at the time, I could not find any convincing explanation.
Ferdinand says:
“Both CH4 and CO2 are well mixed gases. It takes some time to get fully mixed when there are huge sources and sinks at work, but in general within a few years, the different stations follow each other.”
This view is clearly not correct with respect to CH4 even if you believe that 15 years is the same as “a few years” (i.e. values in 2008 in the north versus 2023 in the south).
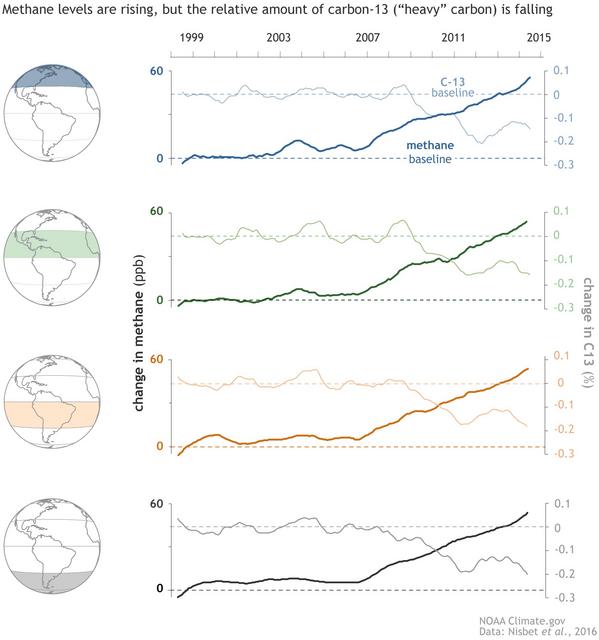
Your plot is telling us two things. First, the latitudinal offset is proved by the continuity between multiple sites at comparable latitudes. Second, the synchronicity of changes in growth is highlighted by the parallel nature of the trends and, in particular, the sudden shift to increased growth in late 2006. This latter point is clearly illustrated by the following 2016 plot from NOAA where each regional dataset is shown based on a common datum:
I have not done any research on this lately other than a quick data analysis yesterday between Alert, Mauna Loa and South Pole NOAA datasets that showed that the Mauna Loa CH4 data is increasing very slightly faster than the other two locations. (This observation is also seen with respect to atmospheric CO2.)
There is no evidence for a two year delay between northern and southern hemispheres for atmospheric CH4, which Ferdinand claims may be the case with atmospheric CO2. None.
Jim, I couldn’t find a climate dot gov source for that graphic, but I found a defunct website which used to have it. Archive dot org didn’t save that copy of the graphic, but tineye found it, and archive dot org has the web page which discussed it, here:
https://web.archive.org/web/20180216173805/http://solar.inventoturkiye.com/after-2000-era-plateau-global-methane-levels-hitting-new-highs-noaa-climate-gov/#:~:text=The%20post%2D2007%20uptick,methane%20is%20dropping%20worldwide
Excerpt:
That’s completely wrong. Carbon in fossil fuels is lighter, not heavier than the carbon in CO2 in the air. That is, carbon in natural gas is depleted, not enriched, in 13C.
The more negative δ¹³C is, the more depleted the carbon is of 13C. δ¹³C for coal and oil averages around -24‰, and natural gas is usually even lighter: -29‰ at least.
That mistake does not inspire confidence in the source!
Also, in 1999, the CH4 level at Mauna Loa (northern hemisphere) averaged 1772.3 ppbv, but at Cape Grim (southern hemisphere) they averaged only 1726.6 ppbv, suggesting that there’s a substantial lag in the propagation of CH4 from the northern hemisphere to the southern hemisphere. Yet all four latitude bands are shown with identical “0” values at 1999 in those graphs.
In other words, they graphed deviations from 1999 for each latitude band, rather than actual concentration values, and they used different baselines for each latitude band. That effectively hides the delay in propagating CH4 from the northern hemisphere (where most of it is emitted) to the southern hemisphere.
I found it, Jim!
https://www.climate.gov/news-features/understanding-climate/after-2000-era-plateau-global-methane-levels-hitting-new-highs
As I might have guessed, that error-riddled article, like so many other misleading articles on climate.gov, is by recently fired serial disinformer Rebecca Lindsey.
Personally, I focus on the data first rather than the author! In fact, your very first statement above is invalid because you are comparing δ13C in atmospheric CO2 when you should be looking at δ13C in atmospheric methane: two very different values. Currently at Mauna Loa, the atmospheric δ13C_CH4 is around -47.9‰ and is still dropping (as shown in the NOAA paper). Hence, the incremental methane must have a net δ13C that is even lower. When I last looked at the data, I derived a δ13C_CH4 value of around -60‰. I will try to find time to update this estimate, but note that this is more in line with a biogenic source than a thermogenic source (i.e. fossil fuels).
My conclusion is entirely consistent with the statement from the paper: “The drop [in atmospheric δ13C_CH4] seems to rule out fossil fuel emissions, wildfires, or biomass cook stoves as the reason for the post-2007 methane surge. All those sources of methane, to a greater or lesser extent, are enriched in carbon-13, not depleted [relative to atmospheric δ13C_CH4]”.
The second issue with your comment is with regard to the NOAA plot that I showed where the reported atmospheric methane data were shown relative to a common datum. This is exactly the correct approach to distinguish between timing delays, where character changes (e.g. changes in gradient or ‘knee points’) are seen at different times due to transmission delays, as opposed to being synchronous, as they are in the case of atmospheric methane. The parallel nature of these changes is clear in John’s plot. The NOAA version simply highlights the timing synchronicity that exists in the raw data. In both cases, it is clear that something caused atmospheric methane to start increasing at virtually identical times (late 2006) globally as well as having a near identical rate of increase globally thereafter.
Jim, that’s a very good point about comparing with the δ13C of atmospheric methane rather than CO2. Thank you for the correction.
Methane derived from fossil fuels is depleted of carbon-13, but methane from methanogenic decay processes is even more depleted of carbon-13, and atmospheric methane is mostly from methanogenic decay. So the δ13C of atmospheric methane is very negative.
As I mentioned here a couple of days ago, the carbon in atmospheric methane becomes carbon in atmospheric CO2 in short order. Even if you don’t burn it, methane in the atmosphere oxidizes quite rapidly, changing ultimately into small amounts of CO2 and water, with a half-life in the neighborhood of 6-9 years:
CH4 + 2⋅O2 → CO2 + 2⋅H2O (that’s very simplified; see details [html] [2])
That means the only reason CH4 levels are as high as they are (about 1.9 ppmv = 5.58 Gt) is that total CH4 emissions (natural + anthropogenic) are already high (between 580 and 710 Mt/yr). There would have to be a very large, sustained increase in CH4 emissions to cause much increase in long-term average atmospheric CH4 levels.
CH4 removal processes (mainly oxidation) dwarf the rate of CH4 accumulation in the atmosphere, and they accelerate with increasing atmospheric methane concentration, making them negative feedbacks.
I wondered whether the half-life in the atmosphere of “heavy methane” (¹³CH4) is the same as the half-life of “light methane” (¹²CH4), so I asked Perplexity AI. It gave me a detailed answer, apparently based mostly on this paper:
M.A. Haghnegahdar, et al. (2023). “Tracing sources of atmospheric methane using clumped isotopes,” Proc. Natl. Acad. Sci. U.S.A. 120 (47) e2305574120, https://doi.org/10.1073/pnas.2305574120.
According to Perplexity, the answer is that ¹³CH4 (heavy methane) has a slightly longer half-life, but by at most only a couple of weeks.
Returning to the original question, of how long it takes for emissions in one hemisphere to affect the other…
In that climate.gov graphic, the lack of grid lines makes it difficult to judge just when the pause in CH4 increases happened, so I added a few grid lines, in this version:
I agree with you that the end of the pause seems to have occurred at almost the same time in both hemispheres (mid-2006). However, the beginning of the pause seems to have been more than a year earlier in the northern hemisphere than in the southern hemisphere. (I cannot explain the difference.)
Dave,
NOAA states, with respect to the pause in methane growth rate, that “The driver behind these variations are [sic] still unclear” in a 2021 (or more recent) statement (https://gml.noaa.gov/ccgg/arc/?id=136).
FWIW (not much!) I would suggest that in order for the increase starting in 2006 to occur essentially simultaneously across the globe it is more likely to be the result of a global atmospheric change (reduction) in the effectiveness of the primary sink (oxidation in the atmosphere by reaction with a hydroxyl radical – OH) rather than driven by a change (increase) in source(s). The location of different sources is more likely, in my view, to provide an explanation for the offsets from north to south. We know from the δ13C data that the overall increases in methane emissions is not primarily from fossil fuels. I would further speculate that, other than changes to the primary sink, methane emissions growth is largely driven by increasing global temperatures.
Whatever, it is fascinating to see, yet again, a crucial aspect of our understanding that doesn’t come close to being ‘settled science’.
Jim, the direct measurements by satellites show far more releases of CH4 from rice paddies and industry, but also from wetlands.
https://www.iup.uni-bremen.de/sciamachy/NIR_NADIR_WFM_DOAS/wfmd_image_gallery_ch4.html
The increase in methane was mainly after 1850, as seen in ice cores: around 650-700 ppbv (similar as during the Eemian, 130,000 years ago), climbing to near 2000 ppbv nowadays:

Or here in the high resolution (~20 years) Law Dome ice core and other ice cores:
https://essd.copernicus.org/articles/11/473/2019/
During the Eemian, far more permafrost was melted, trees did grow up to the Ice Sea in Alaska and 1/3 of the Greenland inland ice was melted…
Thus the human input again is quite clear…
Ferdinand,
I am familiar with all of these arguments. I am much more interested to hear possible explanations of why atmospheric methane growth slowed to zero during the 1990s and then kicked off again in late 2006. I am interested in the synchronicity of both changes, despite the significant latitudinal offsets, but particularly the latter change as clearly shown in the NOAA plot I posted above.
I agree the river interpretation is full of holes – riverbed erosion didn’t supply all that extra CO2.
But the CO2 Coalition keeps trying to ram the idea through that all the ML CO2 growth is from emissions. This is false, which can be determined easily by mass balance accounting since 1959.
The Mauna Loa rising and sinking phase annual timeseries were decomposed from the Carbon Cycle Year from October to September, from the absolute changes during each Carbon Cycle year for each year from 1959-2024, below, panels 1 & 2.
The rising phase is from October of the previous year to the May peak, and the sinking phase is the difference from the May peak to the September minimum, for each year in both timeseries.
Annual man-made emissions (MME) contribute to the ML rising phase timeseries, as expected.
The gap between panel 2 rising phase in red and MME in black is from other CO2 sources.
It is an almost a 50% split between ΣMME and Σ(other sources) in 2024, and 39% w/net MME.
The CO2 rising phase and CO2 changes are significantly synchronized with tropical and global SST.
Therefore the most likely other source of the CO2 rising phase is from warmer ocean outgassing.
I await the usual suspects who will try to tell me this isn’t so, mostly by repeating themselves.
Bob, you are looking at the maximum +/-2 ppmv variability around a 130 ppmv trend and assume that both are caused by the same driver, temperature.
Let us start with the first graph: in spring/summer T goes up, the sun is shining longer, new leaves start to grow and trees suck CO2 out of the atmosphere. Net global effect (mainly caused by the NH forests): about -5 ppmv/°C. CO2 negative with temperature…
The second and following graphs: T goes up, CO2 goes up with 3-4 ppmv/°C. CO2 positive with temperature.
In both cases, caused by the fast reaction of vegetation (of different parts of the world) on temperature changes, which can be deduced from the opposite CO2 and δ13C isotopic changes.
Over periods of a decade to a few million years, the oceans are dominant with a ratio of up to 15-20 ppmv/°C over very long periods (glacial – interglacial transitions). Deduced from the very small change of δ13C over the past 800,000 years with large changes in CO2: -6.5 +/- 0.4‰ δ13C. Up to about 1850. With an enormous drop down to nowadays -8.2‰ δ13C thereafter.
The current change of CO2 since the accurate measurements at the South Pole and Mauna Loa, beginning in 1958, is over 100 ppmv. Over the same period, humans emitted 170 ppmv CO2 from fossil fuel use. Not including the CO2 emissions from land use changes:
The temperature influence from warming oceans is calculated with the formula of Takahashi, which reflects the influence of temperature on the seawater CO2 pressure (pCO2) in equilibrium with the atmosphere.
In conclusion: temperature has a minor influence on current CO2 levels and the bulk of the increase is certainly caused by human emissions…
“Bob, you are looking at the maximum +/-2 ppmv variability around a 130 ppmv trend and assume that both are caused by the same driver, temperature.”
You’ve missed realizing the trend is partly caused by MME and part by outgassing.
The interesting thing about Henry’s Law and the warming ocean is the warm area where most outgassing occurs has expanded by ~50% while warming since the 1850s, ie the area of the ocean ≥25.6°C. While this warm area expanded, the area of colder SST shrank, gradually restricting the sinking ability of the cold area ocean, together acting as a CO2 valve.
Thus the ocean temperature change does have something to do with the CO2 trend.
“In both cases, caused by the fast reaction of vegetation (of different parts of the world) on temperature changes, which can be deduced from the opposite CO2 and δ13C isotopic changes.”
Some of the annual CO2 rising phase is from decomposing vegetation, but some of it is from the annual outgassing that occurs every year from seasonal insolation warming.
It is overly simplistic to assume the last (few) year’s leaves and grasses decomposed sufficiently to provide the entire annual CO2 rising phase increase, when root and trunk growth store a large portion of the annual converted CO2, particularly in trees and shrubs, that are not subject to annual decomposition. Also, part of the rising phase positive trend is from MME, not just from vegetative decomposition or ocean outgassing.
“The current change of CO2 since the accurate measurements at the South Pole and Mauna Loa, beginning in 1958, is over 100 ppmv. Over the same period, humans emitted 170 ppmv CO2 from fossil fuel use. Not including the CO2 emissions from land use changes”
You have already completely ignored the information I imparted, which btw includes land use changes. Your summed CO2 changes are the net CO2, not the rising phase, so you have chosen to neglect the necessary larger rising phase required to achieve the net after sinking. This is the classic mistake that my work corrects.
You have literally left the rising phase out of your analysis.
Bob, the outgassing of CO2 from the oceans is completely dwarfed by the huge intake of CO2 by plants in spring/summer, in that way that CO2 levels drop with temperature. The main drop is caused by the deciduous forests in the NH, here reflected in the opposing CO2 and δ13C levels at Point Barrow and Mauna Loa:
If the CO2 changes were from the oceans, then CO2 changes and δ13C changes would parallel each other.
The year by year changes also are mainly caused by the rapid response of vegetation, this time from the Amazon and other tropical forests on rapid temperature changes, including changed rain patterns, where during an El Niño the Amazon dries out, releasing a lot of CO2:

The (very) long term trend pre-1850 is dominated by the oceans and gets a maximum of 15-20 ppmv/°C over very long time frames. Less than 10 ppmv since 1850 from warming oceans. That is all that temperature has done in the recent past. Maximum 10% of the CO2 rise in the atmosphere.
That are three different processes which act completely independent of each other. In all three processes, the human supply of extra CO2 will have an influence, but these processes are not the cause of the CO2 increase in the atmosphere, currently both the oceans and vegetation are taking CO2 away from the atmosphere…
Hi Bob
Love your work.
I might be wrong and you might be wrong, but at least we are able to have a chance to put forward our thoughts.
Thank whichever deity you prefer but at least we are able here to express our thoughts.
Real science happens when when you are allowed to her another point of view.
air, not her
Thanx John. Are we having fun yet?
Bob, the seasonality of CO2 levels varies with location, and Mauna Loa is just one location. (It just happens to have a particularly long, high quality measurement record.)
At Cape Grim (in the southern hemisphere) the polarity of the seasonal cycle is reversed, and the magnitude is much different:
That’s because the seasonal cycle is mainly due to biological processes. (Seasonally cycling water temperatures also contribute.) In spring and summer, plants harvest carbon from CO2 in the air. In the fall and winter those same plants die and rot, releasing CO2 into the air. The seasons are reversed in the southern hemisphere, so the CO2 cycles are also reversed.
Human influence has increased the magnitude those seasonal cycles somewhat, through “greening.” Higher CO2 levels, thanks to human emissions, improve the health and productivity, not only of agricultural crops, but also of wild plants. More & faster-growing plants cause larger CO2 seasonal cycles.
Human CO2 emissions do not merely contribute to “the rising phase” at Mauna Loa, they add to the total amount of CO2 in the atmosphere, everywhere, all the time. (Over hemispheric distances it mixes gradually, over a couple of years.)
I find it remarkable, and disheartening, that some people do not accept the fact that adding something to the atmosphere increases the amount of if in the atmosphere.
● Mankind is adding CO2 to the air.
● Nature (the net sum of all natural sources and sinks) is removing CO2 from the air.
● The amount of CO2 in the air is increasing because mankind is adding it faster than nature is removing it.
It really is that simple.
The fact that some self-styled skeptics are confused about such a simple concept surely encourages many other people to dismiss skeptics of climate alarmism as unserious. That is unfortunate.
Again I notice no change due to the Covid deindustrialisation. Why is that?
Economic downturns, like the Covid recession, reduce emissions slightly. But not much. The effects of the Covid-19 pandemic temporarily reduced 2020 CO2 emissions by between 5 and 8%.[2] That small change was dwarfed by the amount by which the rate of anthropogenic CO2 emissions exceeds natural CO2 removals, and also dwarfed by typical year-to-year variability.
That was the net, annual decrease, which includes the Summer draw-down, which damps the monthly changes. The IEA estimated that the draw-down was more than 14% for April 2020 alone. There is minimal CO2 removal during the NH Winter and early-Spring months, giving a better view of the contrasting seasonal behavior.
As I have pointed out previously, there is no discernible change in the shape, general slope, or peak (May) for the 2020 ramp-up phase; the first five-months of 2020 are indistinguishable from from 2019 and 2021. Using data with a higher temporal resolution than you rely on does not show an effect from decreased human emissions.
https://wattsupwiththat.com/2022/03/22/anthropogenic-co2-and-the-expected-results-from-eliminating-it/
I meant that the Covid recession reduced anthropogenic CO2 emissions by between 5 and 8%. I’m sorry that I was unclear.
Anthropogenic CO2 removals from the atmosphere are negligible. Almost all CO2 removals are by nature.
During the Covid recession, the usual natural seasonal cycles continued apace, of course. The effect of the Covid recession on the CO2 level was almost entirely by its effect on anthropogenic CO2 emissions. That effect was smaller than the usual year-to-year variability in net natural CO2 fluxes, which is why it wasn’t noticeable in the CO2 level graphs.
Just a general observation about arguments based on stable isotope ratios, and I have a lot of papers that invoke stable isotope data, is that such arguments are very rarely definitive. There seemingly are always multiple ways of getting the answer you want.
In this case, the change in isotopic ratio is enormous: Currently in the atmosphere at -8.2‰, down with -1.8‰ δ13C since about 1850, while the ratio was quite stable over the past 800,000 years at -6.5 +/- 0.4‰ δ13C up to about 1850. And a similar enormous drop can be seen in the ocean surface waters. That leaves little doubt about the cause…
If all fossil emissions had remained in the atmosphere, the drop in δ13C even would have been three times lower in the atmosphere. The difference is due to the replacement of fossil CO2 with CO2 from other reservoirs in the atmosphere and the distribution of fossil CO2 over all other reservoirs…
Lots of adjustments, scaling, and comparison of what are in fact proxies with instrumental records. Has the elephant been fit?
δ13C in both ice cores – firn – atmosphere are direct measurements of the ratio in air samples. Smoothly going from one medium to the next.
Including an overlap of ~20 years (1958-1978) between ice core air and direct measurements at the South Pole.
The only drawback: air included in the Law Dome ice core is a mix of about 8 to 20 years of air.
δ13C in coralline sponges are direct measurements and reflect the δ13C of the surrounding ocean surface waters. They had a resolution of 2-4 years over the full 600 years record length.
The fact that both show exactly the same drop in δ13C over the same time frame, completely independent of each other, is a sign that these measurements reflect reality…
The way you stated it, it sounds like an assumption. Are you claiming that no isotopic fractionation occurs when the sponges build their structures?
Which doesn’t address the hysterical assertion by the anti-carbonists that all the beautiful extra CO2 in the atmosphere is causing the catalog of horrors they keep terrorizing people with. There is no evidence for their claims. Observations (otherwise known as “science”) show that the modest ~1 ºC of warming over the last century and a half has been beneficial, not harmful, regardless of how much can be attributed to increasing CO2, which is far from certain. What is certain is that the increased CO2 has improved crop yields and vegetation over the entire planet, as satellite surveys have shown. Being a doomsayer is a living hell. They can never appreciate the serendipitously beneficial circumstances they find themselves in. They have to find something to complain about.
Indeed. We are the carbon they want to reduce, and this is the “crisis” they want to reverse:
https://sealevel.info/learnmore.html?0=benefits

Rising atmospheric CO2 is not mostly caused by Human CO2, and Isotope evidence does not support that theory.
IPCC data shows that total CO2 emissions now are about 95% Natural and less than 5% from Humans.[1]
Natural and Human CO2 emissions mix in the atmosphere. Molecules of the same isotope are the same whether they are from Nature or Humans and the mixture is absorbed the same by plants and the ocean. The atmosphere cannot be more concentrated in Human CO2 than the 5% Human that enters the atmosphere. This would be about 20 ppm Human out of 420 ppm total CO2.
Assuming that Natural CO2 has a short residence time in the atmosphere – about 4 years – but Human CO2 resides for hundreds or thousands of years or forever is unscientific nonsense.
Increased atmospheric CO2 is explained by increases in temperature because CO2 solubility decreases with temperature. When sea surface warms, CO2 evolves. When sea surface cools, CO2 is absorbed.
Data shows Sea Surface temperature drives atmospheric CO2: Mauna Loa atmospheric CO2 changes Lag sea surface temperature by 11 to 12 months.[2] See chart.
Ice core data also shows temperature changes first and CO2 follows.[3][4]
All this data means Temperature Change is the Cause and CO2 Change is a Response.
Carbon isotopes are about 99% C-12 and 1% C-13. Atmospheric CO2 would naturally be lower in C-13 CO2 because the C-13 CO2 is heavier and less volatile than the lighter C-12 CO2.
John E. Greer, Jr., P.E., Real Climate Science shows Human CO2 Cannot Cause a Climate Crisis!: The effect is too small.
[1] https://www.ipcc.ch/report/ar5/wg1/carbon-and-other-biogeochemical-cycles/rough_1-3/
[2] Humlum, O., Stordahl, K. and Solheim, J-E. 2012. The phase relation between atmospheric carbon dioxide and global temperature, Global and Planetary Change 100 (2013) Last chart update 1 August 2019.
[3] https://joannenova.com.au/2009/12/carbon-rises-800-years-after-temperatures/
[4] Roe, G. (2006) In defense of Milankovitch, Geophysical Research Letters Volume 33 Issue 24 December 2006, L24703, doi:10.1029/2006GL027817
John, you make the classic mistake of assuming that the CO2 level in the atmosphere is caused by the sum of all inputs. That is the “classic” model where all CO2 fluxes are unidirectional between input – atmosphere – output, That model is completely at odds with the real world.
In reality, 95% of all CO2 just cycles in and out between atmosphere, oceans and vegetation over the seasons, completely independent of the CO2 level in the atmosphere, but temperature, photosynthesis and life dependent. Only 5% of all CO2 fluxes are CO2 pressure difference (with the CO2 pressure of the ocean surface and plant alveoles water) dependent, not even depends on the absolute CO2 pressure in the atmosphere.
That is the realistic “fountain” model where lots of water are pumped over the fountain, but opening the small supply valve is what really increases the water level in the basin of the fountain…
The influence of temperature is very modest: maximum 15-20 ppmv/°C over extremely long periods like glacial – interglacial transitions (with a “speed” of 0.02 ppmv/year!). Less than 10 ppmv for the warming since 1850, calculated with the formula of Takahashi:
(pCO2)seawater AT Tnew = (pCO2)seawater AT Told x EXP[0.0423 x (Tnew – Told)]
The residence time of about 4 years shows the exchange rate of molecules between the different reservoirs (the “pump rate” over the fountain). That doesn’t remove one gram of CO2 out of the atmosphere. Completely irrelevant.
The observed (!) real decay rate is the “adjustment” time (the overflow of the fountain basin) that is the time to remove CO2 to 1/e of the extra above equilibrium, is around 50 years or about 35 years half time. Two completely different, independent of each other, times…
The much longer “life times” that the IPCC uses for part of the CO2 in the atmosphere are based on the Bern model, which has its own problems…
Ferdinand,
What is CO2 supposed to do? Nobody seems to be able to say – which makes blaming it for bad weather (or anything else) a bit silly.
Might as well blame the weather gods, and be done with it.
CO2 is evil? That’s a religious belief – nothing to do with science.
I think we here all agree that the effect of more CO2 is far more benign in many aspects (including larger agricultural yields) than there may be some (unknown) drawbacks.
My problem is that by insisting that the current CO2 increase is not man-made, the skeptics of catastrophic effects of more CO2 shoot in their own foot as unreliable theorists, who can’t even figure out that adding CO2 directly to the atmosphere does increase CO2 in the atmosphere…
BTW, while the input of fossil CO2 in the period 1958-current was only between 1.5% and 5%, the current isotopic composition of the atmosphere shows that already 10% of the atmosphere (and some 6% of the ocean surface inorganic carbon) is derived from fossil fuels.
Which proves that the “classic” model is wrong…
How are all the ordinary people like me who don’t hold science degrees or study this stuff for a living supposed to understand climate? It makes a refreshing change to see respectful debate on this page which clearly shows that the science is nowhere near settled. What we need is more balanced public debate rather than it all being one-sided e.g ‘the planet is about to boil, so stop breathing.’
Us ordinary (less-eductaed folks) need answers to the important questions around this subject:
Who decided that CO2 was bad anyway? Isn’t is beneficial e.g. makes the planet greener?
Why are renewables so bloody expensive?
How much CO2 gets belched into the atmosphere from volcanoes, how do you separate that from what humans produce?
Contrary to a widespread Internet hoax, volcanoes contribute a negligible amount of CO2 to the atmosphere, compared to human emissions, on human time scales. (On geological time scales it’s a different matter.)
In a graph of CO2 levels, you can’t even see the increase in measured CO2 levels far away from a volcano, not even from the enormous 1991 Mt. Pinatubo eruption, and certainly not from Mt. Etna.
In fact, the opposite is true:
A temporary reduction in the growth rate of atmospheric CO2 was noticeable over the 2 to 3 years following the Mt. Pinatubo eruption, perhaps because particulates ejected by the eruption cooled the planet, which temporarily increased CO2 absorption by the oceans (because gases like CO2 dissolve more readily in cool water than in warmer water), and/or perhaps because iron and other minerals in the volcanic ash fertilized the ocean and thereby increased CO2 uptake by ocean biota (Sarmiento, 1993 [pdf]), and/or perhaps because of the effects of sunlight scattering on vegetation growth (Farquhar & Roderick, 2003 [pdf]).
Most scientists estimate that mankind’s CO2 emissions from burning fossil fuels and making concrete are more than 20 times as large as total CO2 emissions from all volcanoes.
The highest estimate I’ve seen for volcanic CO2 emissions is about 0.5 Gt/year[2] for terrestrial volcanoes, plus whatever submarine volcanoes emit. Even if submarine volcanoes emit 2.5× that, the total would still be less than 2 Gt/year (compared to about 40 Gt/year for mankind’s emissions).
(Caveat: estimates of volcanic CO2 emission rates are very rough, and rates from submarine volcanoes are really just guesses, and some geologists — notably Ian Plimer — think they are badly underestimated.)
The good news is that’s not a problem. Just the opposite, in fact. NASA measures the beneficial effects of rising CO2 levels, from satellites:
Another interpretation to entertain is that the cooling reduced the activity of bacteria decomposing detrital material.
Perhaps. After all, we know that CO2 levels dip slightly during cold periods, like the LIA.
OTOH, seasonal cooling (in autumn) coincides with an uptick in CO2 concentration. At Mauna Loa, the CO2 seasonal cycles spans a range of about 7 ppmv, and bottoms out in late September, before rising to a seasonal peak in early May.
At Barrow, Alaska, where the seasonal cycle is enormous, spanning a range of about 16 ppmv, the minimum is typically in late August.
One last question from me….isn’t the biggest contributor to planetary warmth, the Sun?
Harold The Organic Chemist Says:
RE: CO2 Does Not Cause Warming Of The Air.
Shown in the chart (See below) are plots of temperatures at the Furnace Creek weather station in Death Valley from 1922 to 2001. In 1922 the concentration of CO2 in dry air was ca. 303 ppmv (0.59 g CO2/cu. m.), and by 2001, it had increased to 371 ppmv
(0.73 g CO2/ cu. m.), but there was no increase in the air temperature at this remote desert.
The reason there was no increase in air temperature at this arid desert is that the absorption of out-going long wave IR radiation by CO2 becomes saturated at 300 ppmv.
Adding increasing amounts of CO2 to the air does not result in increasing surface air temperature. If there has been an increase in air temperature at this desert since then, it is due to other causes.
Here is the refs for the saturation effect:
The saturation of the infrared adsorption by carbon dioxide in the atmosphere.
by Dieter Schildknecht
https://arxiv.org/pdf/2004.00708.v1
https://climateatglance/carbon-dioxide-saturation-in-the-atmosphere
The challenge is now is to convince everyone that the claims by the IPCC and the collaborating scientists that CO2 causes global warming and is the control knob for climate change are incorrect and we do not have to reduce the emission of CO2 from
the use of fossil fuels. Look what these claims have done to the economies of the UK, Germany, Australia, and California, for example.
PS: If you click on the chart, it will expand and become clear. Click on the “X” in the circle to return to text.
MB: The chart was obtained from the late John Daly’s website:
“Still Waiting For Greenhouse” available at http://www.john-daly.com. From the homepage, scroll down to the end and click on “Station Temperature Data”. On the “World Map”
click on a region or country to access temperature data from over 200 weather station located around the world. These charts show no warming up to 2002.
Harold:
And I’ve shown you this before ….
How about you continue your graph(s) another 25 years?
“The mean average temperature in Death Valley, CA every year since 1952. (Credit: Death Valley National Park)”
https://www.8newsnow.com/news/local-news/death-valley-breaks-record-with-hottest-summer-yet/
On August 1, I will be 81 years of age and I do not know how use the computer to obtain data from various sites and data bases and to make graphs. My son captures images and stores them for me in image file.
Your chart is not in agreement with John Daly’s chart. None of the temperatures were greater than 40° C. John Daly obtained temperature data from the GISS and CRU data bases.
Check out this chart of Adelaide which shows a cooling since 1857.
I no longer trust recent temperature data bases since these have undergone
adjustments and homogenizations. Go to the BoM’s ACORN-SAT where you can learn about the procedures and justifications for these.
“I no longer trust recent temperature data bases since these have undergone
adjustments and homogenizations. Go to the BoM’s ACORN-SAT where you can learn about the procedures and justifications for these.”
Harold: which is why peeps like you will always “win” in these discussions *in your own and most denizens mind/s here* – In the end it is always “they’ve altered the data fraudulently”.
There is literally no way around that mid-set.
You pays yer money and takes yer choice, but personally I think it takes a particular personality to believe such conspiracy theories.
Being suspicious of adjustments to the data doesn’t make someone a conspiracy theorist. You can be wary of confirmation bias without suspecting intentional fraud or some sort of grand conspiracy.
https://www.youtube.com/watch?v=j7BOkIvsi8E
Do you remember when the Argo floats were measuring a cooling ocean… until Dr. Josh Willis fixed the data?
Dr. Willis is a passionate climate alarmist, who calls climate change “The Apocalypse.” So when the Argo floats measured ocean cooling instead of warming, he looked hard to find an error—and he found one.
Do you think he would have looked as hard if the measurements had initially shown the warming that he expected, instead of cooling that he did not expect?
You can find the same sort of thing in satellite altimetry measurements of sea-level. Here’s a heavily-cited 2014 paper:
Cazenave, et al. (2014). The rate of sea-level rise. Nature Clim Change 4, 358–361. https://doi.org/10.1038/nclimate2159
They sought to explain away an apparent declining trend (deceleration) in the rate of sea-level rise measured by satellite altimetry. They managed to massage the data until that embarrassing decline had almost entirely disappeared.
Here’s a pair of graphs from the paper, with “before” and “after” versions, showing how they “corrected” the work of five (5) different satellite altimetry analysis groups, to almost completely eliminate the decline which all five groups had reported.
(Does that remind you of anything?)
In a 2017 paper they finished the process. With additional adjustments to old data, and a few more years of new data, the same group finally managed to find the elusive acceleration:
H. B. Dieng, A. Cazenave, et al. (2017). New estimate of the current rate of sea level rise from a sea level budget approach. Geophys. Res. Lett. 44(8), 3744-3751. https://doi.org/10.1002/2017GL073308
Here’s a graph from the paper, triumphantly showing the long-sought acceleration:
Meanwhile, most of the best coastal measurements (tide gauges) still show little or no acceleration. The best-sited long measurement record is from Honolulu:
https://sealevel.info/MSL_graph.php?id=Honolulu
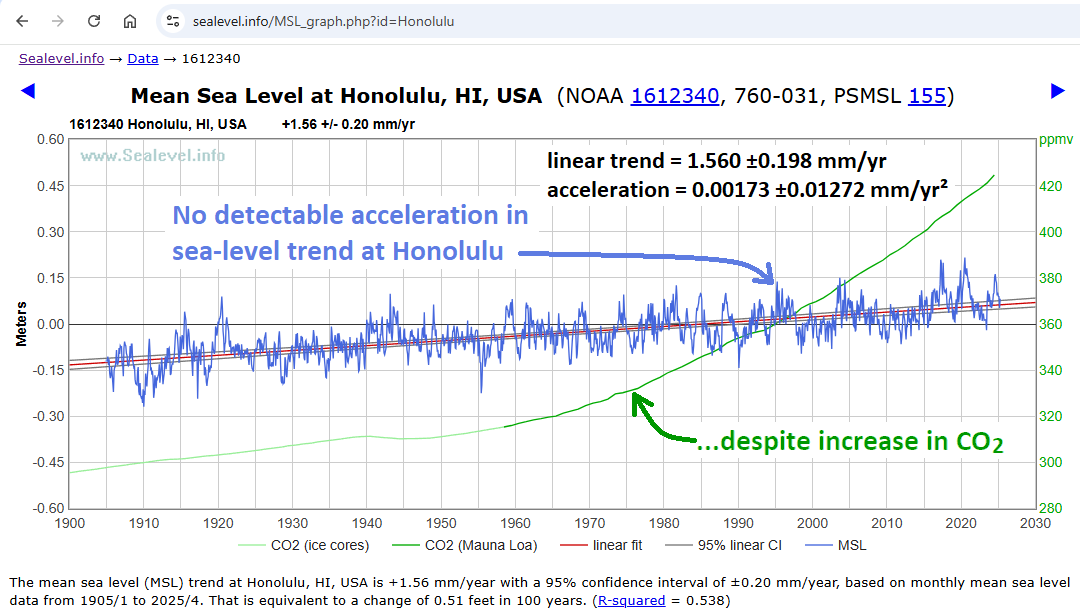
“If you torture the data enough, nature will always confess.”
– Ronald H. Coase
The most likely reason for the higher temperatures in you chart is a relocation of the weather station followed by adjustments to the raw data. Go to John Daly’s website where he discusses the problems of measurement temperature at Furnace Creek and Badwater.
The idea that you can “adjust” past measurements to make them “correct” is just plain fraud, intentional or not.
Unless you have a Jules Verne time machine and a calibration lab you can take with you into the past, *guessing* at a correct value in the past only *adds* measurement uncertainty to the result. But this is NEVER acknowledged by climate science.
You should go to Australia’s BoM ACORN-SAT. For each weather station there is a file that list all of the adjustments.
Adjusting past measurements is *still* nothing more than a guess. And a guess just adds to the measurement uncertainty. So climate science just avoids using actual measurement uncertainty and assumes it all cancels out in the end. Its garbage science.
Ask a professional surveyor if he would “adjust” his data based on what he thinks is “right”. Especially for readings he took ten years ago laying out a housing development. I don’t know of any who would do that. They all would go take new measurements and substitute those for the old ones. How do you do that for temperature if you don’t have a time machine?
I didn’t see a reference as to how much CO2 may be released by mining activities. We’ve certainly been increasing our tilling of the earth’s crust for all sorts of ores since the Industrial Revolution. Wouldn’t the exposure of all that tillage result in increased ancient CO2 release as well?
Yes, there are many minor factors which either add CO2 to the atmosphere or remove it, but in quantities that are tiny compared to the amount of CO2 released from burning fossil fuels. For example, have you heard of “cement carbonation?”
As concrete ages it absorbs CO2 from the air, in a process called “carbonation.” It is estimated that, on average, aging concrete eventually removes nearly half as much CO2 as was released by the conversion of limestone into lime, when making the cement. Here’s a paper about it:
Xi, F., Davis, S., Ciais, P. et al. Substantial global carbon uptake by cement carbonation. Nature Geosci 9, 880–883 (2016). https://doi.org/10.1038/ngeo2840
They call it “substantial,” but it is still minor. They estimate that cement carbonation is removing 0.25 PgC/year (compared to human CO2 emissions of about 10 PgC/year).
These studies about the details of minor contributors to the carbon cycle, like “old carbon” released from rivers, and carbon removed by cement carbonation, are interesting, but they don’t affect the conclusion that atmospheric CO2 levels are increasing because of human CO2 emissions:
● Mankind is adding CO2 to the air, mostly by burning fossil fuels.
● Nature (the net sum of all natural sources and sinks) is removing CO2 from the air.
● The amount of CO2 in the air is increasing because mankind is adding it faster than nature is removing it.
Harold The Organic Chemist Says:
RE: CO2 In The Air Update.
RE: Greenhouse Effect
RE: Greenhouse Gases: H2O vs CO2
At the Mauna Lao Obs. in Hawaii, the concentration of CO2 in dry air is currently 430 ppmv. One cubic meter of this air has a mass of 1.29 kg and contains a mere 0.845 g of CO2 at STP.
In air at 70° F and 70% RH, the concentration of H2O is 17,780 ppmv. One cubic meter of this air has a mass of 1.20 kg and contains 14.3 g of H2O and 0.77 g of CO2.To the first approximation and all things being equal, the amount of the greenhouse effect (GHE) due to H2O is given by:
GHE=moles H2O/moles H2O+moles CO2=0.79/0.79+0.018=0.98 or 98%
This calculation assumes that a molecule of H2O and a molecule of CO2 absorb about the same amount of out-going long wave IR light. Actually, H2O absorbs more IR light than CO2. Please keep in mind that 71% of the earth surface is covered with H2O and the wind transports enormous amounts of H2O from the oceans onto the land, that there is little CO2 in the air and that there is no need to control the emission of CO2.
The claims by the IPCC and the unscrupulous collaborating scientists (aka welfare queens in white coats) that CO2 causes “global warming” and is “the control knob for climate change” are fabrications and lies. The purpose of these lies is to provide the justification for the maintenance and generous funding of not only the IPCC but also the UNFCCC and the UN COP and for distribution of funds from the rich donor countries to the poor countries to help the cope with global warming and climate change. At the recent COP29 conference the poor countries came clamoring for not billions but trillions of funds. They left the conference empty handed with no pledges of funds from the rich countries.
Hopefully, President Trump will put an end to the greatest scientific fraud since the Piltdown Man. When the EPA rescinds the greenhouse gas endangerment finding, all the claims that the use of fossils fuels by humans are causing global warming and climate change will vanish overnight.
Harold, I agree with you that CO2 is not the “principal control knob” for climate. Over the last 800K years, the principal control knob has been Milankovitch cycles.
Ice core data shows that, time and again, the Earth started warming when CO2 levels were at or near minima, and the Earth started cooling when CO2 levels were at or near maxima. If CO2 were actually the “principal control knob” for temperatures that wouldn’t have happened.
CO2 does have an effect, but it’s more of a vernier knob. Adding CO2 has a modest warming effect, and CO2 feedback is partially responsible for the striking hysteresis in the Earth’s glaciation cycles. But, over the last 800K years, Milankovitch cycles, not CO2, have been the “principal control knob” for the Earth’s climate.
However…
Harold wrote:
There are two problems with that approximation.
Problem #1. It assumes that the so-called “greenhouse effect” from a “greenhouse gas” (GHG) is proportional to the concentration of the GHG. It isn’t.
CO2, water vapor and other GHGs are colorants. They tint the atmosphere, though in the far infrared, rather than visible part of the spectrum. They absorb radiation which otherwise would’ve escaped to space.
CO2 in the air absorbs IR radiation at wavelengths near the peak of the Planck curve for typical surface temperatures. CO2 causes the big notch in Earth’s emission spectrum, which I’ve marked in green, here:
Absorbing radiation makes whatever absorbed it warmer than it otherwise would have been.
In the case of CO2, there’s already so much of it in the air that additional CO2 does not much change the percentage of radiation from the ground which manages to pass through the atmosphere without being absorbed. It’s like adding more dye to a liquid which is already strongly colored by that same dye; the addition has little effect on the color. There’s already so much CO2 in the air that within CO2’s absorption/emission band nearly all of the emissions that escape to space are from within the atmosphere, not the Earth’s surface.
But additional CO2 does still have a modest warming effect, at fringe wavelengths, where CO2 absorbs only weakly, by raising the “emission height,” from those emissions that escape to space. At the fringes, the emission height is down in the troposphere, so raising the emission height reduces the temperature at the emission height, which reduces the amount of radiation that escapes to space.
Problem #2. Water vapor is not a well-mixed gas. The very cold upper troposphere is also very dry. Water vapor is concentrated near the surface. That’s the only place where you can find “air at 70° F and 70% RH.”
So even though almost no radiation from the ground escapes to space at the wavelengths where water vapor absorbs and emits strongly, the emission heights from which radiation at those wavelengths does escape are much lower, and hence much warmer, than is the case for CO2. So, in the graph above, the “water vapor notches” (in blue) are much broader than the “CO2 notch” (in green), but the CO2 notch is much deeper.
The bottom line is that the warming effect from anthropogenic CO2 is modest and benign, but it is not zero.
Dave, just to be clear, I agree with this comment.
Has anyone else noticed the lack of any change in the expanded view of the Keeling curve sawtooth as a result of the COVID deindustrialisation? What can be deduced from that?
Economic downturns, like the Covid recession, reduce emissions slightly. But not much. The effects of the Covid-19 pandemic temporarily reduced 2020 CO2 emissions by between 5 and 8%.[2] That small change was dwarfed by the amount by which the rate of anthropogenic CO2 emissions exceeds natural CO2 removals, and also dwarfed by typical year-to-year variability.
This one I don’t agree with. Why are you using annual data when you have monthly and even daily CO2 data to work with?
Clyde, we’re not interested in seasonal fluctuations. Seasonal fluctuations are “noise” for our purposes.
The ongoing annual increase in the amount of CO2 in the atmosphere is not contributed to by CO2 from rotting leaves and grass which grew within the last year or two, and if you include easily excludable noise you’re just making it harder to discern the effect of the “signal” you’re looking for.
The way to eliminate noise is to average over longer periods, not shorter. For example, over the last four years (2020 to 2024) the CO2 level rose at an average rate of (424.61-414.21) / 4 = +2.60 ppmv/year.
To eliminate “noise” due to seasonal factors, we must average over a multiple of 12 months.
Of course, most recessions don’t last four years (thankfully!). In fact, the Covid recession lasted less than a year. If you average over a period longer than the duration of the signal you’re looking for, e.g. a dip due in economic activity which lasted less than a year, then you’ll weaken the “signal” along with the “noise.”
Because elimination of seasonal “noise” requires averaging over at least 12 months, the best we can do, when looking for the Covid recession’s “signal,” is to use annual averages.
Economic downturns do have an effect, but short ones like the Covid recession have a smaller effect than prolonged ones. I can’t see the Covid recession in the CO2 plot, but I can pretty clearly see the 1990-91 recession:
https://sealevel.info/co2.html
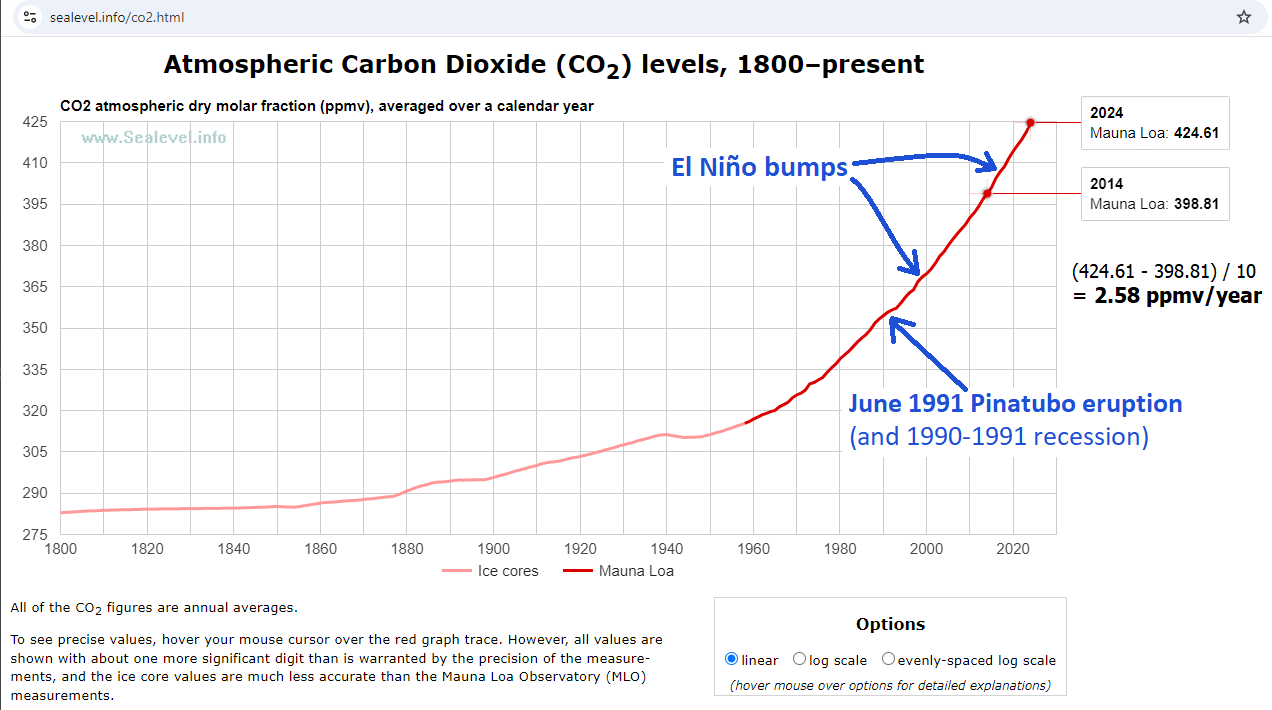
The dip labelled as 1990-91 recession is far more likely to be the consequence of cooling due to Pinatubo (similar to the response attributable to significant La Niña events). Your recommendation of averaging over 12 months reduces the resolution necessary to discern some of these events, but Pinatubo can be identified here (eruption in June 1991):
https://gml.noaa.gov/ccgg/trends/gr.html
According to the Global Carbon Budget, there were only minimal changes to global fossil fuel emissions during the period 1988-1994. Ironically, 1991 was the highest year. Source: Carbon Budget 2024 (Friedlingstein et al., 2024b, ESSD).
You’re right, Jim, that’s pretty clearly Pinatubo. I stand corrected.
Dave, thank you for your response. Much appreciated.
BTW, I would also like to comment on Figure 1.2.3 in the CO2Coalition report of which you were a co-author. As such, you may not have been fully aware of the wholly unscientific and sloppy nature of the figure. Despite quoting a valid reference, it is not the figure from the referenced paper. The original figure has had half of its content removed without any acknowledgement of this major modification as far as I can see. Whether this constitutes malpractice I will leave for others to consider.
Bizarrely, this process also removed the legend for the figure plus the explanatory Figure 1 caption so there was no explanation of the TD, LD or PB abbreviations! Oops.
CDL, maybe this tells the story:
Human CO2 Emissions Flat For a Decade
Annual total global CO2 emissions – from fossil and land-use change – between 2000 and 2021 for both the 2020 and 2021 versions of the Global Carbon Project’s Global Carbon Budget. Shaded area shows the estimated one-sigma uncertainty for the 2021 budget. Data from the Global Carbon Project; chart by Carbon Brief using Highcharts.
Note that “land-use change emissions” contribute disproportionately to that uncertainty interval.
Fossil CO2 emissions are known with reasonable precision (at worse perhaps ±10%). They are calculated from economic data: the amount of coal, oil & natural gas produced and burned.
But the “land use change” figures are from models, and, to put it charitably, they are very approximate.
Mankind is adding 4.7 ± 0.5 ppmv/year of fossil CO2 to the atmosphere, plus 0.5 ±0.3 ppmv/year CO2 from “land use changes” (clearing forests and draining swamps). That increases the amount of CO2 in the air by 4.4 to 6.0 ppmv/year.
The reason that the CO2 concentration in the air is not rising nearly that fast is that natural carbon sinks (mostly terrestrial greening, and marine uptake) are rapidly removing CO2 from the atmosphere.
But those rapid removal processes are not as rapid as anthropogenic CO2 emissions, so the CO2 level continues to rise (by an average of about 2.5 ppmv/year).
Note: the units in that “GCB 2020 vs. GCB 2021” graph are Gt CO2/year.
1 ppmv CO2 = 7.8024 Gt CO2 = 2.1294 PgC.
So, 5.2 ±0.8 ppmv = [5.2 ±0.8 ppmv/yr] × [7.8024 Gt CO2 / ppmv] = 40.6 ±6.2 Gt CO2 / year.
Harold The Organic Chemist Says:
Scroll up way up and read my comment “CO2 Does Not Cause Warming Of The Air.” There is little CO2 in the air. We do not have to worry about it, and there is no need to reduce the use of fossil fuels.
So, considering that atmospheric CO2 turns over in 3.5 years (IPCC), today’s level of nearly 420 ppm means that 120 ppm of inflow is required annually, or 120 +2 ppm if it is to increase as it has been. Where does 122 ppm of CO2 come from? Well, let’s say we can count on 6 ppm of FF CO2 (5%) and the other 116 being non-human emissions.
Ron wrong reasoning… The CO2 level in the atmosphere is not caused by the inflows: even with near zero inflow, the CO2 level would be around 295 ppmv, as that is dictated by Henry’s law for the current average SST.
The 120 ppmv in and out has nothing to do with the CO2 pressure in the atmosphere, but are temperature, sunlight, life dependent. Not pressure dependent.
The meager 5 ppmv/year from human emissions, directly into the atmosphere is what increases the CO2 pressure (pCO2) of the atmosphere, which leads to a total increase of 120 ppmv above the equilibrium with the oceans’ pCO2 and that drives some 2.5 ppmv CO2 extra into oceans and vegetation. The difference of 2.5 ppmv CO2 temporarily remains in the atmosphere…
Kudos Ferdinand, your denial of continuing natural CO2 fluxes is long standing and persistent.
Don’t be silly, Ron. Ferdinand does not deny continuing natural CO2 fluxes, he quantifies them.
Their net sum is negative. That is, nature (the net sum of all natural CO2 fluxes) is decreasing the amount of CO2 in the atmosphere.
I find it disheartening that some people have trouble understanding the simple fact that adding CO2 to the atmosphere (by humans) increases the amount of CO2 in the atmosphere.
It’s really very simple:
Mankind is adding CO2 to the atmosphere.
Nature (the net sum of all natural “carbon fluxes,” positive & negative) is removing CO2 from the atmosphere.
The amount of CO2 in the air is increasing because mankind is adding CO2 faster than nature is removing it.
Why is that so difficult for some people to grok?
Yes, I agree that humans are adding CO2. However, I see you being selective in your use of available data, and in particular, ignoring all the other sources that are increasing. The data are very clear that temperature has more of an influence on CO2 than the approximately constant anthro’ emissions.
Actually, the data show that temperature’s effect on the CO2 level in the atmosphere is much, much smaller than anthropogenic emissions.
Over the short term, temperature and the climate cycles associated with it have a noticeable effect. For instance, ENSO significantly affects the natural CO2 removal rate.
But even the strongest El Niños have less effect on CO2 level than anthropogenic emissions. Even during the 1998 and 2015-16 “Super El Niños” the natural CO2 removal rate was positive, which means that the CO2 level still rose by less than anthropogenic CO2 emissions, showing that nature (the net sum of all natural CO2 fluxes) was still removing CO2 from the air:
If you look very closely at a graph of CO2 levels, you can just barely see the effects of the 1998 and 2015-16 Super El Niños on the CO2 level. But you can’t miss the ongoing effect of anthropogenic emissions, and the business cycle affects the CO2 level at least as much as climate cycles do:
https://sealevel.info/co2.html

I notice that many comments indicate that warm Sea Surface Temps may be the most important cause for atmospheric warming.
Since 95% of the Sea Floor has not been charted in detail, how do we know that under sea volcanoes and thermal vents are not the primary cause of Global Warming?
Thanks in advance for any guidance on this issue.
Steve, there are three major issues on this topic:
1. Is geothermal energy powerful enough to make a difference upon the vast ocean heat capacity?
2. If so, Is geothermal energy variable enough to create temperature differentials?
3. Most of the ocean floor is unexplored, so how much can we generalize from the few places we have studied?
Overview of the research is here:
https://rclutz.com/2016/10/05/overview-seafloor-eruptions-and-ocean-warming/
Steve, underwater volcanoes have a negligible effect on ocean temperatures. They do not significantly heat the water except VERY close to the lava.
Divers can swim very close to molten lava, underwater, because the ocean is such an enormous heatsink. Some people do it for recreation! This video is amazing:
It is a good thing to give humanity credit for adding CO2 into the air, helping the planet to recover from the dangerously low levels of CO2 in the 19th century. But it is mistaken to claim all of the CO2 above 280 ppm came from burning hydrocarbons, or that FF CO2 stays in the atmosphere for half a century or more. Based on isotope analysis comes this picture of the atmospheric history since 1750 AD.
The graph above is produced from Skrable et al. dataset Table 2. World atmospheric CO2, its C‐14 specific activity, anthropogenic‐fossil component, non fossil component, and emissions (1750 ‐ 2018). The purple line shows reported annual concentrations of atmospheric CO2 from Energy Information Administration (EIA) The starting value in 1750 is 276 ppm and the final value in this study is 406 ppm in 2018, a gain of 130 ppm.
The red line is based on EIA estimates of human fossil fuel CO2 emissions starting from zero in 1750 and the sum slowly accumulating over the first 200 years. The estimate of annual CO2 emitted from FF increases from 0.75 ppm in 1950 up to 4.69 ppm in 2018. The sum of all these annual emissions rises from 29.3 ppm in 1950 (from the previous 200 years) up to 204.9 ppm (from 268 years). These are estimates of historical FF CO2 emitted into the atmosphere, not the amount of FF CO2 found in the air.
Atmospheric CO2 is constantly in two-way fluxes between multiple natural sinks/sources, principally the ocean, soil and biosphere. The annual dilution of carbon 14 proportion is used to calculate the fractions of atmospheric FF CO2 and Natural CO2 remaining in a given year. The blue line shows the FF CO2 fraction rising from 4.03 ppm in 1950 to 46.84 ppm in 2018. The cyan line shows Natural CO2 fraction rising from 307.51 in 1950 to 358.56 in 2018. Note that FF CO2 was insufficient to grow the CO2 fraction in air prior to about 1960. Note also that natural sources of CO2 continue to exceed CO2 emissions from human activity.
The details of these calculations from observations are presented in the two links above, and the logic of the analysis is summarized in my previous post On CO2 Sources and Isotopes.
Ron, you did not take into account in your calculations that a large part of the original FF CO2 molecules in the atmosphere were exchanged (not simply removed) with CO2 molecules from other reservoirs.
If all FF emissions remained in the atmosphere, the increase of CO2 mass would be twice as high than observed and the decrease in δ13C three times what is observed.
That allows us to calculate how much (deep) ocean CO2 is circulating through the atmosphere:

With about 40 PgC/year deep ocean exchange (at average -6.5 per mil δ13C), the reduced drop in δ13C can be explained, where all the drop in δ13C still is caused by FF emissions…
Ron,
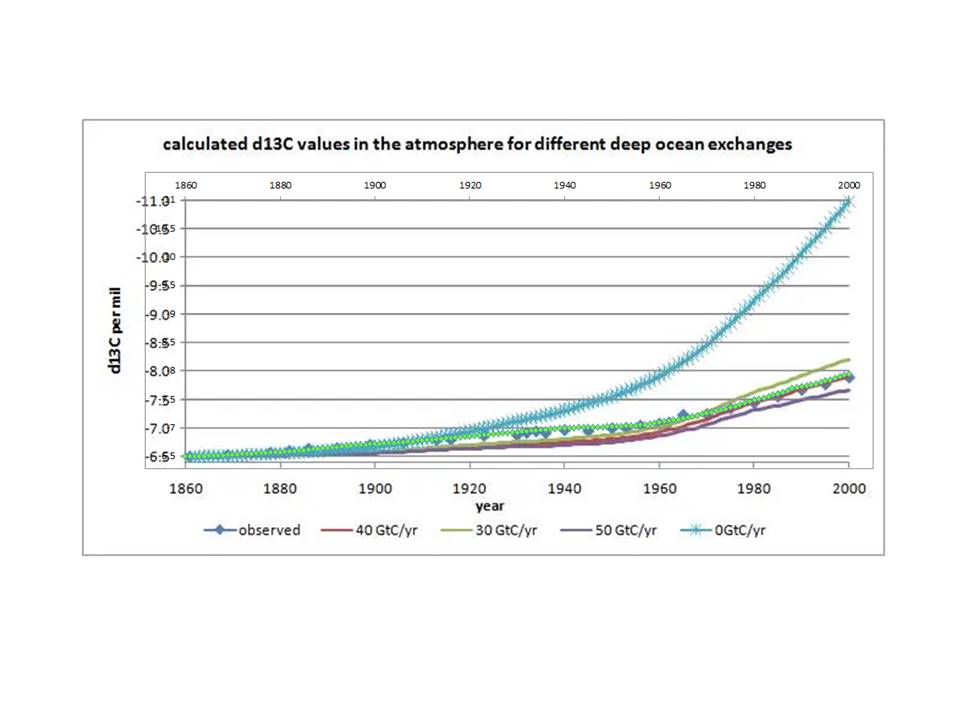 .
.
In the case of Ferdinand’s model, it is clear that it (the red line on the plot below) fails because it does not match observations at any time starting from soon after the fixed start date in 1860 through to about 1980. On the other hand, the assumption of a constant net δ13C of -13‰ for the incremental atmospheric CO2 throughout the whole period does a far superior job at matching the observations (the green diamonds, which I computed using only published CO2 values, a starting δ13C value of -6.5‰ and -13‰ for all the incremental CO2 thereafter). I then plotted the graph at a scale to match and overlay his plot:
My determination of constancy of net δ13C over the period shown (based on isotopic mass balance equations) has been independently validated by Demetris Koutsoyiannis (https://doi.org/10.3390/sci6010017).
Jim, thanks for making connection to that Koutsoyiannis paper. From the abstract:
Recent studies have provided evidence, based on analyses of instrumental measurements of the last seven decades, for a unidirectional, potentially causal link between temperature as the cause and carbon dioxide concentration ([CO2]) as the effect. In the most recent study, this finding was supported by analysing the carbon cycle and showing that the natural [CO2] changes due to temperature rise are far larger (by a factor > 3) than human emissions, while the latter are no larger than 4% of the total.
Here, we provide additional support for these findings by examining the signatures of the stable carbon isotopes, 12 and 13. Examining isotopic data in four important observation sites, we show that the standard metric δ13C is consistent with an input isotopic signature that is stable over the entire period of observations (>40 years), i.e., not affected by increases in human CO2 emissions. In addition, proxy data covering the period after 1500 AD also show stable behaviour.
These findings confirm the major role of the biosphere in the carbon cycle
and a non-discernible signature of humans.
Sorry, but there is not such a “constant” source of δ13C at -13‰. It simply doesn’t exist. As good that there is no “fixed” airborne fraction of CO2 in the atmosphere at about half human emissions. Both are the result of the steady, near-linear increase of FF emissions…
You have a known, measured, increasing source of -25‰ δ13C human FF emissions and you have a rather constant dilution of that FF “fingerprint” by the deep ocean exchanges of around 40 PgC/year at -6.5‰ δ13C plus a variable sink/source of between +24‰ and -24‰ δ13C for plant uptake or release.
The latter is what caused the deviation from the FF/deep ocean mix: a small net source of CO2 before 1980 and a small, but increasing sink after 1990.
See: https://www.science.org/doi/abs/10.1126/science.287.5462.2467
and more recent:
http://www.bowdoin.edu/~mbattle/papers_posters_and_talks/BenderGBC2005.pdf
There are more recent investigations on the role of plant uptake, but I haven’t located them yet.
From the first reference:
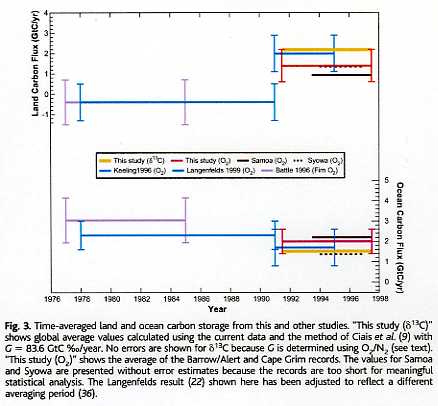
If you think that there is “constant” source of δ13C at -13‰, please show me where and what and also show me what happened then with the FF emissions…
BTW, Koutsoyiannis calculations violate the carbon mass balance… And he doesn’t see the difference between a cycle and the one-way supply of FF.
As most natural fluxes are just cycling in and out, only the net result of all these natural cycles is important, not the height of the cycles, nor how these changed over time. All what counts for the increase or decrease of CO2 in the atmosphere is the net difference between sources and sinks: Since at least 1958 more sink than source, thus removing CO2 out of the atmosphere…
Ron,
Ferdinand says:
“Sorry, but there is not such a “constant” source of δ13C at -13‰. It simply doesn’t exist.”
I said: “constant net δ13C of -13‰ for the incremental atmospheric CO2”. Spot the difference: the key is in the word “net”. In the comparison above between his rather poorly fitting model and one based on a “constant net δ13C of -13‰ for the incremental atmospheric CO2”, the latter one clearly does a better job. Why is this fact problematic?
Both 13C and 12C are stable isotopes and therefore both must separately satisfy mass balance principles. The mass balance equations for 13CO2 lead to a very useful plot known as the Keeling Plot (not to be confused with the Keeling Curve though the same originator), where atmospheric δ13C (in CO2) is plotted against the reciprocal of atmospheric CO2.
A moderately good reference on Keeling Plots (I do have reservations about some of the content), which includes the relevant mass balance equations can be found here (pdf): https://bg.copernicus.org/articles/3/539/2006/bg-3-539-2006.pdf
The basic concept is that a linear relationship between 1/CO2 and δ13C indicates a constant value for the net δ13C of the incremental CO2 and this value is given by the intercept of the plot. Figure 1 in the referenced paper validates the relationship for the Law Dome data, giving a net δ13C value of -13.1‰ with r^2 of 0.96.
The linearity of the line means that the net δ13C value is not changing over time. The net effect means that all source/sink/fractionation effects on the atmospheric content are incorporated in the final relationship. The plot does not tell us anything about the inter-relationship between source/sink/fractionation effects, but for one key aspect. It tells us that the figure is not changing over time, a fact highlighted by my version of Ferdinand’s model. This is a key constraint on ANY model seeking to replicate the atmospheric δ13C data.
I should add that I do believe that there are fluctuations in the δ13C data over the short term so you need to be looking at period of a few years or more to obtain the longer term trend. These short term fluctuations reflect the impact of significant El Niño and La Niña events.
Jim, what does a “constant” net input of -13.1‰ imply? Nothing of interest.
Koutsoyiannis says that it is caused by the biosphere, which would imply that a lots of forests are lost in the past decades, while the oxygen balance shows that there is a net, increasing uptake of CO2 by the biosphere. The earth is greening. That increases the 13C/12C ratio of the atmosphere, thus can’t be the cause of the δ13C drop.
All other inorganic sources, including the (deep) oceans, volcanoes, carbonate rock weathering,… increase the δ13C level, while we see an enormous drop in δ13C, completely in parallel with FF emissions since 1850.
Thus there doesn’t exist a constant “net” or “total” source of low-13C, only an increasing delivery of very low 13C FF CO2. Which isotopic fingerprint gets diluted mainly by high-13C deep ocean waters. The variability around that trend caused by the variability of the uptake/release of vegetation. As good as that is the case for the increasing CO2 level itself.