From Dr Roy Spencer’s Global Warming Blog
by Roy W. Spencer, Ph. D.
The Version 6.1 global average lower tropospheric temperature (LT) anomaly for May, 2025 was +0.50 deg. C departure from the 1991-2020 mean, down from the April, 2025 anomaly of +0.61 deg. C.

The Version 6.1 global area-averaged linear temperature trend (January 1979 through May 2025) remains at +0.15 deg/ C/decade (+0.22 C/decade over land, +0.13 C/decade over oceans).
The following table lists various regional Version 6.1 LT departures from the 30-year (1991-2020) average for the last 17 months (record highs are in red).
| YEAR | MO | GLOBE | NHEM. | SHEM. | TROPIC | USA48 | ARCTIC | AUST |
| 2024 | Jan | +0.80 | +1.02 | +0.58 | +1.20 | -0.19 | +0.40 | +1.12 |
| 2024 | Feb | +0.88 | +0.95 | +0.81 | +1.17 | +1.31 | +0.86 | +1.16 |
| 2024 | Mar | +0.88 | +0.96 | +0.80 | +1.26 | +0.22 | +1.05 | +1.34 |
| 2024 | Apr | +0.94 | +1.12 | +0.76 | +1.15 | +0.86 | +0.88 | +0.54 |
| 2024 | May | +0.78 | +0.77 | +0.78 | +1.20 | +0.05 | +0.20 | +0.53 |
| 2024 | June | +0.69 | +0.78 | +0.60 | +0.85 | +1.37 | +0.64 | +0.91 |
| 2024 | July | +0.74 | +0.86 | +0.61 | +0.97 | +0.44 | +0.56 | -0.07 |
| 2024 | Aug | +0.76 | +0.82 | +0.69 | +0.74 | +0.40 | +0.88 | +1.75 |
| 2024 | Sep | +0.81 | +1.04 | +0.58 | +0.82 | +1.31 | +1.48 | +0.98 |
| 2024 | Oct | +0.75 | +0.89 | +0.60 | +0.63 | +1.90 | +0.81 | +1.09 |
| 2024 | Nov | +0.64 | +0.87 | +0.41 | +0.53 | +1.12 | +0.79 | +1.00 |
| 2024 | Dec | +0.62 | +0.76 | +0.48 | +0.52 | +1.42 | +1.12 | +1.54 |
| 2025 | Jan | +0.45 | +0.70 | +0.21 | +0.24 | -1.06 | +0.74 | +0.48 |
| 2025 | Feb | +0.50 | +0.55 | +0.45 | +0.26 | +1.04 | +2.10 | +0.87 |
| 2025 | Mar | +0.57 | +0.74 | +0.41 | +0.40 | +1.24 | +1.23 | +1.20 |
| 2025 | Apr | +0.61 | +0.77 | +0.46 | +0.37 | +0.82 | +0.85 | +1.21 |
| 2025 | May | +0.50 | +0.45 | +0.55 | +0.30 | +0.15 | +0.75 | +0.99 |
The full UAH Global Temperature Report, along with the LT global gridpoint anomaly image for May, 2025, and a more detailed analysis by John Christy, should be available within the next several days here.
The monthly anomalies for various regions for the four deep layers we monitor from satellites will be available in the next several days at the following locations:
Better late than never..
While we’re on the topic I want to mention that I really hope Dr. Spencer and Dr. Christy are able to “pass the torch” on to someone else to keep the UAH updates coming. Dr. Spencer has mentioned in the past that funding and retirement issues are things that need to be ironed out in the not too distant future.
Dr. Spencer, I thank you for your pioneering work in the satellite temperature space and your dedication in keeping the updates coming. I may not agree with you all talking points, but that doesn’t mean I can’t give credit where it is due. And it is definitely owed to you in this regard.
Third warmest May since 1979, not quite beating the 1998 outlier.
Ten warmest Mays:
My simplistic projection for 2025 creeps up another 0.01C. Now 0.49 ± 0.13°C. There’s now an 80% chance that 2025 will be warmer than 2023.
And not one bit of evidence that human CO2 has anything to do with the “now cooling” trend after the non-CO2 El Nino event.
Updating the two so called pauses.
Pause 1 started January 1997. The current trend starting that date is 0.17 ± 0.11°C / decade.
Pause 2 started September 2015. The current trend from that date is 0.34 ± 0.56°C / decade.
NB, uncertainties in the trend are 2 sigma, and include a correction for auto-correlation based on the Skeptical Science Trend Calculator.
My May was cold but I am assuming you use other thermometers 😉
It’s not my data. If you have a problem with the satellite data take it up with Spencer and Christy.
Still “My” May was very warm for the most part, and set a record for average maximum temperatures.
Here’s my map using the gridded data for May
Compared to last month
there seem to be fewer extremes and Eastern Europe has cooled down.
Here’s the average over the last 2 years. Note the scale is different in order to show more detail.
It’s interesting that the highest anomalies have been over Tibet and the Andes, both high altitude regions.
Are the oceans boiling yet?
Why was it the third warmest May since 1979?
Because only May 1998 and May 2024 were warmer.
You misunderstand the question. Lift your gaze from your navel and try harder.
Why?
I am simply asking what caused this latest anomaly. Not difficult to comprehend.
What do you think caused it?
ENSO is neutral.
OMG , you really think all that El Nino energy release just disappears overnight.
You have just totally destroyed any mythical CO2 warming nonsense with that one comment !
It’s had a year, after previous events that’s been sufficient.
That is the interesting point. The El Nino-associated warming peaked in April 2024. I and others have commented previously that the usual rapid post-El Nino decline hasn’t happened. Some have speculated that the Hunga-Tonga eruption put a lot of water vapor into the stratosphere, which has acted like thermal ballast to slow the decline. I don’t think that anyone has made a compelling case as to why the Full-Width Half-Maximum of the last El Nino temperature spike is larger than usual. However, it does appear to me that a contributing factor to the ‘anomalous’ May temperature is that the decline has been uncharacteristically slow.
The decline seems to be coincident with the ENSO cycle to me. I know in 2024 we were all discussing how the latest El Nino spike seemed to be 1) a bit earlier than expected and 2) bit more amplified than expected. But with UAH switching from v6.0 to v6.1 in November of last year the profile of the spike falls largely within expectations now. In fact, only one of the monthly anomalies now falls outside the 2σ envelope of my model. I guess what I’m saying is that I can’t tell that there is anything unusual about this ENSO cycle. I do concede that the anomalies are running a little above the center line of my model right now, but again that’s not unusual for there to be extended periods when it runs slightly higher/lower than the expectation.
Are you referring to the amplitude or width of the spike?
Both.
Exactly, the global cooling that normally happens following an El Niño event hasn’t happened but in the ENSO region the usual cooling has occurred. To attribute the delay in global cooling to the previous El Niño event requires an assumption without any supporting data.
Why indeed? Did CO2 concentration take a nosedive? Did cloudiness increase tremendously?
If you don’t know the reason for cooling, you can’t possibly know the reason for warming!
+42 if I could, but I’m only allowed 1.
“Because only May 1998 and May 2024 were warmer.”
Both of those were from El Nino events too.
Well the current temperature is not an El Niño event, it transitioned to ENSO neutral in May 2024 and briefly to La Niña in late 2024.
Look at the temperature data, its it is still part of a slowly dissipating El Nino event.
The temperature went up as is usual in an El Niño but has not followed the usual decline after the El Niño ended that implies some other event interfered with the ENSO cycle.
That is the funniest thing I’ve read all week.
“Third warmest May”
Forgive my lack of understanding, but do you mean ‘third warmest’ or instead ‘greatest positive anomaly relative to the climatological mean for May’?
Perhaps it’s the same thing, but I don’t think so. Thank you.
No, it is the same thing.
The average global temperature for May 2025 was the third warmest for all Mays in the UAH record. Expressing it as an anomaly is just a convenient way of formatting it, which is why UAH uses anomalies (as does everyone else)..
Third warmest in 45 years, at the end of a very strong and persistent El Nino event
Still ZERO evidence of any human causation.
Nearly all the last 10,000 years were warmer than current tepid temperatures.
We’re not in an El Niño event, that ended about a year ago, currently it’s neutral.
The energy released from the El Nino event still persists.
Nearly all the last 10,000 years were warmer than current tepid temperatures.
There is no basis for attributing the current temperature to persistence of the El Niño event.
Just as there’s no basis for your repeated assertion about the last 10,000 years, Doggerland existed at the beginning of that period indicating substantially more ice on the planet. As does the existence of the Cantre’r Gwaelod forest off the Welsh coast which was submerged about 4,500 years ago. Also the little Ice Age was about 500 years from ~1300-1850AD.
It took time for ice sheets to melt. More ice doesn’t mean it was colder during the Holocene Optimum, c. 8000 to 5200 years ago.
A pattern of temperature observations contains no energy at all. You are confused. Or possibly ignorant and gullible.
And how much of the warming is attributed to UHI?
It’s satellite data. It shouldn’t be affected by UHI bias.
Have you finally lost it? UAH measures air temperatures. Air temperatures ARE affected by UHI. Maybe you have a study confirming that UHI has no effect upon temperatures measured by satellites.
Maybe you could get Spencer to do a new study on the effects of UHI on UAH data. In the meantime, I’ll quote WUWT own page on UAH
https://wattsupwiththat.com/uah-version-6/
The claim about UHI effects on global surface temperature is that it biases the data due to stations being predominantly sited near urban areas. Satellite data should not have this problem as it looks on the earth at regular intervals, so there is no bias towards urban areas.
The data is still collected partly from above rapidly growing urban regions.
You would have to be particularly thick not to realise this has at least some effect on atmospheric temperatures.
It would be very interesting to compare the total global urban area/density in 1979 to what it is now.
No, urban areas result in more heat due to more people, thus eventually raising global average temperatures. Fairly obvious, unless you happen to be ignorant and gullible.
Are you trying to convince folks that UAH has no UHI bias?
First, hot air rises, there is no reason that UAH can’t detect higher temperatures from UHI.
Secondly, AVERAGING UHI biased stations with more rural stations DOES bias the average to a higher value than it should be.
Lastly, why fo you think NOAA created the CRN network of stations? It wasn’t because UHI was corrected for by calculating averages.
“Are you trying to convince folks that UAH has no UHI bias?”
I doubt I could convince you of anything. But it is one of the main selling points of satellite data, that it should not have the same during issues of surface measurements. The satellite s an the surface of the earth equally rather than focusing on cities.
“First, hot air rises, there is no reason that UAH can’t detect higher temperatures from UHI.”
I’m not sure you understand what bias means. If earth from cities has any appreciable effect on the LTL global temperature, then the satellite data is not biased by it. They are recording the actual temperature of the atmosphere regardless of the source. If cities really are warming the globe than that is a source of anthropogenic global warming.
In reality I doubt if much or any of the observed warning is caused by cities. They are just too small a part of the globe.
“Secondly, AVERAGING UHI biased stations with more rural stations DOES bias the average to a higher value than it should be.”
Again, UAH is not using station data. It’s entirely based on satellite MSU. And nobody is claiming that averaging station data removes the UHI bias. That’s what bias means.
“Lastly, why fo you think NOAA created the CRN network of stations?”
Because there was a period on American history when it was considered a good idea to monitor the countries climate using the best available instruments.
You have no clue do you? Your hand waving answers nothing.
Think of an infrared picture of a region. Do you think hot temperatures of cities don’t show up?
So you don’t believe UHI has no effect on UAH. Why am I not surprised you have no evidence.
And exactly how do you think the MSU develops an AVERAGE temperature for a region? You are hand waving when you really know nothing about remote sensing.
And those best available instruments are located at airports and city centers, right? Guess again.
From NOAA,
“You have no clue do you?”
The first clue is that you start every comment with an ad hom insult. The second is you keep misunderstanding or ignoring any argument I make.
“Think of an infrared picture of a region.”
Firstly, the satellites are not measuring infrared, they are measuring microwave radiation coming from oxygen molecules in specific regions of the atmosphere. Secondly, you keep missing the point. UHI is only biasing the data if you are taking a disproportionate amount of data from the islands. If cities are genuinly producing enough heat to effect the global temperature then that is not a bias.
“So you don’t believe UHI has no effect on UAH.”
You’re just making stuff up now. I believe that UHI has little to no effect on the satellite data, or I don’t believe it has a significant effect. The exact opposite of what you’ve just claimed I said.
“And exactly how do you think the MSU develops an AVERAGE temperature for a region?”
I couldn’t give you an exact description, you would have to decipher Spencer’s explanation if you want the details. But I can say it does not use surface station data. If you disagree you need to provide evidence it does.
“And those best available instruments are located at airports and city centers, right?”
No, why on earth would you think that? That’s one of the benefits of the CRN project. The careful placement of stations to avoid land use changes.
Here’s my map showing the rate of warming up to April.
I see no obvious sign that urban areas are causing increased warming.
I think you are confusing the UHI effect with the UHI bias. Those are different, albeit related, concepts.
The UHI effect is the phenomenon by which urban land use changes result in higher temperatures. It is a real effect.
The UHI biases is the error introduced into a spatial average as a result of sampling urban and rural disproportionately. It is not a real effect, but an artifact of the methodology used.
UAH does not have any significant sampling bias that would cause it to disproportionately sample urban vs rural areas or otherwise use urban/rural areas as proxies for rural/urban areas like is the case with traditional surface based datasets that disproportionately sample urban areas. Therefore UAH, unlike traditional surface based datasets, is mostly immune to the UHI bias.
If UHI really is having a significant effect in the TLT layer and if UAH really is detecting it then that’s a good thing. If UAH couldn’t detect it then it would mean that UAH is underestimating the warming since UHI warming is real.
Handwavving hoping no one sees behind the veil! Not a real effect? The temperatures caused by UHI are real, not artifacts.
Sampling disproportionately? You have defended area weighting in the past. Is that no longer the case?
More hand waving. You don’t point to a single source that says UAH is immune to UHI increased temperatures.
Which is exactly what I said.
Of course it is still the case. It is one of the ways that a methodology can mitigate sampling disproportionately.
First…I didn’t say it was immune from UHI increased temperatures. What I said is that it is mostly immune to the UHI bias. Remember, the bias and the effect are two different concepts.
Second…I cite their methodology publications all of the time. For example start with [Spencer & Christy 1992].
Really.?? !! Are you saying that UHI warming, easily measured and observed by satellites, doesn’t rise into the troposphere.
What a bizarre concept !!
UAH trend over land is about 1.5 times ocean trend.
Expressing it as an anomaly is just a convenient way of making small, meaningless variations look big and scary.
No it’s a way of showing the change in tropospheric temperatures since the measured temperature is less than 0ºC.
??? I guess you’re way smarter than me, but that doesn’t even make sense.
The average temperature at the tropopause is about -60ºC so when UAH calculates the LT temperature between 10km and the surface it will be less than 0ºC which won’t have much meaning to the people reading it so they report the monthly anomalies instead. Showing a lower troposphere increase from the average of 0.9ºC is more meaningful than saying it’s -21.0ºC compared with -21.9ºC.
Meaningless word salad.
As stated by Spencer the UAH LT temperature is measured at about 4500m altitude, by the US standard atmosphere that would be approximately -14ºC so if they were to report the measured temperature it would probably be about -13ºC. They chose instead to report the anomaly.
More completely irrelevant word salad.
What are you trying to imply? That the surface hasn’t really cooled over the past four and a half billion years? That you are ignorant and gullible enough to deny that adding CO2 to air does not make it hotter?
Try harder. You’re not very convincing so far.
Everyone? Nope.
Average global temperature? Nope.
“do you mean ‘third warmest’ or instead ‘greatest positive anomaly relative to the climatological mean for May’?”
When looking at specific calender months they are the same. Each anomaly is just temperature minus a base temperature, and the base temperature is a constant for the month.
It was a 0.11°C drop from April, but still the third warmest May in the record, just behind 1998.
Surface temperature (TempLS) showed the same drop, 0.105°C, and was the second warmest in the record. Here is the map, relative to base 1991-2020:
First five months of 2024 averaged 0.86 C anomaly. First five months of 2025 averaged 0.53 C. Global cooling with a vengeance!
Here is the stacked plot of months. 2024 was the warmst year in the record, and Jan-May was a peak period. As Bellman said, 2025 will probably not be as warm as 2024, but is likely to come second, ahead of 2023, and way ahead of anything earlier.
Nick, do you have a key to your chart? Or do you just like using crayons?
The key is at the top. Each year has a color. The numerical values are given by the y axis. So May, in 2025 (dark blue) was 0.9C, ahead of 2020 (lime green).
Pretty, and completely without any utility. Historical fact is obviously fact.
Nothing new about that at all.
So why is black sometimes above pink and sometimes below? And why is blue between black and pink in the annual column? And why are some of the colours much stronger chromatically than others eg black v beige?
Temperatures vary. 2025 is blue, and is currently running between 2023 and 2024. I chose black for 2024 because it was then the current year.
Nick, your explanation makes no sense and does not even attempt to answer the question on chromatics.
Thanks for the “pretty” but gaudy picture showing the effect of the now-declining 2023/24/25 El Nino event.
It really is easier to see on a basic year by year line graph though.
We have no idea how much further the anomaly will drop this year.
2023 had 7 months affected by the El Nino/HT event
2024 had 12 months effected by the El Nino/HT event
2025 has had 5 month so far that are still obviously affected by the now-declining El Nino/HT event
.
Why was 2024 the warmest year in the record?
I also have a follow-up question….
Why did it rain the other day?
It was warmer than 2023, which was a lot warmer than 2020, which was a little warmer than 2016, which was warmer than any other year back to 1900. The world is getting warmer. And yes, there is a reason for that.
Why is the world getting warmer, Nick?
We’re coming out of the Little Ice Age. It’s very simple. No need to spend trillions to research what Nature does and always has.
Not just so simple, though.
If it’s all just about ‘coming out of the LIA’, then how come there was global cooling over the first ~50 years of the global record, from 1880 to 1930s? (First ~80 years, if you start in 1850 per HaDCRUT and Berkeley, etc.)
FAKED urban affect surface data.
Totally MEANINGLESS as a global temperature measurement.
Reality is that many unadjusted and pristine site show the 1930s warmer than the 2000-2020 period.
Why was there “global warming” from about 1900 to 1940? You conveniently ignored that.
The open season at the coal port in Spitsbergen (Svalbard) went from 3 months of the year before 1920 to over 7 months of the year by the late 1930s – considerable warming phase!
The following IPCC graphic explains the warming/cooling for any period (after 1750) that you are interested in.
Interesting graph, thanks. Kinda complicated, at least to me, but I think I get the gist of it. Might be oversimplistic, but looks like the ~1900-1930/40 warming was due to a downward blip in tropospheric aerosols. Not being alive at that time, not sure what that is attributed to.
Nick, the world is warmed by El Nino’s, not CO2, or man. We have had far too many pauses in the data, when the world should have warmed according to your theory, but it didnt. When the oceans warm, the evaporated water forms clouds, which block the sun. Willis’ thermoregulatory effect. Surely if CO2 warms the oceans, then that moisture will form clouds as well. Nick, read Bob Tisdale’s book, as well as Willis Eschenbach’s work. Remember the Moncton pauses.
Don’t think so. A pattern of temperatures doesn’t warm anything. Just like climate doesn’t influence weather.
CO2 doesn’t warm oceans, either.
Is it not cooled by La Nina’s?
The theory matches the pause-up-pause-up pattern pretty well. I present the broader theme of the theory in graphical form to make it easier for people to see what is going on here.
Global warming does result in a higher specific humidity. But specific humidity is not what modulates clouds; at least not by itself. Clouds are actually modulated by relative humidity which is decreasing.
Yes. Yes. We’re all aware of Monckton pauses. They’ve been predicted ever since GCMs showed that they were far from rare, but actually quite common. And many of us had been warning Monckton that his most recent pause would eventually end starting a new leg up that itself would end with yet another new pause in a pause-up-pause-up pattern almost exactly like what theory predicts. And since Monckton has ghosted WUWT I’ve made it a point to update everyone on this new pause.
ENSO is an oscillation; it contributes to exactly as much global cooling as global warming over the longer term.
It therefore does not explain the observed long-term warming trend (otherwise someone would have noticed by now)..
Again you show you do not understand what El Nino is and what drives it….
Hint.. it is NOT CO2, but it is the only warming in the UAH data.
You have still totally failed to show any warming in the UAH data that is not associated wit major El Nino events.
You managed a down-tick.. well done.
You have still totally failed to show any warming in the UAH data that is not associated wit major El Nino events.
Do you have a source that supports that assertion? What I have observed is that during the El Nino phase, there is a narrow spike in global temperature and it doesn’t come back down to the pre-event temperatures. Instead, the temperatures bumble along until the next El Nino. One might interpret that as having the system disturbed, such as by episodic submarine vulcanism, and not dissipating all the heat, so that long-term it accumulates. I would be interested in seeing an analysis that demonstrates that long-term the two states ‘exactly’ balance.
La Nina is a build up.. El Nino is a release event..
It is NOT a strict oscillation, and certainly NOT regular.
It’s the sort nonlinear oscillation to be expected in a chaotic system.
Quasi-periodicity. Never exactly repeating, and unpredictable. Useless.
“which was warmer than any other year back to 1900″
Sorry, but we don’t have the data to say that..
Many places in the NH have raw data that shows the 1930s at a similar or above temperature to the 2000- 2020 period.
Near pristine longer-term sites like Valentia show the same thing.
And there is no way you can disentangle all the massive urban warming and bad sites and data manipulation from the surface station fabrications to have any certainty whatsoever about that statement.
Well said.
In any case, GAT is an absurd, non-physical metric for climate.
Unless there’s another super El Niño or two and massive submarine eruption, 2015-24 should prove warmer than 2025-34.
Nope. Dust Bowl.
Don’t be completely detached from reality. The Earth loses about 44 TW. More energy out than in.
That’s called cooling, by non-fantasists.
As you’ve been told before that is incorrect. The solar irradiance on the Earth is ~173,000 TW at the top of the atmosphere of which about 30% is reflected back into space and the remainder is absorbed by the planet and atmosphere. The Earth’s surface also receives about 47 TW of geothermal energy from the core, about half of which is due to radioactive decay. To maintain a constant temperature the Earth would have to lose about 120,000 TW to space, not 44 TW!
Phil, you wrote –
and of course it does!
Otherwise, the Earth could not have cooled over the last four and a half billion years. As Fourier said, the Earth loses all the heat it receives from the sun to outer space, plus a little bit of internal heat.
You are certainly in denial of reality, if not also ignorant and gullible.
Have you accepted that adding CO2 to air does not make it hotter, yet?
GHCN is NOT a measurement of the real surface temperature.
Way too many of the surface sites are totally unfit-for-purpose to give anything remotely close to the real surface temperature.
And in 1991, there were far too few and scattered accurate enough ocean measurements to give anything realistic.
Why was it the third warmest May in the record?
Here is the map, relative to base 1991-2020:
Your map and UAH have some major differences.
Norther U.S. and Canada, let’s call it Arctic. Your map +3, UAH +0.75
Australia Your map +0, UAH +0.99
One could conclude that there is a large uncertainty in what the ΔT actually was.
Blasphemy! You can’t discuss uncertainty with true believers of the dogma of the church of global warming.
+1000
“there is a large uncertainty in what the ΔT actually was.”
It isn’t the same ΔT. One is surface, the other is troposphere centered at 4 km altitude.
Yet the ΔT’s indicate warmer and cooler regions. The regional variations do not match. You haven’t explained why. Your handwaving does not include any information.
Where did the surface numbers for the SH oceans come from?
UAH 6.0 shows almost half a century with an average 0.15 C/decade warming in the lower atmosphere that is consistent with all other satellite and radiosonde products. IIRC, that trend is quite a bit less than those of the governments’ ‘estimates’ of combined land and water temperature trends over that period. However, politicized UN IPCC and other governmental agencies use the inaccurate surface temperature products to tune their already inaccurate and hot-running CliSciFi climate models, to which they flog with absurd projections of human CO2 production. To get the estimates of the scenario providers we would have to burn all of the identified coal reserves, plus some.
IPCC AR4 (2007) projected a warming of +0.2C per decade for the next 2 decades.
Since 2007, the warming rate in UAH is presently +0.3C per decade.
So I guess you could say that so far the IPCC have got it wrong – on the cool side.
Since 2007 there have been two rather strong El Nino events.
There was cooling between those events
So where’s the evidence that is has anything to do with human released CO2 and not just increased absorbed solar, less-cloud, enhanced El Nino events.
In the complete absence of anything else remotely scientific…
… it seems those El Nino events are the only cause of the atmospheric warming
Why is the warming rate presently +0.3C/decade?
GHG emissions.
So what if in a few months the rate is +0.2C/decade. Would that be GHG emissions which cause that?
Unlikely.
I see. So according to you, the increase in CO2 concentration had the power to lift the ”warming rate” to the current level but does not have the power to hold it there.
Is that it?
No, it would require a large drop over the next few months to reduce the average slope over the last decade by 33%!
CO2 has no warming power at all. Heat does.
So, you have a penchant for asymmetrical hypotheses? Heads I win, tails you lose?
Maybe you could expand. Certainly adding “GHG emissions” to air does not make it hotter.
Have “GHG emissions” some supernatural energy creating properties?
That would be religious belief, not science.
Of course it does, the IR energy absorbed by the GHG is transferred to the surrounding gas molecules thereby increasing their kinetic energy and hence the average gas temperature!
And of course, at night the opposite applies, and the atmosphere cools. Fourier said that all the energy that the Earth receives from the Sun is lost to outer space. Hence, four and a half billion years of sunlight has allowed the surface to cool.
What you said is misleading, but that’s typical for GHE cultists.
Adding CO2 to air does not make it hotter. There is no GHE.
Sorry about that. I know it conflicts with your religious beliefs.
“And of course, at night the opposite applies, and the atmosphere cools.”
No it does not, the IR is still emitted by the Earth’s surface at night and is still absorbed by the GHG and transferred to the rest of the atmosphere.
Yes it does. The surface cools at night, but you may not have noticed it.
Sorry Nick, but there is no evidence of warming by GHG emissions in the UAH data.
If you think there is, then please show us the warming that is NOT associated with major El Nino events.
H2O is by far the largest GHG. Is there some measure available that tallies the amount of anthropogenic H2O that is being emitted?
CO2 receives the most blame. Yet ENSO and UHI play a part in the temperature rise. Why do you not recommend changing UHI by depopulating the cities?
Sorry Jim, but adding H2O to air doesn’t make it hotter.
Actually, the hottest places in the world have the least H2O in the air above them.
As do the coldest places. The same laws of physics apply in both places.
This may be pedantic, but UAH is now up to version 6.1. If you’ll remember in version 6.0 it was originally reported that 2024/04 came in at 1.05 C. But with the 6.1 release appearing in November of 2024 this got adjusted down to 0.94 C.
What would you expect if the method of calculation is updated? I’d kind of expect the numbers would change a bit. What’s your point?
I’m not sure of bdgwx’s point (though I didn’t downvote him). The fundamental point I take is that they are just what you said, NUMBERS! They are not temparatures in any way, shape or form. Rerunning or changing the models will change the numbers. And to conflate model generated numbers with actual temperatures as the warmists do is just nuts.
UAH TLT is the monthly global average temperature in a thick layer of the troposphere from the surface up to about 14 km with the weighting function peaking at about 4 km. The units are in kelvin so it is definitely a temperature. [Spencer et al. 2017]
Correct. That was part of my point.
All measurements require model generated numbers. The JCGM group even has a lengthy guide documenting standards and techniques for developing measurement models in the field of metrology. [JCGM GUM-6:2020]
And specifically related to temperature even a spot temperature requires a model of some kind. For example, PRTs often use the Callendar-Van Dusen or similar models The model in widespread use today is documented in ITS-90. As you can see the model complex.
The information in ITS-90 is comprehensive. However, it does not cover the capabilities of field measurements under field conditions.
NOAA has issued official documents that provide the uncertainty that should be used for field measurements.
For ASOS, the following table applies.
For CRN, the following table applies.
These are far above the calibration values of the PRT sensor. Field measurements have a multitude of influence quantities that affect each measurement. See if you can list some.
My point is that UAH is no longer using version 6.0. They are now using 6.1 which dropped the anomalies later in the period by around 0.1 C.
Did it raise others? And were the changes justified in any way? Or should they just have stayed with v 6.0? Or 5.0? Or 1.0?
As is the case anytime an adjustment is applied to fix a bias, error, and/mistake the adjustments included in v6.1 and other previous versions are justified.
Its called science, based on know issues with the satellites.
Totally unlike the random, agenda-driven, haphazard and massively biased ” adjustments” made to create warming trends in the totally unfit for purpose surface data.
The Monckton Pause extends to 24 months starting in 2023/05. The average of this pause is 0.67 C. The previous Monckton Pause started in 2014/06 and lasted 107 months and had an average of 0.21 C. That makes this pause 0.46 C higher than the previous one.
The trend since 1979/01 is very close to ticking up to +0.16 C.decade-1. If the June about comes in at 0.4 C or higher then it happens. However, as of right now the trend remains at +0.155 ± 0.056 C.decade-1 k=2.
My prediction for 2025 from the March update was 0.43 ± 0.16 C k=2.
My prediction for 2025 from the April update was 0.47 ± 0.14 C k=2.
My prediction for 2025 using the May update is now 0.46 ± 0.11 C k=2.
Disclaimer 1: For the significant figure police…I’m using the guidelines in JCGM 100:2008. If you don’t like it either complain to them or stop telling me I have to use the GUM.
Disclaimer 2: I never said the planet is going to catch on fire. I never said humans are all going to die. I never said CO2 is the one and only cause of the warming. I never said the 5 parameters in the model above are the only causes of the warming either. I never said a lot of things here that people seem to desperately want me to have said. I’ll say it over and over again. I’m not going to defend absurd arguments especially when I’m not the one making them.
This is still below the record of +0.158 ± 0.092 C.decade-1 k=2 ending in 2004/04.
However, it is interesting to note that in terms of the lower bound of the uncertainty envelope that the trend ending in 2004/04 comes in at +0.066 C.decade-1 where the trend ending in 2025/05 comes in at 0.099 C.decade-1. This makes the lower bound on the trend ending in 2025/05 a new record in the UAH dataset.
Note that the uncertainties I compute use an AR(1) model to correct for auto-correlation similar to what the Skeptical Science trend calculator does using the [Foster & Rahmstorf 2011] method.
And what does you “model” predict will be the lowest anomaly by the end of the year.?
No, you just believe it to be so. You believe in a GHE which you cannot describe in any consistent and unambiguous way.
That’s religion, not science.
“ I never said the 5 parameters in the model above are the only causes of the warming either.” Must have been the elephant’s trunk.” 😉
chuckle.. and its wiggling !!
May I see your poetic license, please? I went through most of the document except all the appendices at the end when I ran into a problem with it not loading properly. I could not find a discussion of significant figures or clear guidance on the number of significant figures to use for the uncertainty, other than for an admonition to not use more than 2, except …
Would you kindly provide a page number or chapter and verse that you are using for guidance?
7.2.2 also shows that the point value should not exceed the significant digits of combined uncertainty. It is why using an uncertainty budget as outlined in 7.1.4 (b) is very important in showing how the total uncertainty was calculated for each input quantity.
Resolution is an important factor in determining the proper value of significant digits. Here is a site that has a good discussion.
How to Calculate Resolution Uncertainty – isobudgets
The important phrase is:
(bold by me)
It is why NOAA’s statement of both uncertainty and resolution in their thermometer manuals are important.
We had this same conversation 4 weeks ago. The answer is the same today as it was 4 weeks ago.
JCGM 100:2008 section 7.2 starting on pg. 25.
Example: 100.02147 ± 0,00035 g in section 7.2.2 on pg. 26.
Example: 100.02147 ± 0.00079 g in section 7.2.4 on pg. 26
Section 7.2.6 on pg. 26: “The numerical values of the estimate y and its standard uncertainty uc(y) or expanded uncertainty U should not be given with an excessive number of digits. It usually suffices to quote uc(y) and U [as well as the standard uncertainties u(xi) of the input estimates xi] to at most two significant digits, although in some cases it may be necessary to retain additional digits to avoid round-off errors in subsequent calculations.”
They even have the example 10.000742 Ω ± 129 µΩ which uses 3 significant figures in section 4.3.4 on pg. 12.
And then we have the NIST Fundamental Physical Constants database which uses 2 significant figures.
And since you’ve forced this issue yet again I want to draw your attention to Bob Weber’s post below in which he used 5 significant figures for his p-value.
Why didn’t you mention 7.1.4 (b)?
It is why using an uncertainty budget as outlined in 7.1.4 (b) is very important in showing how the total uncertainty was calculated for each input quantity.
Resolution is an important factor in determining the proper value of significant digits. Averaging can induce artificial expansion of significant digits and thereby decrease the perceived uncertainty at the same time. An uncertainty budget based in reality will quickly identify any artificial increases.
For the same reason I didn’t mention 3.3.2 (b) or D.6.1 or most of the document. They are not relevant to the discussion of significant figure rules.
7.1.4 (b) is most certainly relevant to significant digits in a measurement.
Resolution is a direct indication of the number of digits available in a measurement. Resolution uncertainty is sometimes the limiting factor in significant digits.
If you have not prepared an uncertainty budget as required in 7.1.4 (b), you have no idea what the combined uncertainty should be limited to.
If you’re argument is that 7.1.4 (b) must be mentioned because it effects the uncertainty then you probably should have mentioned every word of the 120 pg document since all of it effects uncertainty.
You are handwavving again. This statement does not “effect” anything!
It is an admonition that all categories of uncertainty should be considered.
As I said, resolution uncertainty is a category that defines the limits of information contained in observations and also limits the information available in subsequent calculations.
Are you familiar with uncertainty budgets?
Read GUM
Resolution uncertainty is one of several uncertainty components.
All categories effect the final uncertainty u (or U). And according to the GUM you report measurements using a number of digits determined by u. Anything effecting u will ultimately have an impact on the number of digits used. It’s quite a stretch to claim that resolution is the only thing that matters in the discussion of significant figures.
So are systematic and random components. And don’t forget that correlation also effects the uncertainty and thus the way measurements are reported.
And you’re gaslighting again. Remember, I was asked for a section in the GUM discussing significant figures. I provided it. You were then triggered because I didn’t mention all of the minutia of details that contribute to or effect the uncertainty u upon which the specific guidelines being discussed are based.
More hand waving with little knowledge imparted.
Uncertainty “u” for an input quantity is based upon the resolution of the measuring device.
What is a possible resolution uncertainty of a measurement made with a device with a resolution of 1 decimal place?
What is a possuble resolution uncertainty of a measurement made with a device with a resolution of 4 decimal places?
Can you have a resolution uncertainty of 0.00053 from a device whose resolution gives a measurement of 13.3?
You have quite obviously never taken any advanced physical science lab courses where this is taught. Nor have you worked in a field where measurements have legal and/or regulatory implications. The GUM is not a training manual for making measurements. It is a reference manual to use in determining proper procedures.
Read this web page for an introduction.
https://www.isobudgets.com/calculate-resolution-uncertainty/
Here’s what I think is going on. You don’t like the GUM guidelines regarding significant figures because it conflicts with your own personal guidelines, but because you feel trapped by the untenable dichotomy of either breaking away from the GUM or admitting your mistake you instead deflect and divert away from the actual guidelines (in section 7.2) by calling my citation of it “handwaving”.
No deflection, no mistake. Look closely at the examples in the GUM. Find one where the significant digits in a measurement have been extended because of an uncertainty that is smaller than what was measured.
You refuse to recognize that the resolution/precision of the measurement also controls the precision of the uncertainty. One cannot extend the significant digits nor the uncertainty beyond what was measured.
Read this site:
https://www.isobudgets.com/calculate-resolution-uncertainty/
and tell me what in the GUM the author violates.
Hmm…Maybe it’s not my citation of the GUM that you feel is handwaving. Your continued deflection and diversion away from section 7.2 is now making me think it’s the GUM itself that you feel is handwaving.
And for record (and umpteenth time) I accept, fully and unconditionally, that resolution is component that must be considered when determining the uncertainty. Not that I think this will matter since you’ll undoubtedly continue gaslight me regardless.
I’ll give the last word on the matter because clearly nothing I say will convince you that the GUM provides reasonable guidelines for the expression of measurements.
You still have no understanding. Look at what you quoted earlier.
This from thermometers that have at best a resolution of 0.1°C (USCRN) and an uncertainty of ±0.3°C.
How does that work?
When dealing with physical constants, which are typically used in calculations, it is prudent to retain 1 extra guard digit. That is not the case for a final answer where the extra digit is unnecessary.
That’s your rule. Like I said I’m using the JCGM 100:2008 guidelines
BTW…Are you going to criticize others when they don’t follow your rules or is that something you save only for me? I’m asking because others here (like Bob Weber in this very article) don’t follow your rules yet you remain silent.
Isn’t it obvious that you get special treatment?
I should point out that JCGM/GUM are guidelines, adopted by many well-known organizations, but that doesn’t make them the last word, nor immune from criticism.
I’m not sure anything is obvious. The last time I posted it was consistent with your rules and you still made a stink about it.
Rewriting the above to make it clearer, it would be, “10000742 ±129 µΩ.” By convention, the last significant figure in the nominal value is 2. Does it make sense to have an uncertainty three orders of magnitude larger than the implied last significant figure when the implication from the definition of significant figures is that the uncertainty should be approximately ±0.5? I submit that the most useful characterization would be 10.0007 ± 0.0001 Ω because that draws attention to the order of magnitude in the measurement where there is some question about the reliability.
A philosophical question, related to your quoted admonition: “It usually suffices to quote uc(y) and U … to at most two significant digits.” Why not add another (or two or three) digits? Does it really provide one with more information than the rounded number I propose? I would, therefore, suggest that unless you can establish (and state the necessity for) a need for more than 1 digit for the uncertainty, that you only use 1 digit, or make it clear why an additional, bracketed guard digit is probably necessary.
The Joint Committee on Guides to Metrology thinks so.
That might be considered “excessive”.
And that’s fine. But just understand it is inconsistent with the GUM guidelines and I have been told repeatedly here that I have to use the GUM. It is the be-all-end-all guide to metrology I’ve been told and that if I don’t use it my reporting of measurements won’t be taken seriously or just assumed to be wrong (regardless of whether they actually are).
To be frank…I question how genuine you actually are in your critiques of significant figures here since you all you seem to want to do is direct them toward me, but no one else. It almost seems like you have rules for me that you expect to be followed, but a different (and more relaxed) set of rules for everyone else. Am I wrong?
Perhaps. It is also possible that they just didn’t realize that there is an apparent contradiction with the abstraction of significant figures. Common sense and logic should be the final arbiter in the debate.
Based on what? Subjective judgement? They state “at most two significant digits,” justifying it with the argument about round-off errors, and then provide an example with 3 digits. That is logical inconsistency. It is my opinion that a general procedure, guided by the objectives of measurement, which I have been laying out, is better than just following a cookbook.
I believe that has been coming mostly from Jim and Tim Gorman, whose judgement I have come to respect. I had never heard of the GUM before they cited it. There is much to be said for the guidelines of the GUM, but I’m not so dogmatic as to insist that one follow any prescriptive guidelines without having the flexibility to deviate if some new situation is presented that isn’t covered by the guidelines.
If you can make a good logical case for doing something differently, I will probably be accepting. However, I think that consistency, particularly with respect to providing all the essential information about descriptive statistics and dealing with necessary considerations, like propagation of error, are essential in making a compelling argument. So-called climate scientists have repeatedly shown a cavalier attitude towards metrology and error propagation.
Did you expect me to ignore your remark about the “significant figure police?” I assure you I am quite genuine. I spend time responding to you because you have demonstrated that you are bright and a quick learner, and I can usually expect a response that is thoughtful, despite usually not agreeing with you. I spend the time because I see the potential of turning you to see the error of your ways. There are some commenters here that I think are lost causes and I’m not going to spend much time trying to turn them. My years left are getting smaller in number to where I can probably count them on two hands, unless I resort to base-2. 🙂
What they actually state is this…
The numerical values of the estimate y and its standard uncertainty uc(y) or expanded uncertainty U should not be given with an excessive number of digits. It usually suffices to quote uc(y) and U [as well as the standard uncertainties u(xi) of the input estimates xi] to at most two significant digits, although in some cases it may be necessary to retain additional digits to avoid round-off errors in subsequent calculations.
I believe that has been coming mostly from Jim and Tim Gorman, whose judgement I have come to respect.
I’m curious how deep your respect goes.
Do you respect his judgement that Σa^2 = (Σa)^2?
Do you respect his judgement that sqrt[xy^2] = xy?
Do you respect his judgement that Σ[x_i, 1, N] / N (average) are Σ[x_i, 1, N] (sum) are the same?
Do you respect his judgement that ± is mathematical operator?
Do you respect his judgement that the plus (+) operator necessarily implies that the rhs operand is positive?
Do you respect his judgement that a/b = x is solved for a?
Do you respect his judgement that PEMDAS rules are optional?
Do you respect his judgement that y = (a – b) / 2 is an average?
Do you respect his judgement that ∂(Σ[x_i, 1, n]/n)/∂x_i = 1?
Do you respect his judgement that radiant exitance (W.m-2) is an extensive property?
Do you respect his judgement that the average insolation from the Sun is 552 W.m-2 and not 340 W.m-2?
No they haven’t. It is the Gorman’s that have repeatedly shown gross negligence towards and metrology and error propagation and have been gaslighting about it for years.
My statement wasn’t directed toward you.
Then demonstrate it with your actions. The next time you see an article or comment author not following your rules hold them accountable. I recommend starting with Dr. Spencer here in this very article. And then watch for Monckton to make a reappearance because his articles break rules prolifically. And below Bob Weber used 5 significant figures in his p-value. Is his p-value really known to within to 0.00001?
Wow! That some ad hominem w/o a single bit if context. Congratulations!
Maybe you should try some actual quotes.
The GUM does not tell one what VALUE an uncertainty or the point value should be, that is controlled by the resolution of the measuring device. An uncertainty can be 0.35, 0.035, 0.0035, or 0.000035 depending on the resolution.
What makes little sense is quoting a measurement as 1.1 ±0.0004.
I have an HP 3465B 4.5 digit voltmeter. It has a resolution of 1 μV on the 20 mV scale. However, the uncertainty is ±0.03% of full scale at this setting. That means the resolution uncertainty is ±6 μV.
You have apparently learned a great deal from the GUM. Show us how this can be reduced to a smaller value using some reference from the GUM.
First…you’re gaslighting again. I don’t use the ad-hominem tactic because I don’t attack people’s character. Instead, I attack their arguments and positions when they are wrong. And in this case it is definitely wrong toward metrology and error propagation. And I provided many links of the numerous algebra mistakes you made when shaping your position. The mistakes are so trivial in many of these cases that any reasonable person would recognize them as grossly negligent.
Second…your post has nothing to do with the discussion Clyde and I are having. We’re discussing how many significant figures from the uncertainty u to include when reporting measurements. We aren’t discussing how to determine the uncertainty u. That is a different topic and different exercise. Just because the GUM also provides guidance on determining/calculating the final uncertainty u or the components that go into it (like resolution) does not mean that it is directly related to our discussion or that we are mandated to discuss it. I don’t mind engaging with you during the discussion, but I’m only going to do so when you stay on point and stop deflecting and diverting.
From Dr. Taylor
What Clyde and I are trying to tell you is that the resolution of a measurement should follow thru all calculation, both of measurand magnitude and its uncertainty.
First…Clyde didn’t say that. What he said is that he doesn’t agree with the guidelines regarding how many significant figures to report set forth in section 7.2 which, on its own, would not be that big of deal.
Second…I’m not challenging the fact that resolution of a measurement should propagate through to the final uncertainty u (or U) and neither is section 7.2. So you’re creating a strawman that for some reason you think I should defend. I’ve said it time and time again. I’m not going to defend absurd arguments put forth by others.
Speaking of staying on point, my position is that various authorities have suggested, “at most,” two significant figures, with the admonition that 1-digit is usually sufficient unless a guard digit is anticipated to be necessary for physical constants or measurements that are used in subsequent calculations. The example of the 10-Ohm resistor is in violation of the recommendations and an unusual precision for a 10-Ohm resistor.
Note that in the example of the 10.0007 ± 0.0001 Ω resistor, as I have stated it, it has a precision of ±0.001%; the original example of “10000742 ±129 µΩ” has a precision of 0.00128%. Is the (28) really meaningful, considering the uncertainty is an estimate?
What I’m really advocating is not to list all the digits reported by the computational device, which is excessive, not to leave out any reference to uncertainty, and not to unthinkingly follow some ‘recipe book’ that provides an example that is in violation of reasonable rules for informing one about the order of magnitude of the precision of a measurement of calculation. In other words, use common sense and think about the purpose of the uncertainty.
+100
“Is the (28) really meaningful, considering the uncertainty is an estimate?”
As with most of this, common sense is more useful than arbitrary rules, but going by all the books, yes ±128 is more meaningful than ±200. It would have to be 200 if you want only 2 digit as you usually want to round uncertainties up. Even Taylor, says that you should use two digits when the first digit is a 1.
However given the size of the answer, and depending on the context, it might make more sense to just say 10Ω and not worry about the uncertainty. That 0.0007 and the associated uncertainty is unlikely to have any practical effect.
“What I’m really advocating is not to list all the digits reported by the computational device,”
We can all agree on that. Though again I text is important. A data file for instance might as well give the entire data, rather than prematurely rounding the data.
“and not to unthinkingly follow some ‘recipe book’ that provides an example that is in violation of reasonable rules for informing one about the order of magnitude of the precision of a measurement of calculation.”
That’s exactly what I keep saying. I just suspect we are talking about different recepie books.
“In other words, use common sense and think about the purpose of the uncertainty.”
And also the purpose of the measurement.
No, rounding up, if you want to give that rule priority, would be “±130″. That still falls within the admonition to limit the uncertainty to two digits.
Sorry, I meant rounding to 1 digit. I assumed that was what you were meant when you asked if the (28) was necessary.
I’m not going to wade through your list of saved-up grievances and attempt to defend Jim or Tim. They can and have done that themselves. You have made it clear that you and others will take note of any perceived errors, and probably have brought them to their attention. Therefore, for what seem to be trivial mistakes, perhaps typos, I generally (but not always) let them slide. One of the realities of modern warfare is the loss of good troops through what has come to be called ‘Friendly Fire.’ I don’t want to be responsible for such losses. So, unless I think a skeptic is way off base, such as Michael Flynn usually is, I figure that I’ll focus on the bigger fish that need frying. That includes you. You are articulate and bright and might easily mislead others if someone doesn’t hold you accountable. A wise man chooses the battles he decides to expend resources on and doesn’t try to fight them all. I freely admit that I’m selective on who I hold to the highest standards. It is generally those whom I see as the bigger threats. Consider yourself complimented.
“For the significant figure police…I’m using the guidelines in JCGM 100:2008. “
Likewise I found no reference to the issue of significance in the JCGM.
The Mann-Kendall Test applied to bdgwx’s 107 month Monckton Pause yields p=0.93349, and the 24-month pause has p=0.585159, both terribly insignificant.
The Mann-Kendall Test was applied using the Excel add-in called ‘Real Statistics‘, under ‘Time S’.
Use alpha=0.05 for 95% or greater significance. If the p-value is >0.05, it is not 95% significant.
Why am I not surprised at the hubris and incompetence exhibited by bdgwx?
It’s not my pause. It’s Monckton’s.
Unsurprising.
Duh.
Don’t think the irony of you indicting me of hubris and incompetence while simultaneously (and confidently) confused significant figures with significance tests and reporting your p-value to 5 significant figures went unnoticed.
Thank you for the great work, Dr. Spencer. This is a valuable dataset. I keep rooting for the temperature to drop to the 1991–2000 baseline, like it did after the brief deviation in 1998, but we’ll have to wait and see. And frankly, it doesn’t matter much. The peaks and dips vary by an amount that is imperceptible to humans, but it sure causes a lot of stress for some people. I’m satisfied that I can handle a 1 ºC increase in temperature without breaking much (more) of a sweat. Heh.
If it dropped after 1998, there is absolutely no known reason why it will not drop again.
Thanks Roy looks like we are seeing a real move where will it settle
?
Some ignorant and gullible people refuse to believe that there is no “reversion” to a “mean” in a chaotic system such as the atmosphere.
No “equilibrium”. No “settling”.
Well there is a non-linear oscillation (ENSO), I’m not sure that you understand what a ‘chaotic system is, it is a system whose behavior is very sensitive to initial conditions, leading to unpredictable results while still subject to deterministic laws. Such systems exhibit nonlinear behavior meaning that the response to a change in input is not proportional to the change. Also can result in nonlinear oscillations and limit cycles.
Why is that?
Because of what you say.
And what is that? You’re being very mysterious, Phil. Or am I confusing mystery with ignorance and stupidity?
“while still subject to deterministic laws”: which is still in essence an assumption. Moreover it relates to causality and therefor subject to the uncertainty principle. And people can and do disagree on this which is all fine.
You’ve lost me there. What are you trying to say?
Warming of this planet will continue incrementally until the influences that bring about cyclical warming & cooling in weather coincide & dominate once again for a spell, and we’re back to pre-industrial centuries again until the next warming cycle begins again.
Such is the behavior of coupled, non-linear chaotic systems.
See, I’m no “climate denier”.
Another complete waste of time, effort, and taxpayers’ money.
Changes nothing, and achieves nothing. Measuring the data produced by a chaotic system has no utility whatsoever.
Even the IPCC admits that predicting future states of the atmosphere is not possible.
Dr Spencer may fiddle with the data from RSS until he is blue in the face, but it achieves nothing at all. Adding CO2 to air does not make it hotter, there is no GHE, and four and a half billion years of continuous sunlight has resulted in global cooling.
That’s reality. Believing in fairytales is optional, of course.
But you forgot the fairies on the pinhead. That is what is important!
Is the global cooling the result of a chaotic system at work as well? Would Dr Spencer’s work have detected it if satellite measurements had been available over the full half billion years?
No – or yes, depending on your definition of “global”. Do you mean the rate, or the quantum of the cooling? What are your assumptions about internal and external heat sources? But yes, the atmosphere, aquasphere, and lithosphere all act chaotically.
The Earth’s orbit is chaotic, as is the Moon’s. Predicting the past is as difficult as predicting the future where chaos is concerned.
Consider two ping-pong balls bobbing around close together at the bottom of a waterfall. Did they start of close together? In location? In time? You don’t know, and neither does anybody else. Omniscient knowledge of physical laws and the present won’t help.
Was your question merely an ill-formed “gotcha”?
Hey, you used the term global cooling. What did you have in mind?
I think you gotcha’d yourself!
I don’t believe so. You are just being stupid – trying to be gratuitously offensive, but failing dismally.
The Earth loses about 44 TW. If you want to call energy loss “heating” or something similar, you are not the brightest, are you?
The penultimate paragraph from your top-level post at the start of this sub-thread :
.
Several people have called you out on this, e.g. me under a previous article, but you persist in giving numbers for the geothermal “heat flow” from the surface of the solid Earth.
Davies & Davies (2010), “Earth’s surface heat flux”, Table 7 :
NB : Their 47 TW is slightly higher than your 44, but it’s in the same ball-park.
The Earth’s surface area is approximately 510 million km².
The impressive sounding “44 TW” equates to … drumroll please …
~86.3 milli-Watts per square metre.
.
Out of curiosity, just how is that “heat flow” distributed over the (solid) Earth’s “surface ?
Davies (2013), “Global map of solid Earth surface heat flow”. Figure 7 :
What does this look like using a more “global summary” approach ?
OK, I used the term “global cooling”. The “globe” loses 44 TW. That’s called “cooling” – unless you are particularly detached from reality, or really ignorant and gullible.
Which are you?
Adding CO2 to air doesn’t make it hotter, and the surface has cooled over the past four and a half billion years.
So sad, too bad.
Look up a few posts. You will see what you wrote. And yes you did use the term global cooling.
The trouble with making stuff up is that you need a good memory. Otherwise you’ll forget what you made up.
Me? Not the brightest? Too funny!
Agreed. I’m laughing, anyway.
You believe that adding CO2 to air makes it hotter! Now that’s even funnier!
Michael, I wrote nothing of the kind. And before you go mind reading as to what I do and don’t believe … ask yourself why you denied using the term global cooling.
Read your own mind.
You believe that adding CO2 to air makes it hotter.
Of course you didn’t write it down. You would appear as foolish as you are.
You can deny in writing that you believe that adding CO2 to air makes it hotter, if you like. I will believe you. You can deny believing in the GHE at the same time, but I suspect you won’t.
Why should I deny denying something I didn’t deny? If I used the term “global cooling”, that’s a fact, isn’t it? I didn’t believe I did, at the time, and you showed me I was wrong by quoting me.
If you are seeking my thanks, you have them. Thank you.
Seek professional help!
From you? I think not.
You believe in a GHE which you cannot even describe!
Simply put you are arguing with yourself. Read your own mind before you read the minds of others.
You are of course free to choose the professional help of your choice. Denying what you wrote for all to see may be a sign of more serious problems in your mind.
I’m always here to help!
In other words, you believe that adding CO2 to air makes it hotter, but you are terrified of actually saying so.
Seriously Michael, you are not well.
Seriously Forrest, explain why I should value your opinion.
In the meantime, I don’t.
Michael, on the one hand you say that you do not value my opinion. On the other hand you keep responding.
Let it go Michael. And seek help. Or at least look in the mirror.
I find your opinion amusing. I wouldn’t pay for it, though. That’s its value to me.
You obviously think your opinion has value, but I’ll point out that every opinion you’ve had in your life (plus $5 in cash), will buy a $5 cup of coffee. What do you think your unsolicited opinion is worth?
Michael, see how long you can keep this going. See whether you can get the last word.
And yes, you did use the term “global cooling”. And then denied it. And then denied that you denied it.
And bdgwx tells me that you don’t like the idea that the moon rotates.
Have at it!
Just so you know this poster’s trolling behavior was so egregious that Dr. Spencer banned him from his blog. And that’s saying a lot because Dr. Spencer rarely bans people. If you really want to feed the troll though tell him the Moon rotates.
You don’t like me presenting the fact that adding CO2 to air does not make it hotter?
Neither does Dr Spencer, apparently. At least he accepts that anthropogenic heat production might raise local minima, and hence the average temperature.
He might then accept that without a corresponding cooling elsewhere, the global average would rise (basic arithmetic).
You might be too ignorant and gullible to think that Dr Spencer would even contemplate the idea that the GHE is a myth – and agree with me!
You tell me. Or not, as you wish.
UAH shows Australia having a “warmer” Autumn, but what it doesn’t show is that this “warmer” Autumn is not from “warmer” day temperatures but from higher minimum temperatures in most of the Eastern states due to the almost perpetual cloud cover at night for those three months. This means we don’t get those chill early mornings.
Minimum temperatures were regularly 2-4C warmer than normal.
This very apparent when you look at the image from my local region showing the temperature ranges for the last three months compared to the average. Other East coast regions show similar “less-cold” minimum temperatures
You can also see the rainfall we have had over that period, compare to the longer term average, and why massive floods have occurred.
Last night was one of the first “cloud-free” night for a long time, and the temperature dropped to 4.5C !!
It looks to me like the La Nina effects have now ended but we still have the Hunga Tonga effect slowly dissipating. My guess is HT cooling has been around 0.03 C /month for awhile. Probably will slow down even more before disappearing in 2027.
2027 is also the most likely year when the AMO phase change takes place. All talk of warming trends will end soon afterwards.
Interesting. I would have thought that as small as the trend is, it would take perhaps a decade or two to reverse. Then again I’m always surprised by how spiky all of the temperature graphs seem to be.
They’re spiky because they’re plotted as anomalies, which greatly exaggerates the variation and gives warmists fuel for their apocalyptic scare stories. If they were plotted as actual temperatures the responses would be mostly, “meh.”
It’s the opposite. The anomalies greatly reduce the variation. The standard deviation of the absolute temperature is 0.85 C whereas it is 0.29 C for the anomaly temperatures.
The standard deviation of global absolute temperatures is ±0.85°C?
Who do you expect to believe that? 68% of global temperature lie within an interval of something like 15 ±0.85°C.
Numbers is numbers, right?
Show us the probability distribution of global temperatures that is used to determine your assertion
In statistics one of the tricks is to disregard the ‘spike’ anomalies and average out the rest. You can do that in several ways/%.
In my view you cannot in any way tie temperature to CO2 unless you twist the elements in such a way to force the causality into an outcome. If aliens would come to Earth and took a clear look there is simply no way they’d conclude that CO2 is a factor in temperature fluctuations.
Yes. That’s what I got when I did a stdev on the data in Excel. I, of course, invite you or anyone else to double check the calculation.
That is not correct. None of the UAH TLT values lie within 15 ±0.85°C.
I said nothing about UAH. You said:
If you don’t like the value of 15°C, then tell us what your choice is!
The key is ±0.85°C. If that is not the standard deviation of the global temperature, then tell us what was used to obtain it. Your response does not address the fact that whatever the probability distribution is must have a very small range of temperature.
First…it doesn’t matter if I like the value or not. Second…it’s not my choice. Third…if you’re asking what the mean is then the answer is -9.15 C. I encourage you to download the data and double check this for yourself.
It is. I even double checked it just now. Like I said if you don’t want to take my word for it then do the calculation yourself. Or don’t. I don’t really care. I’m not going to lose sleep over it either way.
So the temps are -9.15 ±0.85°C (15.5 ±1.5°F)
Why don’t you show us the probability distribution that describes the globe having 68% of its temperatures in the interval of |-10°C to -8.3°C| and |14.0°F to 17.0°F|.
How about 2σ (95%) intervals? -9.15 ±1.70°C (15.5 ±3.0°F). For intervals of |-10.85°C to -7.45°C| and |12.5°F to 18.5°F|
I guess you realize that means 95% of the earth would be far below freezing. Does anything seem out of whack to you?
You still don’t get that UAH data is for the lower troposphere. And I expect bdgwx is talking about the monthly global standard deviation, not the SD across the globe.
If you want the global standard deviation I make the standard deviation of temperature as 10.9°C. and for the anomaly it’s 0.97°C.
That’s based on the entire monthly gridded data set weighted by area.
Lay off the stuff you are smoking dude.
Monthly global SD ≠ the SD across the globe?
“Monthly global SD ≠ the SD across the globe?”
Correct. That is the standard deviation of the monthly global average is not the same as the standard deviation of temperatures across the globe.
You still don’t get what you are saying.
I do. Maybe I’m not explaining it simply enough for you to understand.
There is a monthly global anomaly published by UAH every month. You can look at all the monthly global anomalies and calculate a standard deviation of the monthly anomalies. And adjusting the anomalies to temperatures you can work out the monthly global temperature deviation. That is what, I assume, bdgwx is doing.
Then there is the gridded data that UAH release that gives you an anomaly for each 2.5 X 2.5 degree region of the globe. They also give the base value for each cell, so you can calculate the temperature for each cell. And it’s these figures I am using to calculate the standard deviation across the globe.
He’s not wrong. I was talking about the standard deviation of all the monthly global temperatures. I was talking about it because that was the context of this subthread.
Nothing’s “out of whack”, the UAH measurements are made of the Lower Troposphere up to ~10km.
Using anomalies supposedly takes out much of the variance due to the sample changing over time.
There are a number of rather heroic assumptions involved.
The fact is that an anomaly is created by subtracting two random variables that each have a probability distribution with a mean and variance.
When subtracting the means of two random variables, the variances are added.
That means the anomaly inherits the variance and defines the uncertainty. Somehow that just gets shoved in the waste bin.
You are thinking of an anomaly as the difference between the current period (month) and the base period (same month over a specific 30 years).
It should be just an offset which is applied to give a zero mean for the base period. Hence, it should be treated as a constant.
This is conceptually the same as the 273.15K difference between the Kelvin and Celsius scales.
This allows reversibility, and avoids spurious accumulation of uncertainties.
The uncertainty of the difference between the current period and base period should be added, and this should be identical whether it’s in Kelvin, Celsius or “site anomaly”, and it should remain identical no matter how many conversions are performed.
For example, if the current period is 16.3 +/- 0.3 degrees C, and the base is 15.8 +/- 0.3 degrees C, the difference is 0.5 degrees C. The uncertainty depends on how you propagate uncertainties, but let’s say 0.4.
The same should apply if we offset by a constant of 15.8.
The current period is 0.5 +/- 0.3 degrees “local anomaly”, and the base was 0.0 +/- 0.3 degrees “site anomaly”.
The difference is 0.5 +/- 0.4 degrees “site anomaly”.
I don’t have a problem using a constant. In fact I’ve posted that it should be a global temperature that the warmists agree is the best temp for the globe.
That can really only work if the same set of sites is used every time.
Otherwise there can be considerable variance due to differences in site locations.
That is true. However, it really cries for a reduced number of world-wide highly maintained and accurate sites like the U.S. CRN network. Climate oriented, rather than weather/aircraft oriented.
We can but dream …
But in reality the anomaly subtraction is not of a constant value for two reasons: each climate practitioner creating trends derives them from whatever data they are using, and these data have uncertainty, even if climatology chooses to ignore it.
There is no agreement as to what the averaging period should be, the number 30 years is proffered but anyone can choose any period they like. Next month’s UAH could appear with a note stating they are now using a different base period***.
Also why would a surface temperature data compilation use the same numeric offset as something completely different like the UAH? This would make no sense.
***It isn’t advertised, but the UAH anomaly base subtraction file is recalculated each month, even though the period and the data used for it don’t change. FORTRAN rounding can cause changes to the fifth digit each month.
“Next month’s UAH could appear with a note stating they are now using a different base period”
They did that 5 years ago. They switched from using 1980-2010, to using 1980-2020 as the base period. Nobody complained, it made no difference to the rate of warming.
But it does make it tricky when reading older posts, using the older base period.
That’s why I emphasised “should”. What should be done and what is done may not coincide.
In many contracts, “shall” is mandatory, “should” would be nice to have, and is often provided by the supplier if it doesn’t cost much to do.
They don’t, as far as I know. The surface “products” tend to use site-specific offsets. UAH uses altitude-based offsets for each altitude.
s/could/should/
Anomalies remove seasonal variation since there are actually 12 anomaly baselines; one for each month. It’s the seasonal variation that is large. You could argue that this assumes there is no change in the seasonal pattern which would be fair. I’m not sure I’d call that heroic though. What other assumptions are you thinking of?
The seasons complement each other across the equator.
In addition, the quoted global averages are annual, so monthly differences aren’t relevant.
As a matter of interest, are monthly averages available using the absolute, Celsius or Fahrenheit temperatures?
The big ones are the assumption of geographic (lat/lon, altitude, proximity to coast) and temporal correlation.
As sites are added, their offset needs to be extrapolated from the existing (later) data. We all remember the Zeroth Law of time series 🙂
Just to be clear all of my posts in this subthread are related to the context started by Phil R. That context is the time series of the monthly global average UAH TLT anomalies.
There is a seasonal pattern in the UAH TLT anomalies. In fact, when plotting the UAH TLT values in absolute terms you can easily spot 45 spikes whereas there only 15’ish (give or take depending on definition) spikes in anomaly terms.
Phil R’s claim that the UAH TLT graph is “spiky” because it is based on anomalies is plain wrong. The anomalies make it less “spiky” both in terms of the number of spikes and the magnitude of those spikes. This is because the primary cause of the spikiness in absolute terms is driven by the seasonality of the TLT temperature behavior.
Okay. My bad, then.
You can think of it as chaos in action, if you like.
The IPCC accepts the chaotic nature of the atmosphere, and I don’t disagree.
Each month I try to present data about the UAH Australia temperature set.
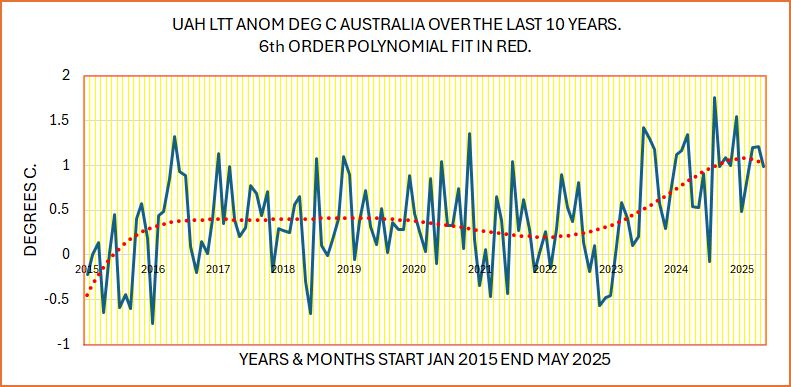
Here is the monthly data, thank you Dr Roy Spencer, to the start of June 2025.
This is a fairly pedestrian graph. I intend to do some further work on the duration of the warm “peaks” that some people associate with ENSO events. This most recent peak is far wider than any before, depending on how such events are defined.
Geoff S
Interesting to look at the UAH Australia data since 1998.
It appears to operate as jumps in temperature followed by cooling trends.
(graphically added for illustrative purposes, not calculated)
Strangely enough, chaotic systems can exhibit sudden discontinuities, as various financial market participants have discovered to their dismay.
It might be that your graphs indicate moves of this nature, slightly obscured by the type of data.
And old wise saying: If you don’t like the weather, hang around for a few minutes. It will change.
There’s nothing like real data to bring out the troll squad.