By Vijay Jayaraj
Carbon dioxide (CO₂) has been predominantly portrayed as the chief culprit driving global warming. For decades, this misconception has guided international policies, prompted ambitious targets for reducing CO2 emissions and driven a shift from reliable and affordable energy resources like coal, oil, and natural gas toward problematic wind and solar sources.
However, this theory overlooks important factors that influence Earth’s climate system, including a critical variable in the climate system – the role of clouds, which remains woefully underestimated.
Recent work by physicists W. A. van Wijngaarden and William Happer challenges this prevailing paradigm: Their new paper, Radiation Transport in Clouds, suggest clouds affect atmospheric temperature more than CO2 because they have a greater impact on the comparative amounts of solar energy entering Earth’s atmosphere and escaping to outer space.
The Overshadowed Influence of Clouds
Clouds simultaneously reflect incoming sunlight back to space (cooling the Earth) and trap outgoing heat (warming the Earth). This dual nature makes clouds both powerful and perplexing players in our climate system. The net effect of clouds on climate is a balance between these opposing influences, thus a central component of the Earth’s energy budget.
A recent study by van Wijngaarden and Happer, titled “Radiation Transport in Clouds,” delves into this complexity. The 2025 paper says the radiation effects of clouds can easily negate or amplify the impact of CO2. The researchers highlight that clouds have a more pronounced effect on Earth’s radiation budget than greenhouse gases like CO₂.
For instance, their research reveals that a modest decrease in low cloud cover could significantly increase solar heating of the Earth’s surface. In comparison, a doubling of atmospheric CO2 concentrations reduces radiation to space by a mere 1%: “Instantaneously doubling CO₂ concentrations, a 100% increase, only decreases radiation to space by about 1%. To increase solar heating of the Earth by a few percent, low cloud cover only needs to decrease by a few percent.”
This stark contrast highlights the disproportionate influence of cloud dynamics compared to CO2 fluctuations. Most state-of-art climate models are still in their infancy. We need more accurate measurements of clouds’ properties and their influence on the electromagnetic components of solar radiation if they are to be useful inputs for climate models.
Implications for Energy Policy and Reliability
Current strategies assume a direct and dominant link between CO2 emissions and global temperatures to justify aggressive “decarbonization” efforts and an increase in the use of solar and wind energy.
However, solar and wind are inherently intermittent, rendering them unreliable and very expensive as components of a power grid. The infrastructure required to support these technologies entails substantial upfront investments, higher operating costs and increasing utility bills for consumers.
Blackouts, energy shortages and price spikes are becoming increasingly common in regions that have prematurely decommissioned fossil fuel plants without adequate backup solutions. This trend disproportionately affects vulnerable populations, exacerbating energy poverty and hindering economic development.
The major justification for using solar and wind has been that they counter global warming by reducing CO2 emissions from burning fossil fuels. If small variations in cloud cover actually overwhelm the effects of CO2, then the climate’s sensitivity to greenhouse gases is being significantly overestimated. This has profound implications for policy.
Attributing global warming predominantly to CO₂ emissions from the use of fossil fuels is a gross oversimplification. While CO2 undoubtedly has a warming effect, it is relatively modest and beneficial, mainly moderating the difference between daytime and nighttime temperatures. On the other hand, clouds, with their multifaceted interactions and feedbacks, represent a critical and underappreciated component of this puzzle.
The findings of van Wijngaarden and Happer highlight a broader issue within climate science: the tendency to oversimplify complex systems for the sake of political expediency. As the global energy landscape continues to evolve, it is imperative that decisions be based on sound science rather than political dogma.
The time has come to reassess our approach to both climate science and energy policy. The stakes are too high to continue down a path of destructive policies based on erroneous analyses. We must prioritize reliable, affordable energy sources and grid stability over useless reductions in emissions of a harmless gas.
Click here to access the entire Radiation Transport in Clouds paper.
This commentary was first published at BizPac Review on February 10, 2025.
Vijay Jayaraj is a Science and Research Associate at the CO2 Coalition, Arlington, Virginia. He holds an M.S. in environmental sciences from the University of East Anglia and a postgraduate degree in energy management from Robert Gordon University, both in the U.K., and a bachelor’s in engineering from Anna University, India.
For God’s sake please stop buying into the Global Warming is a problem narrative. Casting CO2 as a “culprit” says that you do.
1. More rain is not a problem.
2. Warmer weather is not a problem.
3. More arable land is not a problem.
4. Longer growing seasons is not a problem.
5. CO2 greening of the earth is not a problem.
6. There isn’t any Climate Crisis.
Your article says that you essentially deny #5 on the list. There isn’t any Climate Crisis and there isn’t any culprit.
There is a problem and it’s the insanity of “Net Zero” and there are plenty of people and organizations that can be labeled as culprits bent on destroying industrial civilization.
“Isn’t the only hope for the planet that the industrialized civilizations collapse?
Isn’t it our responsibility to bring that about?” Maurice Strong
Strong passed away a decade ago, but there are lots of left wing zealots out there pushing Strong’s party line.
“We’ve got to go straight to the heart of capitalism and overthrow it.” George Monbiot
These people need to be stopped and agreeing that CO2 is a “culprit” won’t do the job.
Good comment
Culprit was a bad word choice
Culprit is always negative.
Only if you believe global warming is negative, would you use the word culprit.
I don’t think author Vijay believes that, based on reading and recommending dozens of his prior articles.
If you believe global warming is good news, as I do, calling CO2 a major CAUSE of the TMIN warming makes sense. That makes CO2 a hero, not a culprit.
It does not make sense to assume something you cannot measure.
_____________________________________________________________________
Bingo!
Here’s the entire quote from the IPCC’s AR4 Chapter 10 Page 750 pdf4
Temperature Extremes
It is very likely that heat waves will be more intense, more frequent and longer lasting in a future warmer climate. Cold episodes are projected to decrease significantly in a future warmer climate. Almost everywhere, daily minimum temperatures are projected to increase faster than daily maximum temperatures, leading to a decrease in diurnal temperature range. Decreases in frost days are projected to occur almost everywhere in the middle and high latitudes, with a comparable increase in growing season length.
Warmer winters and longer growing seasons! What’s not to like about that?
Chapter ten also says:
Mean Precipitation
For a future warmer climate, the current generation of
models indicates that precipitation generally increases in the
areas of regional tropical precipitation maxima (such as the
monsoon regimes) and over the tropical Pacific in particular,
with general decreases in the subtropics, and increases at high
latitudes as a consequence of a general intensification of the
global hydrological cycle. Globally averaged mean water
vapour, evaporation and precipitation are projected to increase.
That’s not a recipe for drought like the re-branded “Legacy Media”
likes to bloviate about.
“The 2025 paper says the radiation effects of clouds can easily negate or amplify the impact of CO2”
Easily? Easy for whom?
Yes, of course they could. A layer of aluminium foil could easily do it too.
The question is, do they? The paper gives no evidence that it is happening, or even what could cause a change to make it happen.
I see this is another H&W blockbuster that never made it into a regular journal.
C’mon Nick.
You know that anything that suggests that “the narrative” on AGW is subject to debate will never be accepted by any of the “regular” journals.
Remember that ClimateGate email –
“we’ll make sure this doesn’t get published in the literature even if we have to re-define what peer review is”.
I thinkbthey rid re-difine peer review.
The who what when etc. of that quote needs to appear more often and certainly in science 101 courses. Probably in the preface of the text books where there is usually some definition for what science is and isn’t. You can find the text HERE
That isn’t what the email said.
Do tell Nick.
For once, you are correct. It actually said:
“Kevin and I will keep them out somehow – even if we have to redefine what the peer-review literature is !”
But the central message appears to be identical, albeit different wording.
No, he isn’t talking about preventing publication. The paper was published. He was talking about whether he would refer to it in a section he was writing for the AR4.
Oh Nick.
I hope you aren’t one of those climate caterwaulers who calls other people “deniers”.
Otherwise your hypocrisy would be worse than your alarmism.
” A layer of aluminium foil could easily do it too.”
Stokes
If TMAX warming becomes a problem, a lot of aluminum foil on the ground or on top of tall buildings will change Earth’s albedo by reflecting sunlight.
Australia has a significant amount of bauxite, considered to be the world’s largest producer of bauxite, producing nearly a third of the global bauxite supply;
Get a patent for your idea and sell it the Australia congress as the ultimate fix for global warming.
You need a clever name
Maybe GeoAluminum Engineering Corporation.
So how much would Happer’s solution cost?
What was the “problem,” again? Oh yeah, THERE ISN’T ONE.
Happer’s solution is to do nothing. Happer says there is no climate crisis and nothing needs to be done about CO2.
“So how much would Happer’s solution cost?”
It would cost net zero.
This clearly calls for us to regulate the clouds by passing a law!
THat’s funny.
Nick, you doubt that “radiation effects of clouds can easily negate or amplify the impact of CO2.”
But you believe that CO2 can easily amplify the impact of H20. Isn’t that the AGW hypothesis?
I don’t doubt it. I said so. The question is, is it happening? What would make it happen?
CO2 has increased.
“I don’t doubt it. I said so. The question is, is it happening?”
The question is, “should we not be sure, before dismantling the energy systems underpinning civilization?”
“what would make it happen?
https://physicsworld.com/a/physicists-claim-further-evidence-of-link-between-cosmic-rays-and-cloud-formation/
“CO2 has increased.”
You are assuming a CO2 increase equals an atmospheric temperature increase.
CO2 increased from the 1940’s to the 1970’s, too, but the temperatures cooled, they did not warm.
CO2 does not appear to be correlated with temperatures if the entire cyclical climate cycle is taken into consideration.
It cloud albedo variations. Nikolov and Zeller show this elegantly in a 2024 paper.
‘What would make it happen? CO2 has increased.’
You guys never cease to amaze me. You start off with the ‘canonical narrative’ that increasing CO2 decreases OLR (outbound long wave radiation), causing the Earth’s surface to warm. Then, after CERES observations show that ASR (absorbed solar radiation) and OLR have been increasing in tandem with warming for the past 20 years, or so, we’re subjected to a series of special pleadings from the alarmists that the canonical narrative isn’t really how things work and that the CERES observations are just what the ol’ useless GCMs predicted. And now, pursuant to publications by W&H, Willis Eschenbach, Clauser and I’m sure many, many others, that clouds are really a big deal, we’re back to CO2 again. Unbelievable!
CO2 with lab spectroscopy will cause +0.7 degrees C. warming for CO2 x 2 in artificially dried air. That would take about 170 years at the current rise rate of +2.5 ppm a year = harmless.
A water vapor feedback is likely to increase that +0.7 number. No one knows how much.
The IPCC says from +2.5 to +4.0 degrees C.
The global average absolute humidity measurements since 1980 are poor quality. They suggest a modest water vapor positive feedback from 1980 to 2000, but not from 2000 to 2020.
No one will say “we don’t know”, so we get a wide range of guesses from 0.7 (Happer) to about 5.5 degrees C. (highest climate model simulation)
These guesses lead to gloomy predictions that have been 100% wrong for the past 50 years. The climate model predictions only “look good” when they are averaged. They are still wild guesses of a future average temperature no one can accurately predict.
“CO2 with lab spectroscopy will cause +0.7 degrees C. warming for CO2 x 2 in artificially dried air.”
Lab spectroscopy? Add CO2 to air – no warming. Add twice as much – still no warming! Spectroscopes don’t measure temperature – maybe you didn’t know this.
There are still people who think that an enclosed glass jar is the same as the Earth’s atmosphere.
Perhaps that is how they live their lives ?
Water vapour feedback is myth, because, as any audio person knows, you have to have a signal before you can get feedback.
And there is no measurable CO2 warming signal.
All feedbacks in the earth’s atmosphere, ocean, and land energy systems, in the classical control theory definitions, are negative.
Not true, positive feedbacks not only exist but can overwhelm negative ones. Cooling leads to more snow and ice, increasing Earth’s albedo, precipitating glaciations and making it difficult to come out of them. This is why short 10 KY interglacials are separated by ~80-90 KY glaciations.
No. From ice cores there is ample evidence of alternating periods of glaciation / deglaciation that ties to orbital cycles, all within the larger context of the Earth’s current landmass configuration. Yes, glaciation reduces albedo, but this so-called positive feedback doesn’t overpower other feedbacks, otherwise the Earth would have gone full ‘snowball’ long ago. The converse is also true of the so-called negative feedbacks, such as desertification, that creates dust that darkens glaciers and causes them to recede back to their interglacial extent.
The statement was that “all feedbacks in the earth’s atmosphere, ocean, and land energy systems, in the classical control theory definitions, are negative.”
I said that positive feedbacks exist. This is definitely true, the well known ice/snow albedo feedback is positive.
The dynamics of getting in and out of glaciations is not explained completely by orbital cycles. When conditions are correct for onset of glaciation, positive feedback helps to get into glaciation rapidly. When condition favor warming, increased albedo from ice and snow prevent warming, until dust darkens the snow and ice reducing albedo.
The second part of my answer was that the positive feedbacks can overwhelm negative ones, not that they always do.
The Earth has been a snowball, and there is no guarantee it will not become one once again. Every next glaciation is colder than the preceding one.
Some spectroscopy can be used to measure temperature, for example Doppler spectroscopy.
The first important point is that even if 0.7 deg C increase for dry air was measured correctly, it was for dry air, but the real atmosphere is not dry.
Secondly, GHE effects of different gases cannot be added arithmetically. When a mixture of GHEs is in radiative equilibrium with a heat source, and the content of water is determined by hydrological cycle, any minuscule increase in GHE due to addition of CO2 is compensated by reduction of GHE from water.
‘CO2 with lab spectroscopy will cause +0.7 degrees C. warming for CO2 x 2 in artificially dried air.’
So what? In a real atmosphere, CO2 and other GHGs excited by thermal radiation from the Earth’s surface is effectively ‘quenched’ through collisions with O2 and N2 molecules within 10 meters, or so, of the surface. Energy absorbed by GHGs is overwhelmingly transported to the upper-troposphere by convection before it can finally be radiated out to space.
Take off your tinfoil hat and think.
The H&W paper stated that the total radiation effects of clouds was far larger than the radiation effects of that would be caused by a doubling of CO2. Having read through their paper of IR transport in a cloudless atmosphere, they convinced me that they have a very good understanding of the various physical processes underlying radiation transport and were able to clearly explain those physical processes. An example process is line broadening due to molecular rotation which thus generates sidebands to the resonance line, easily understood by someone familiar with radio frequency circuitry.
The “easily negate or amplify” is where H&W are expressing uncertainty on what governs cloud cover. There’s reason to believe that the reduction in sulfur content in fuels has reduced cloud cover.
Now show us the empirical evidence that CO2 drives the Earth’s temperature. Consistently, through all of the climate record.
Funny how you cry about the “lack of evidence” when there isn’t any that supports your own position.
The Greenhouse Effect, A Summary of Wijngaarden and Happer
W&H say the ECS is 2.2 per doubling CO2.
You are referring to table 5 of their article here
https://arxiv.org/pdf/2006.03098
They also say the forcing of 2xCO2 is 3 Watts for “clear sky under Fig 4. That isn’t even a degree of surface warming by Stephan Boltzmann, and if you add in a factor of 390/240 Surf/TOA for GHE it’s still only about 1 degree of warming per doubling. They state their model for that table is based on clear sky and a specific temperature profile, while 390/240 would a global average 2/3 cloud cover case which would hive a lower ECS…
“W&H say the ECS is 2.2 per doubling CO2.”
They are wrong. Adding CO2 to air has no effect at all.
Paul Linsay, with many years of physics research…. say ECS = ZERO
https://www.youtube.com/watch?v=hQt_I-RvGF4&t=3417s
Radiative effects that W&H rely on are a very minor part of energy movement in the atmosphere.
ECS is another of those pseudo scientific terminology created by the alarmists that has not reality. It is just a different approach to the old school runaway greenhouse effect, which is also bogus.
There is evidence of more sunlight reaching earth’s surface causing TMAX warming,
A decline of cloud coverage is one likely cause although the measurements are not good enough to be sure.
Lower SO2 pollution is another cause. It’s not sensible to blame CO2 for rising TMAX temperatures — but very sensible to blame CO2 for rising TMIN temperatures.
It’s long past time to stop researching CO2 and spend much more time on clouds and water vapor.
Clouds and water vapor potentially have a far larger effect on average temperature than CO2.
CO2 is a lot easier to measure than the global average effect of clouds and global average absolute humidity.
These are two subjects that need more and better measurements, even if they can’t be blamed on humans.
“ A layer of aluminium foil could easily do it too.” Do what? Using aluminium as an insulator won’t increase the temperature of anything. Wrap a corpse in as much aluminium as you like – it will still cool.
You seem to be under the impression that CO2 has miraculous heating properties! It doesn’t, nor does aluminium.
Dream on.
I’m not able to assess the math in the paper. But the point it seems to be making, if you take the math on trust, is that the magnitude of effects from small variations in clouds is great enough to swamp the effects from the known increases of CO2.
If true, this is important, since it is generally admitted that clouds are very poorly modelled in the standard models, because apparently very poorly understood, and its suggestive in view of the over warming bias of almost all of the models.
The logic of it is a bit like miasma theory. People argued that miasma was the cause of malaria and cholera. It did correlate somewhat with outbreaks, and draining swamps did indeed have an effect on malaria incidence. But this was happening against a background where the real and unknown and unacknowledged causes were drinking water pollution and mosquitoes. There was a real problem with miasma theory when applied to cholera: the error about the cause led to ineffective public health measures and opposition to effective ones.
I think the article is implicitly (it never says it) making the same point: there is an elephant in the room, its power is much greater than the currently favored explanation, and until we understand it better its premature to conclude CO2 is the control knob.
It looks like a serious piece of work – though I would defer to you on whether the math is correct. And the section on the history of observations on the magnitude of cloud effects is quite interesting. Does not deserve to be dismissed without proper consideration of the detailed content.
When you accept the “forcing” paradigm about incremental CO2, there will be no end to the confusing debate about attribution of a reported warming trend.
So yes, acknowledge the overwhelming influence of clouds on longwave emission and shortwave reflection. It’s pretty obvious by watching from space.
But also acknowledge that NO ONE KNOWS to begin with, that incremental CO2 is capable of ANY warming result down here, even assuming the computed static radiative effect is valid. The assumption of a “forcing” influence has been a misconception all along.
So let’s please stop conceding the core claim!
Oh, and why is it so important to take the dynamics of the general circulation into proper consideration? Energy conversion. Modelers know perfectly well about this. More here. Please read the full explanation in the text description at this short time-lapse video of plots.
https://youtu.be/hDurP-4gVrY
Thank you for listening.
Everything is on the table when considering the behaviors of
“coupled non-linear chaotic systems”
Or that’s how things should be in a rational world.
So yes, “we just don’t know” is the most honest statement at this stage.
Quite, our lack of absolute knowledge is where the truth is. The chaotic nature of the world’s climate/weather makes our ability to firstly model it all but impossible. Second, it makes it all but impossible to know if our ability to control down to the very last butterfly flapping its wings in exactly the right place somewhere in the world is in place, thus avoiding that knock on hurricane effect it might/might not create….
Quoting from a parallel thread
Right-Handed Shark
“The greenhouse effect predicted by the Arrhenius greenhouse theory is inconsistent with the existence of the CRE (Chandrasekhar-type radiative equilibrium). Hence, the CO2 greenhouse effect as used in the current global warming hypothesis is impossible. Let us emphasize the overall conclusion:
The Arrhenius type GE (greenhouse effect) of CO2 and other non-condensing GHGs (greenhouse gases) is an incorrect hypothesis and the CO2 greenhouse effect based global warming hypothesis is also an artifact without any theoretical or empirical footing. Without scientific proof the debate on the CO2 GE based catastrophic AGW (anthropogenic global warming) should be abandoned and policymakers should focus on the more urgent environmental and social issues of humanity. The recent worldwide energy crisis is a warning sign that the promotion of the so-called green energy is neither solving energy shortages nor helping to protect the environment from pollution. The climate does not need protection, but the clean environment does.”
Download the free paper here:
https://doi.org/10.53234/scc202304/05
Ferenc Miskolczi: Greenhouse Effect and Climate Change
Richard M
“Miskolczi has been right for quite awhile. The small warming effect from energy absorption at the edges of the 15 µm CO2 window is eliminated by a general reduction in absorption over the H2O absorption bands. This is what his work shows.”
In other words, the warmer/lukewarmer position that adding CO2 increases GHE and shifts temperature equilibrium to a higher value is wrong beyond repair.
“In other words, the warmer/lukewarmer position that adding CO2 increases GHE and shifts temperature equilibrium to a higher value is wrong beyond repair.”
That needs repeating and highlighting.
We need true scientists who can explain this to be called to testify to Congress.
Congress should listen and overturn definition of CO2 and other GHE gases as pollutants.
Bears repeating.
Forcing is yet another of those pseudo-scientific jargon that were created but have not application.
First Vijay article I’ve read that was not very good
He talks about the “findings of van Wijngaarden and Happer” as if they actually found something. They found nothing. They merely repeated the known fact that changes in clouds COULD have a MUCH bigger effect on temperatures than CO2 emissions.
They have no data to estimate the actual effects of clouds over the past 50 years. They do have inaccurate measurements of a proxy called cloud percentage coverage for several decades. They reflect small changes below statistical significance. So there ARE NO DATA to define the climate effects of ACTUAL changes in clouds over the past 50 years. There is only a theory.
Unfortunately, there are NO accurate data for the climate effects of global average cloud changes on absorbed solar radiation (ASR) over a long period of time. The same is true of global average absolute humidity changes — data needed to estimate the ACTUAL water vapor positive feedback. Both subjects need a lot more research.
There is also the problem of differentiating the ASR effect of reduced SO2 pollution versus cloud changes.
Where Vijay goes wrong is this statement:
“Carbon dioxide (CO₂) has been predominantly portrayed as the chief culprit driving global warming. For decades, this misconception has guided international policies”
CO2 is portrayed as the chief cause of warming because that’s what the evidence collected so far concludes. CO2 may be blamed for too much of the post-1975 warming, but CO2 is the best suspect for a majority of the warming, which is the TMIN warming.
Richard you seem to ignore the basic principles of the scientific method –
H&W are testing the CO2 control knob hypothesis against an alternative hypothesis, i.e. –
that natural clouds phenomena can account for hitherto observed movements in detected temps rises.
Let’s see what can be discovered / confirmed should the clouds hypothesis receive as much funded intensive research as the CO2 hypothesis has received.
(which suggestion I can already answer to myself –
“tell him he’s dreamiin'”
There is actually no measured evidence of warming by incremental atmospheric CO2.
Nobody can tell us from measurement if there has been any CO2 warming at all in the 45 years satellite era, (the only period with even remotely consistent and untainted temperature measurements)
CO2 warming only exists in models, which are assumption driven nonsense…
… and radiative theory, which, in an atmosphere governed by bulk air movement, is basically meaningless.
Correct.
Whoever gave the down vote here.. I have a question.
Is it (a) that you have measured evidence that I have not seen?
(b) you know there is no measured evidence but you don’t like to hear it?
or (c) you don’t comprehend the comment?
“(b) you know there is no measured evidence but you don’t like to hear it?”
Well said, Mike. 🙂
He don’t need no stink’n method. He just know.
These have been done and according to who’s data you choose – adjusted and revised or directly measured – the influence of the SUN can explain all (or none) of the ”warming”
The objection will be that van Wijngaarden and Happer are not “climate scientists”, just atmospheric physicists. But as atmospheric physics drives any purported climate effects, it is just silly credentialism.
Right, and atmosphere isn’t involved in climate questions 😀
If W & H believe that adding CO2 to air raises the temperature, they are gullible – regardless of their credentials. Dreaming.
I asked Grok to rank climate model inputs influence from biggest to smallest.
I did have to ask “What about clouds?” because the first answer omitted them.
Then I asked Perplexity – different list, different ranking
Both Grok and Perplexity are mostly ignorant, reflecting what the majority (ignorant) think; doubtful they get any real information from actual modelers, but it’s a start.
Do you want Clouds to have a higher ranking than #4?
Do you want CO2 to have a lower ranking than #1?
Maybe these rankings are all hogwash?
Just excellent, Cynthia!
Your comment provides all the evidence needed to show why planning to expend some 10-30% of all electrical energy generated over the next 20+ years for AI “data centers” is a fool’s errand.
Automated Idiocy.
Propaganda was never a low energy endeavour.
AI is a pattern search in published literature of similar subject phrases to your questions, followed by some synonym word changes to prevent copyright claims. And a backup run or two in case you ask questions. No real intelligence involved just phrase aggregation…you will get a consensus viewpoint. In the case of clouds, the consensus it finds will have a lot to do with the “truthiness weighting” some human being has programmed into its initial search algorithm (article from a scientific journal or newspaper or textbook for example).
AI might be good to get a consensus about what you should invest in order to least affect your portfolio from a stock market crash…or maybe if everyone is consulting AI you should go contrarian….
“I asked Grok to rank climate model inputs influence from biggest to smallest.”
The only thing that influences climate models is the programmer. Even talking about “climate models” is misleading. Climate is just the statistics of weather observations – no modelling possible. Simple arithmetic.
“The only thing that influences climate models is the programmer.”
Oh, I have to disagree. Consider, as counter-examples, money and politics.
Need I mention the infamous IPCC and its laughable CMIP-X charades?
Milankovitch cycles IS climate modeling. And it has nothing to do with weather.
A related point. In essay ‘Cloudy Clouds’ in ebook Blowing Smoke I showed that climate models do not do clouds well. In fact, they do awful. So clouds are also a reason the models fail.
I really don’t know clouds at all
The short term variations in areal cloud coverage (coincidentally reflecting changes in atmospheric RH), integrated over all of Earth’s surface, would seem to be the only viable explanation for the short term (i.e., monthly) +/- variations seen in the UAH satellite-measurement-derived global lower atmosphere temperature—even considering a data precision of only 0.1 C. See the graph of “UAH Global Temperature” (aka GLAT) that is given in the column on the right of this very webpage.
Those relatively fast variations certainly can’t be explained by variations in atmospheric CO2 or SO2 content or to variations in solar insolation at TOA or to changes in ocean/atmospheric circulation patterns. There is a tremendous amount of heat capacity in the world’s oceans.
It is great to see van Wijngaarden and Happer address this issue head on!
Those relatively fast variations certainly can’t be explained by variations in atmospheric CO2 or SO2 content or to variations in solar insolation at TOA or to changes in ocean/atmospheric circulation patterns.
If this is the case, the only region left that can explain the relatively fast variations lies beneath the ocean surface. There must be subsurface “warm water blobs” lurking about in the oceans. The main culprit seems to be the ENSO cycle, with warm ocean surface waters redirected to/appearing on the South American coast.
NO. I thought I pointed out that variations in cloud coverage (and perhaps their associated underlaying relative humidity changes, water vapor being the predominant “greenhouse gas”) is a ready explanation for those short term variations.
There is no need to look elsewhere. And as I specifically pointed out, the world’s oceans have a tremendous amount of heat capacity, which is antithetical to them causing relatively fast variations.
El Nino and La Nina ocean temperature variations occur on multi-year time scales.
El Nino and La Nina ocean temperature variations occur on multi-year time scales.
The ENSO ocean temperature variations seem to have a rather dramatic effect on UAH monthly results. Can this be shown to be solely due to cloud cover variations?
There is no need to look elsewhere.
I respectfully beg to differ.
I respect that . . . please, by all means do so! That is the great thing about WUWT and the general freedom-of-discussion that it allows to commenters.
Testing of claims, hypotheses, and even currently-accepted theories is a key part to The Scientific Method.
I hope you do ignore my postulations/suggestion and derive an alternative hypothesis of equal or greater credibility.
I don’t find that to be so.
Yes, there is a definite correlation of ENSO variations to UAH-published GLAT variations, as show in the attached date-aligned graph, but the correlation is in agreement only on time scales much greater than one month.
Ooops . . . here’s the graph i ofrgot to attach:
Trying again
You can feel the cloud effect by standing in the sun and feeling the infrared heat and then walking into the shade and noticing the cooler difference – what’s the CO2 test?
Ask Greta.
She claimed she can see it in the air.
Well as Thunderclap Newton (sic|) said.
“Call out the instigators. Because there’s something in the air. We got to get together sooner or later. Because the revolution’s here. And you know it’s right”
They were ahead of the Greta curve clearly…..
The influence of the atmosphere (not just CO2) is clear from the difference between surface temperatures of the Earth and the Moon. The average surface temperature of the Moon is 250 K = – 23C at the equator, varying from about 100 to 390K, and average 150 K at 85 degrees latitude. The overall average surface temperature of the Earth (including high and low latitudes) is about 15 C = 288 K, with variation from about 184 K to 330 K. The atmosphere both traps heat and moderates the temperature differences.
The greenhouse effect is real. Otherwise Earth would be an ice ball. The main greenhouse gas is water vapor, because it is present in much, much higher quantities, but CO2 and methane add a little. The effect of CO2 without feedback and without other greenhouse gases can be calculated. Then you have to reduce that effect because of overlaps between the CO2 reflective and absorptive spectra and that of water, and I would expect that in a stable climate, it would also be reduced by negative feedback. But to get enough of an effect to be alarmed about, the alarmists pretend the feedback is strongly positive – which is mathematically equivalent to claiming the climate system is unstable.
Finally, the effects of water are not just the greenhouse potential of the vapor, but how it keeps changing phase from vapor to clouds, rain, and snow, and back, with much greater changes in reflectivity than any greenhouse effect. AFAIK, no climate model uses a cell size small enough to model clouds, so modelers aren’t capturing the greatest effect except as a fudge factor.
This is correct but it misses the the key factor – ice. It is not only the ice in the clouds but also the ice that forms on water and the ice that forms on land that regulates Earttyh’ds energy balance. The phase change of water vapour and water condensate to ice at a precise temperature is by far the dominant factor in regulating Earth’s climate.
Understanding Earth’s climate is essentially the study of ice formation and melting.
The significance of land ice has already dominated the changes observed over the past 500 years with loss of some of reducing the albedo and allowing more land at high northern latitudes to increase above 0C.
We already are seeing record snowfall and the maximum extent of land ice increasing. As the oceans of the NH continue to warm, the snowfall will continue to increase. The significant of the land ice will be appreciated when it is increasing again and humans appreciate that the NH is moving into the first recorded glaciation.
Well, water ice formation and dissipation—both on land and in the atmosphere—are part of Earth’s overall hydrological cycle . . . but they pale in comparison thermodynamically to the overwhelming processes of just the vaporization and condensation of liquid water.
First, for water, the latent heat of fusion is only about 15% that of the latent heat of vaporization at STP.
Next, only about 10% of Earth’s surface is permanently covered by ice, whereas 71% of it is covered by water.
Lastly, ice crystal clouds (predominantly cirrus clouds found above 5 km altitude) comprise only a very small percentage of all clouds in Earth’s atmosphere, most of which are the liquid water microdroplet clouds found across the lower troposphere (cumulus, stratus, nimbus, CN, etc . . . heck, even fogs).
I think it fair to say that liquid water and its vapor phase predominate over ice as Earth’s atmospheric temperature “drivers”.
True but a lot of the ice over water is variable and actually regulates the energy input to the water, That ice can knock out 90% of the incoming sunlight.
Lots of variable, visible ice over the oceans.
Ocean surface temperature cannot sustain more than 30C due to the cyclic ice formation over it. The formation of the ice regulates the temperature.
I’m lost! . . . please explain this phrase as 30 C (a temperature of 86 deg-F, representative of tropical waters) is some 30 C above the melting point of ice, 0 C.
I’m not aware of sea ice forming in tropical waters, let alone in a cyclic manner.
The ice forms over the tropical waters above 7km. IUt is all that bright white stuff in the image I posted.
The surface temperature regulating process is controlled by the formation of the ice in the atmosphere. The ice formation in the sky has very powerful negative feedback such that OLR drops of at only half the rate that SWR increases.
RickWill,
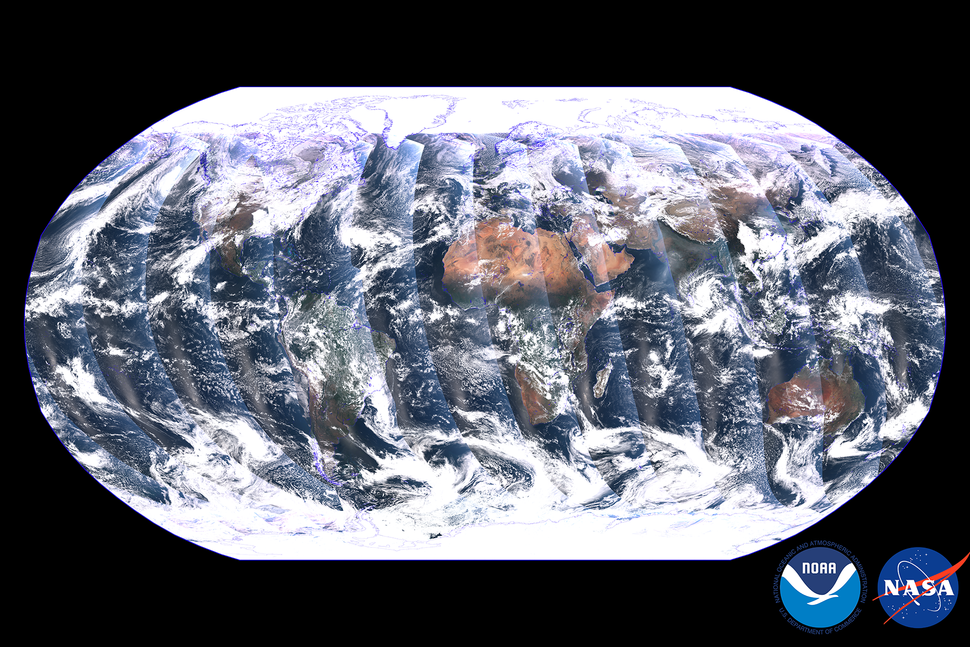
Earlier you posted above a panoramic composite photo of a (largely) cloud-covered Earth:
“True but a lot of the ice over water is variable and actually regulates the energy input to the water, That ice can knock out 90% of the incoming sunlight.”
and then immediately below that photo:
“Lots of variable, visible ice over the oceans.”
And then in you post immediately above you state:
“The ice forms over the tropical waters above 7km. IUt is all that bright white stuff in the image I posted.”
In reality, no, it is NOT all that bright white stuff in the image you posted.
Based on CALIPSO satellite data, cirrus clouds cover an average of 31% to 32% of the Earth’s surface.
— https://journals.ametsoc.org/view/journals/clim/31/5/jcli-d-16-0608.1.xml
“Cirrus clouds cover up to 25% of the Earth (up to 70% in the tropics at night) and have a net heating effect. When they are thin and translucent, the clouds efficiently absorb outgoing infrared radiation while only marginally reflecting the incoming sunlight. When cirrus clouds are 100 m (330 ft) thick, they reflect only around 9% of the incoming sunlight, but they prevent almost 50% of the outgoing infrared radiation from escaping, thus raising the temperature of the atmosphere beneath the clouds by an average of 10 °C (18 °F)—a process known as the greenhouse effect. Averaged worldwide, cloud formation results in a temperature loss of 5 °C (9 °F) at the earth’s surface, mainly the result of stratocumulus clouds.”
— https://en.wikipedia.org/wiki/Cirrus_cloud
Please note in the Wikipedia citation the fact that cirrus clouds are asserted to have a net heating effect, but averaged worldwide the effect of all clouds is a net cooling effect at Earth’s surface.
And for those quick to criticize Wikipedia as a credible reference, please note that the particular Wikipedia article I referenced cites 89 references and a bibliography of 30 publications.
So, since your composite photograph is the complete Earth under daylight conditions, only some 25-33% of the area is expected to be cirrus (i.e., ice content) clouds. By eyeball, it looks like that composite photo shows Earth having about 50% cloud coverage. This falsifies you claim of “all that bright white stuff” is ice/ice crystals in cirrus clouds.
Nice pic….And about 65% has cloud cover, which covers ice, water, land. Clouds have a local Albedo up to about .7 …And that’s .7 of incoming 1360 watt/sq. M of sunlight near the equator and 1000 or so in temperate zones, so doesn’t take cloud cover very long to fix the paltry 240 Watt day/night-pole-to-pole average that most CO2 alarmists will mention.
Well, not so in general.
Cloud albedo on a planet varies from less than 10% to more than 90% and depends on liquid water/ice content, thickness of the cloud, droplet sizes, solar zenith angle, etc.
(source: Hartmann, Dennis (2016). Global Physical Climatology. Australia: Elsevier. pp. 76–78. ISBN 978-0-12-328531-7 )
Typical albedo for different cloud types:
— cumulonimbus clouds = 0.9
— stratocumulus clouds = 0.6
— cirrus clouds = 0.5
(source: https://www.e-education.psu.edu/earth103/node/1002 )
(my bold emphasis added above)
Cumulonimbus (CN) clouds are well-known for their frequent formations over tropical waters . . . not so much for cirrus clouds.
See also Willis Eschenbach’s “thermoregulation” hypothesis for atmospheric temperature self-regulation based on thunderstorm (CN) formation and the accompanying “sharp increase” in albedo over tropical waters.
(ref: https://wattsupwiththat.com/2013/10/06/evidence-that-clouds-actively-regulate-the-temperature/ and his many followup articles supporting this hypothesis)
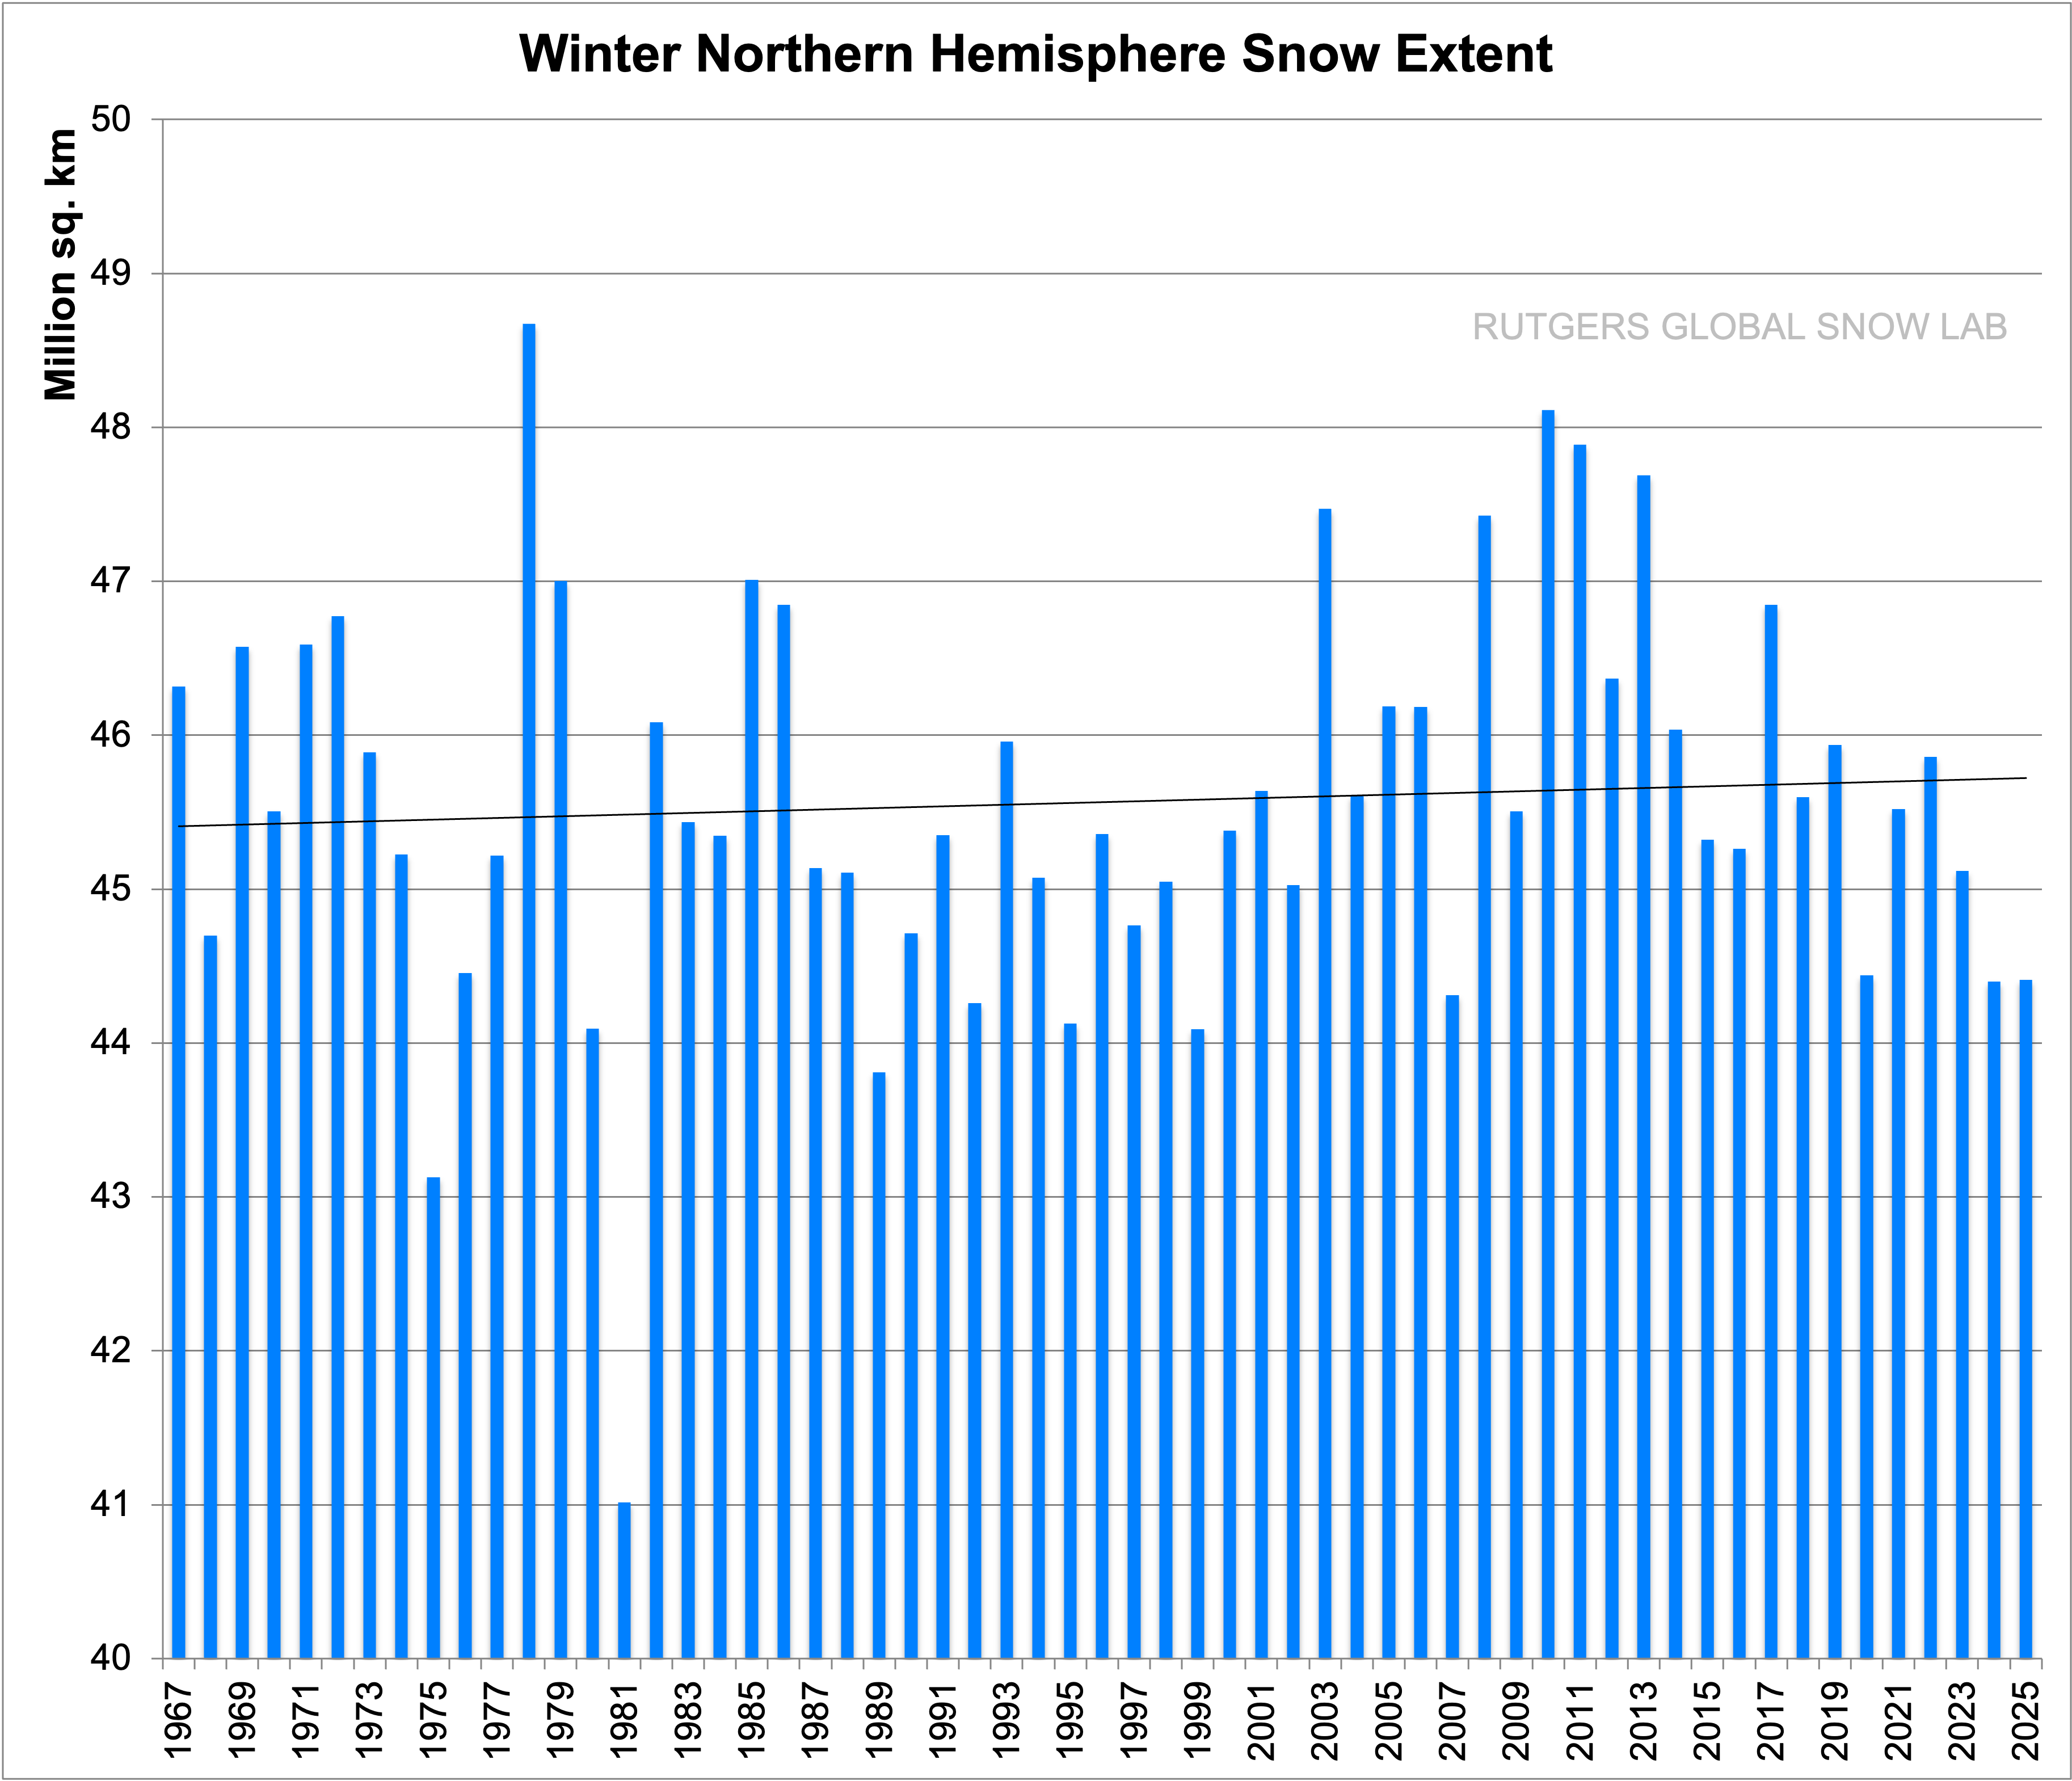
“As the oceans of the NH continue to warm, the snowfall will continue to increase.”
NH snowfall has been declining since the 1960s:
Most clouds are a collection of tiny water droplets or ice crystals, meaning they are primarily composed of liquid water, not the gaseous water vapor which is invisible to the naked eye; however, the composition of a cloud can vary depending on the altitude and temperature, with higher clouds often containing more ice crystals than lower ones.
70% to 80% of clouds are NOT in the upper atmosphere and do NOT containing ice crystals
The maximum snow cover extent has been trending up since the records started:
And Greenland permanent ice cover has been increasing due to its proximity to ocean water.
 ?ssl=1
Greenland will have permanent 100% ice cover by the end of this century..
So mostly unchanged over known readings….
It looks to me like a major change took place about 1987, not in the 1960s.
Certainly nothing that could be sanely attributed to slowing increasing atmospheric CO2 !
Very nice Vijay, this is really important.
This is an unnecessary deflection. A complex combination of basic facts tells us why CO2 increases do not cause any warming. The greenhouse effect of well mixed GHGs maxes out after the main absorption bands are saturated.
The warming isn’t large but nevertheless the source is known. Try this:
http://www.co2science.org/articles/V24/sep/a2.php
There are two effects after saturation is reached.. A small warming effect from the edges of the main absorption window and a small cooling effect over the water vapor bands due to a reduction in high altitude water vapor.
“A small warming effect . . .”.
No warming effect at all. Just more irrelevant word salad. Adding CO2 (or gaseous H2O) to air changes its temperature not at all.
Sorry to burst your bubble.
I walked outside. I left an environmentally controlled facility and entered into a non-greenhouse environment. Inside was more akin to a greenhouse than outside by a long shot.
Experts agree that modeling clouds is Too Hard.
Everything in nature seeks equilibrium. Everything! Once equilibrium is achieved the only difference is the impact from what was added or removed. Simple logic.
if this were not the case we would already be in some amplification affect and we wouldn’t to add CO2 to do it. Adding water vapor would be sufficient to create amplification.
If these models assume amplification they are wrong. Period. The models would defy simple logic.
“Everything in nature seeks equilibrium.”
No. Chaos rules – there is no seeking equilibrium, or reversion to the mean. As Feynman said nature seems absurd from a commonsense view, but that’s how it is.
Chaos is the process of seeking equilibrium. And yes, climate is chaotic beyond anything we can comprehend. We know that CO2 warming decrease at an increasing rate (I think I said that correctly). Amplification is not plausible for if it were we would already be Venus.
And yet with all that atmospheric turbulence and chaos, balloon data analysis shows that the pressure gradient is absolutely linear with molecular density.
Consistent with the Gas Laws being the ultimate control on the atmosphere.
“Chaos is the process of seeking equilibrium.”
No it’s not. That’s why it’s called chaos. The simplest example I can think of is the logistic map, based on xn+1 = rxn(1−xn). (The n parameters need to be subscripted, of course.) The function used to create a Mandelbrot set is similarly simple.
At the transition to chaos, no minimum value can be stated – there is always a smaller difference between chaotic and non-chaotic behaviour to be found.
In practice, this means that future climate states are impossible to predict. If you don’t care for chaos, quantum physics arrives at the same result, as Richard Feynman described in one of his lectures.
No equilibrium. No CO2 warming, even. Adding CO2 to the atmosphere doesn’t change its temperature.
Chaos means it is non-deterministic, that basic relationships are not defined, and as such no predictions or projections or extrapolations are valid.
Sparta,
No, a fully deterministic system may exhibit chaotic behaviour – contrary to what many scientists (not just “climate scientists” think. As others have put it, where the present determines the future, but the approximate present does not determine the approximate future.
However, if you don’t like chaos, quantum physics leads to precisely the same outcomes. At base, the uncertainty principle states (and is backed by the most rigorous experiments in the history of the universe), that one cannot establish the position and speed of a particle simultaneously. Contrary to common sense, but fully supported by experiment.
It doesn’t really matter, does it? Adding CO2 to air does not make it hotter. No GHE, and the future is unknowable.
Everything in nature seeks equilibrium. That is true. What is also true is that chaos prevents it from happening.
Sparta,
Well, I suppose that if you define equilibrium as a state of maximum entropy, aka the heat death of the universe, then you are probably right.
In any other case, you are definitely wrong. Maybe you could look at the results of the famous “two slit” experiment, and tell me again about equilibrium. It certainly doesn’t seem to apply at the quantum level.
Not relevant to the non-existent GHE, in any case.
…and for those out there that think you can actually do something about this you need to get another hobby. We are all along for the ride on Earth, get used to it.
Unlike CO2 being confined to miniscule radiative band, clouds (water) undergo phase changes with immediate sensible heat impacts.
As usual, Vijay Jayaraj’s articles are among the most informative on this site, and that’s saying a lot since WUWT consistently provides outstanding clarification of climate and environmental issues.
“While CO2 undoubtedly has a warming effect, . . .” – which nobody has managed to demonstrate by means of reproducible experiment.
Adding CO2 to air does not make it hotter. Removing CO2 from air does not make it cooler.
Just a widespread fantasy for preschoolers and the gullible.
What Michael Flynn said ! ^^^
CO2 has a miniscule effect in that its Cp is different than air, meaning a joule will raise the temperature by a minute fraction of a degree given the relative concentrations.
CO2’s mass is larger than air so will the mass override the Cp lowering?
They were also working out what the climate sensitivity is when they include average cloudiness. Clouds cover 2/3 of the planet so it is therefore a very important consideration!!
Their earlier work (e.g Wijngaarden and Happer 2020) shows that the climate sensitivity ranges from a feedback free 1.4K to 2.3K when they include the maximum possible water vapour feedback assuming a constant relative humidity.
The study however is only for clear skies. Since then they have worked on clouds and Wijngaarden has mentioned on the Tom Nelson #56 William Van Wijngaarden “Is Global Warming Hot Air” podcast at 1:03:45 that clouds reduce CO2 forcing from 3 W/m2 to closer to 2 W/m2.
This means that the feedback free sensitivity will become 1K and with the above mentioned water vapour feedback will become 1.6K.
However the water vapour forcing will also become about 30 percent less. The 0.6K feedback response from the above will become 0.4K. The climate sensitivity range will become even smaller at 1 – 1.4K.
It will be interesting to eventually see their updated work on climate sensitivity that includes clouds.
“They were also working out what the climate sensitivity is . . . “
The problem is that “climate sensitivity” is meaningless word salad.
Climate is the statistics of weather observations. Once calculated, it is just numbers, sensitive to nothing at all.
Maybe “climate scientists” believe that CO2 added to air makes it warmer, but are too sensible to say such a silly thing! Hence, they use “climate sensitivity”, knowing that nobody can realistically contradict such a meaningless and indefinite phrase.
Quite funny, really.
Never assume anything. We do not know what effect human CO2 has/will have. At the moment is it undetectable.
“At the moment is it undetectable.”
So true…. 45 years years of reasonable quality atmospheric measurements, and…
… nada, nil.. zip !!!
The purveyors of climate models used to justify the attacks on hydrocarbon fuels must, by now, have realised the enormity of the consequences of their work. I have not yet seen an author admit that his/her model might not be accurate enough to guide political policy. Some people like Dr David Evans, partner of the owner of the Jonova science blog, withdrew from such research early in the piece. A few others might have acted similarly.
It is time for a review. Current authors should be asked if they wish to continue to have their research used for policy direction, or if they wish to continue with research that is unpublished so that it cannot be used for policy.
Those who choose to continue must be made aware that their work will be examined by peers. Errors will require correction by the authors. Refusal to correct errors must lead to legal charges like knowingly making false statements, making reports with inadequate expression of uncertainty, or just plain fraud.
Geoff S
Thanks Vijay for an excellent straight forward overview.
Let us hope even the politicians, who seem to have a very limited capacity for science understanding, get the point you are making.
Maybe we should adopt their language their simple style of campaigning?
“It’s the clouds, stupid”
Contemporary vision of clouds:
We’ve spent the last 50 years removing SO2 from fossil fuel emissions. Has that decreased cloud cover and caused some warming? How much?