From the “who whooda thunkit?” department and NASA Goddard come this bit of obvious science complete with a picture proudly proclaiming “it’s hot and dry in the desert.” Government “science” at its best.
By Madeleine Gregory
NASA’s Goddard Space Flight Center, Greenbelt, Md.
As any urban dweller who has lived through a heat wave knows, a shady tree can make all the difference. But what happens when there’s no shade available?
A recent study in Nature Communications used NASA satellite data to identify a major gap in global resilience to climate change: cities in the Global South have far less green space — and therefore less cooling capacity — than cities in the Global North. The terms Global North and Global South were used in the study to distinguish developed countries (mostly in the Northern Hemisphere) from developing nations (mostly in the Southern Hemisphere).
Cities tend to be hotter than nearby rural areas because of the urban heat island effect. Heat-trapping dark surfaces such as sidewalks, buildings, and roads absorb heat from the Sun’s rays, which raises the temperature of the city. Extreme heat poses serious health threats for urban residents, including dehydration, heat stroke, and even death. Though not a cure-all, greenery provides shade and releases moisture into the air, cooling the surroundings.
“Cities can strategically prioritize developing new green spaces in areas that have less green space,” said Christian Braneon, a climate scientist at NASA’s Goddard Institute for Space Studies in New York who was not affiliated with this study. “Satellite data can be really helpful for this.”
An international team of researchers led by Yuxiang Li, a doctoral student at Nanjing University, analyzed the 500 largest cities in the world to compare their cooling capacities. They used data from the Landsat 8 satellite, jointly managed by NASA and the U.S. Geological Survey, to determine how effective green space was at cooling each city.
First, they calculated the average land surface temperature for the hottest month of 2018 for each city, as well as the average of the hottest months from 2017 to 2019. Next, the researchers used a metric called the Normalized Difference Vegetation Index (NDVI) to map how much green space each city had. The NDVI relies on the fact that healthy vegetation absorbs red light and reflects infrared light: the ratio of these wavelengths can show the density of healthy vegetation in a given satellite image.
Researchers found that cities in the Global South have just 70% of the greenery-related cooling capacity of cities in the Global North. The green spaces in an average Global South city cool the temperature by about 4.5 F (2.5 C). In an average Global North city, that cooling capacity is 6.5 F (3.6 C). This compounds an existing problem: cities in the South tend to be at lower latitudes (that is, nearer to the Equator), which are predicted to see more heat extremes in the coming years.
“It’s already clear that Global South countries will be impacted by heat waves, rising temperatures, and climatic extremes more than their Global North counterparts,” said Chi Xu, a professor of ecology at Nanjing University and a co-author of the study. The Global South has less capacity to adapt to heat because air conditioning is less common and power outages are more frequent.
Why do cities in the Global South struggle to stay cool? Cities in the Global South tend to have less green space than cities in the Global North. This mirrors studies of the disparities within cities, sometimes referred to as the “luxury effect”: wealthier neighborhoods tend to have more green space than poorer neighborhoods. “Wealthier cities also have more urban green spaces than the poorest cities,” Chi said.

It’s unlikely that urban planners can close the gap between the study’s worst-performing city (Mogadishu, Somalia) and the best-performing one (Charlotte, North Carolina).
Mogadishu is a dense city with a dry climate that limits vegetation growth. Still, there’s a lot that each city can learn from its neighbors. Within a given region, the researchers identified the city with the greatest cooling capacity and used that as a goal. They calculated the difference between the best-performing city in the region and every city nearby to get the potential additional cooling capacity. They found that cities’ average cooling capacity could be increased substantially — to as much as 18 F (10 C) — by systematically increasing green space quantity and quality.
“How you utilize green space is really going to vary depending on the climate and the urban environment you’re focused on,” said Braneon, whose research at NASA focuses on climate change and urban planning.
Greener cities in the U.S. and Canada have lower population densities. However, fewer people per square mile isn’t necessarily good for the environment: residents in low-density cities rely more on cars, and their houses tend to be bigger and less efficient. Braneon noted that there’s a suite of solutions beyond just planting trees or designating parks: Cities can increase cooling capacity by creating water bodies, seeding green roofs, and painting roofs or pavement lighter colors to reflect more light.
With a global study like this, urban planners can compare strategies for cities within the same region or with similar densities. “For newly urbanized areas that aren’t completely built out, there’s a lot of room to still change the design,” Braneon said.
This has to be stopped! We need that heat to keep the gravy-train going. /sarc Or is it?
I’m sure the concern of the people of Mogadishu is about green spaces.
For a while there, they were mostly concerned about Blackhawks falling on their roofs.
The Lovin’ Spoonful knew this back in 1966 –
Hot town, summer in the city
Back of my neck gettin’ dirty and gritty
Been down, isn’t it a pity?
Doesn’t seem to be a shadow in the city
All around, people lookin’ half dead
Walkin’ on the sidewalk, hotter than a match head
And Mungo Jerry.
The background for the song Summer in the City is very interesting, beginning with principal writer’s younger brother Mark. See “background and composition” at the page for the song: Summer in the City (song) – Wikipedia
I live in Las Vegas, Nevada. The growth of green vegetation in the desert requires prodigious amounts of very expensive water (irrigation). Good luck funding green spaces in the Third World deserts.
There’s always desert vegetation- in spaces reserved for that- rather than more buildings and parking lots.
Yes, just making sure that buildings cannot completely cut off moderating breezes from the surrounding countryside will help.
Green spaces in cities are nice- regardless of the climate issue.
Gustave Eiffel understood this, and advocated making it a part of urban planning, 140 years ago. I was contacted a couple of years ago by a journalist who had notice I was the only member of Clintel in my home state. Since Clintel was advocating there is no climate crisis, he asked for my take on heat waves.
It was pretty easy to point out that observations of climate news reveals that these crisis heat waves impact mainly large cities. An average warming of a degree centigrade during the past century cannot produce excessive heat in any significant way. How we build and layout cities is almost entirely the culprit.
This study was a waste of money, the CAGW crowd has nothing to support their claims.
London has many parks, commons and green corridors. In fact, I believe Barcelona bought into that.
They provide… shade.
and shady characters?
Naturally.
No sh!t, Sherlock
Comparing Mogadishu 2N and Charlotte NC 35N doesn’t seem a like for like comparison to me. Lilongwe Malawi at 34S might be closer to Charlotte.
ROFLMAO, sounds like urban studies 101 !!
Trees in urban areas help cooling .. WOW !!!!!
How does something like this ever get published except as a junior high school science project !
It was probably done as part of a grant from a government.
Hey, at least they didn’t come out and blame the racist, colonizing, domestic terrorist urban planners for this discrepancy! You know they wanted to but apparently some of the authors who tried suffered serious back and joint injuries!
Reminds me of pleasant walks along the Elm-shaded streets of Manitowoc, WI, when I visited my grandfather as a kid. Sadly, the vast majority of those Elms were wiped out by Dutch Elm Disease in 70s and 80s.
So how do we explain the fact that the ‘pristine’ USCRN data are currently warming faster than the adjusted ClimDiv data in the US? The link is in the side bar of this site.
The ClimDiv adjustments seem to be cooling the urban data by too big a factor.
Again your absolutely ignorance shines like a sick ooze. !
ClimDiv is a series ADJUSTED TO MATCH USCRN.
They actually say so on their own web site that..
… it is homogenised to “pristine” stations on a regional basis to REMOVE URBAN BIAS.
It is not real data.
Not ” adjusted”. ” Value added”. According to a Mr. Jones.
And yes, it took them a while to get the “adjustment” correct.
ClimDiv started a bit high, and they have honed in the “adjustment” so that over the last decade or so the the trends have been basically parallel.
Lots of data floating around from government sites. Perhaps this graph, among many other rural states will rain on your parade. Care to explain exactly where the warming is in this graph or any of the other very rural states?
Do you expect things to remain static? That would truly be bad.
Those who speculate about past heatwves need to do the mathematics. There is a misconception that the properties around a city, like vegetation and concencrete cover, are major factors about how hot the heatwave gets.
In reality, the heatwaves – especially in coastal cities – often form in a hot inland before being taken by local climate wind factors to the cities. It is misleading to attribute the heat of a heatwave to these local features of the city, when the hot work can be done 1,000 miles away in a desert, a day or two before the heatwave moves over the city.
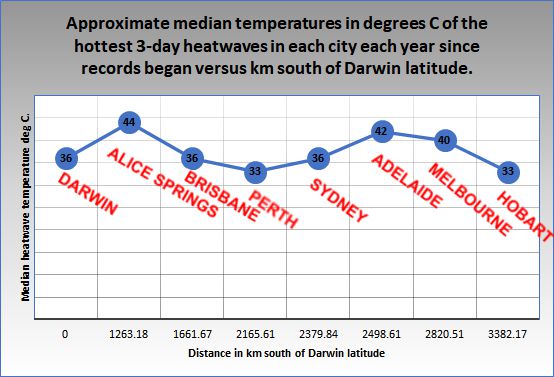
The influence of latitide is likewise complicated, here is a figure showing the average temperatures of heatwaves in some major Australian cities, most coastal, with an unexpected relation to (here) distance south of Darwin, which is closest to the Equator.
Summer winds from the south are not a major factor bringing heatwaves from the hot desert centre to Darwin. More often, prevailing winds take hot desert air from the centre (near Alice Springs )to the south (to Adelaide) and S-E (to Melbourne).
This, irrespective of city vegetation, the hottest 3-day heatwaves shown are not much related to latitude, vegetation or concrete compared to weather patterns from the dry centre. Geoff S