From Dr. Roy Spencer’s Global Warming Blog
by Roy W. Spencer, Ph. D.
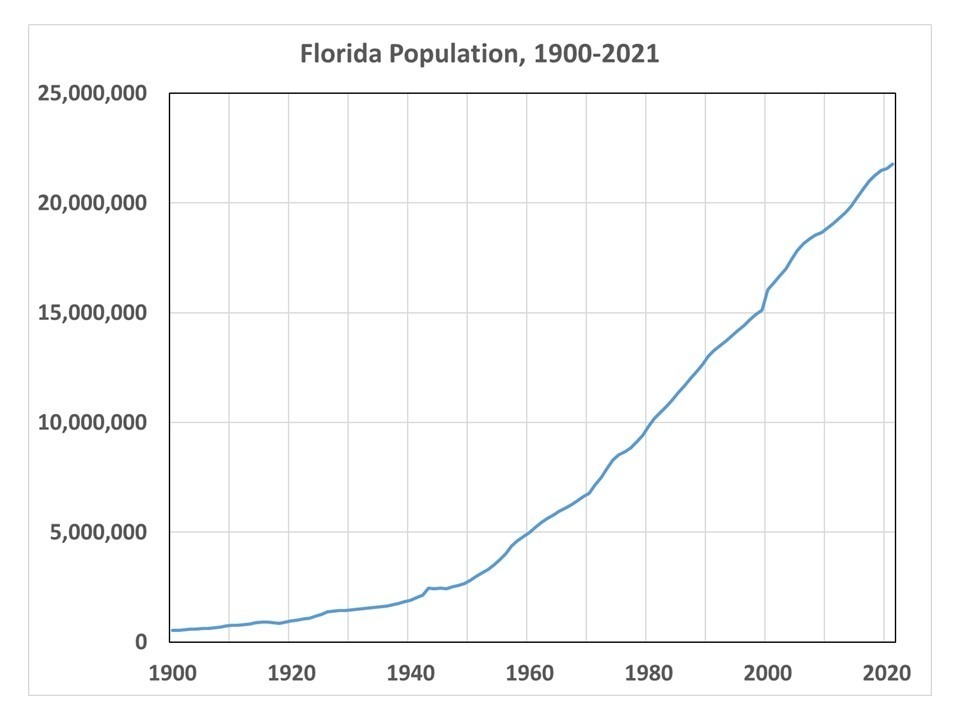
Florida residents must feel like they have been taking a beating from major hurricanes in recent years, but what do the data show?
The problem with human perception of such things is that the time scale of hurricane activity fluctuations is often longer than human experience. For example, a person born in the 1950s would have no memory of the beating Florida took in the 1940s from major hurricanes (a total of 5). But they would have many memories of the hurricane lull period of the 1970s and 1980s, each decade having only one major hurricane strike in Florida. Then, when an upswing in hurricane strikes occurs, it seems very unusual to them, and they assume that “hurricanes are getting worse”.
Another problem is that any statistics for an area as small as Florida, even over 100+ years, will be pretty noisy. Landfalling hurricanes for the eastern U.S. would be a better metric. And statistics for the entire Atlantic basin would be even better, except that satellite coverage didn’t start until the 1970s and hurricane intensity in remote areas before then would be poorly measured (or not measured at all).
Finally, tropical cyclone statistics for the entire tropics would be the best (if one was trying to determine if climate change is impacting cyclone intensity or frequency). But satellite data for the global tropics is, again, limited to the period since the 1970s. Global tropical cyclone data before the 1970s is sketchy, at best.
So, keeping in mind that any trends we see for Florida are going to be strongly influenced by the “luck of the draw” and the quasi-random nature of hurricane tracks (hurricanes are steered by the large-scale flow of air in the mid-troposphere, say around 20,000 ft altitude or so), what are the statistics of Florida major hurricane intensity and frequency since 1900?
Florida Major Hurricane Intensity & Number
The following plot shows the intensity of major hurricanes (100 knots or greater maximum sustained wind speed) striking Florida since 1900, updated through recent (2024) Hurricane Helene:

As can be seen from the linear trend line, there has been no significant trend in the intensity of major hurricanes striking Florida since 1900.
But what about the number of hurricanes? The next plot shows there has been a weak upward trend in the decadal totals of major hurricanes striking Florida since 1900:

Note that the 2020s number might well increase, since the end of the current (2024) hurricane season will be only half-way through the 2020s. While Hurricane Milton has just been classified as a major hurricane, in 2 days time it is expected to be under increasing wind shear, so it is not obvious it will strike Florida as a major hurricane, and so I did not include it in the above charts.
Another feature of the second chart above shows that a native Floridian born in the 1960s or 1970s would indeed have experienced an increase in major hurricanes striking Florida during their lifetime. But their first couple of decades of personal experience would have occurred during a historic lull in hurricane activity.
Why Start In 1900?
There is reason to believe that the number and/or intensity of major hurricanes striking Florida in the early 1900s has been underestimated, which would bias the trends in the above plots in the upward direction, spuriously suggesting a long-term increase in activity. First of all, there were virtually no people living in Florida in 1900. The population of Miami in 1896 was 444 persons. The intensity of a hurricane is based upon its maximum sustained 1 minute windspeed, which usually covers a very small area. Even with people now inhabiting much of the Florida coastline, it is rare for a coastal anemometer to measure the intensity that the National Hurricane Center gives to a hurricane, because those winds cover such a small area. So, how could it ever be known how intense some hurricanes were in the early 1900s?
Evidence for Long-Term Hurricane Fluctuations Unrelated to Water Temperature
Modern concern centers on the possibility that warm sea surface temperatures from global warming caused by anthropogenic CO2 emissions is making hurricanes stronger or more frequent. But studies of coastal lagoon sediments along the Gulf coast and Caribbean deposited by catastrophic hurricane landfalls show large fluctuations in activity on centennial to millennial time scales, even in the absence of the unusually warm sea surface temperatures measured today. (Example here.)
It should also be remembered that not long ago the U.S. experienced an “unprecedented” 11-year drought in major hurricane strikes. That significantly impacts our perception of what is “normal”. When the lull had reached 9 years, a NASA study found such an event was a 1-in-177-years occurrence. As I recall, that was increased to 1-in-250 years when the lull reached 11 years.
The point is that there is a huge amount of natural decadal- to centennial-time scale variability in hurricane activity in Florida (or any other hurricane-prone state). But with increasing numbers of people thinking that the government is somehow influencing hurricane activity (I’m seeing a lot of this on Twitter), I doubt that actual data will have much influence on those people, and as I approach 70 years on this Earth I have noticed a long-term decline in critical thinking regarding weather, climate, and causation. I doubt that trend will change any time soon.
They say this….
The record is quite variable, and the quietest period was during the global cooling scare.
No lines at Disney World.
I am pretty sure there haven’t been lines as Disney World since bearded men with beer bellies have been performing as Disney “princesses”!
Now, lets see a graph of the 1900-2024 trend in hysteria about weather events. I suspect there will be a hockey stick starting about 2006, right after the movie “An Inconvenient Truth” was released.
Sorry for the blurry image.. I’m still searching for a better one.
From the original paper
Thanks 🙂
[Chand et al. 2022] is interesting. They say “we show robust declining trends in the annual number of TCs” and that the “general consensus from observationally based records suggest an increase in the proportion of severe storms with anthropogenic-induced warming”
[IPCC AR6 WGI section 11.7.1.5] is interesting. They say “the global frequency of TCs over all categories will decrease or remain unchanged” and “the proportion of Category 4–5 TCs will very likely increase globally with warming.”
I wonder how a few here on WUWT are going to take the news that the Chand et al. 2022 publication generally corroborates the IPCC hypothesis. For those who have an opinion or relevant commentary please chime in!
I don’t think that UN IPCC CliSciFi climate models are a reliable indicator of anything.
And yet Chand et al. 2022 provides observational evidence that they are.
IPCC projections….. ROFLMAO !! crystal balls.. cracked.
And if overall total decreases, and high Cats remain the same, then yes..
“the proportion of Category 4–5 TCs will very likely increase”
Basic maths.
The thing that climate models say will happen appears to be happening yet we still insist that climate models are wrong 🤔
From what you are quoting, they are saying that there will be a larger proportion of severe storms of an overall smaller number of tropical cyclones (TCs), which still can mean fewer severe storms annually. For example, 5 severe storms out of 20 TCs is 25%. If you only have 8 TCs, you only need 3 severe ones to reach a higher proportion at 37.5%. Always beware of comparing percentages of small numbers!
You’re unlikely to see articles and charts like this in the mainstream media because they undermine the climate change=more violent storms theories so beloved by the eco-alarmists.
“… and as I approach 70 years on this Earth I have noticed a long-term decline in critical thinking regarding weather, climate, and causation.”
Me too! I’ll add reading comprehension to your statement.
Thanks Roy. Age wise, I have you beat by a decade. I remember in the mid-1970s, quoting either H. H. Lamb or Reid Bryson to the effect that “cold periods” brought more nasty weather than warm periods. I suspect this was meant for the mid-latitudes, say north of 40°; being 50 years ago I’m a bit fuzzy on that. Lamb was a UK academic, and Bryson was located in Madison, Wisc.
You probably would enjoy the following concerning language and critical thinking.
https://www.zerohedge.com/political/vance-made-case-erudition
regarding weather, climate, and causation.
That part can be left off. There’s a decline in critical thinking overall.
Current hurricanes are being exaggerated by using Satellite and aircraft data and comparing it to Ground data from the old days.
Milton is supposedly a Cat 5 hurricane downgrading to Cat 4 with 180 mph winds.
Take a look on Ventusky and NuSchool earth, they both show winds around 60-70 mph.
Helene landfall data from NWS show a 99 mph gust, not continuous speed.
https://notalotofpeopleknowthat.wordpress.com/2024/10/03/hurricane-helene-update/
Yes, the attached data from a hurricane hunter aircraft about an hour before Helene made landfall measures the max surface wind speed via SMFR at 104-106 mph:
I’ve had the unfortunate privilege of living through 3 hurricane eyewalls passing my location in SE Florida. Frances, Jeanne and Wilma. Frances’ eyewall was expanding and slowing as it passed my home, so we were in the eyewall for 22 hours at roughly 90 mph. Most definitely serious business and house stayed intact save a few shingles lost.
So I watch, cross check and take note of the predictions and lately the outright lies coming from the official sources. Back then some 20 years ago there was an interview the the NHC director, who admitted their official proclamations are somewhat of a black art. Models are often seriously divergent, so he has to take care and use experience, history, and gut sense, with the cross purpose of adequately warning people to take appropriate precautions. Cry wolf and no one will listen anymore to future warnings, and underestimate and you will be pilloried….
But since about 2017 they have gone the cry wolf route.
I don’t understand the hype about Hurricane Milton. Nowhere can I find the high numbers of sustained wind speeds over 150 mph.
Well you can see for yourself in the ADS-B data from TEAL71 last night, when they were saying officially it was 185 mph:
https://www.flightaware.com/live/flight/TEAL71/history/20241007/2326Z
Some notes on interpreting the data:
1) speeds are GROUND speed, via GPS
2) VA or maneuvering speed is the airspeed above which structural failure can occur in moderate to severe turbulence. This aircraft is flying a VA of around 245-255 mph based on portions of the track away from the storm.
3) the plane traverses the eyewall 4 times in this flight, evidenced by the sharp rising and falling of the groundspeed over short distances.
5)ignore the satellite image of the storm, it is shown at the last data point and the storm has moved substantially since the plane first encountered it. (menu at upper right, turn off Weather)
6 While we cannot know precisely what the relative wind direction was with respect to the aircraft heading (we know the plane’s heading exactly at each data point in the table below the image), the plane executes a 360 degree turn when it encounters the eyewall the first time. So it hits the eyewall, ground speed rises to 351 mph, turn commences and it drops to 270 mph, then rises again to 345 mph. We can infer that this turn was into the eye (to drop a sonde), and at some point in this 360 degree turn, the plane had a direct tailwind. If that is true, the wind speed in the eyewall at 10,000 feet above sea level was merely 110-120 MPH.
So the 185 mph official proclamation was made up.
If anyone wants to monitor these data, the aircraft call signs are TEAL71 and TEAL72. You can use FlightAware, ADS-B Exchange and I believe there is another public transponder tracking site.
The official intensity was never set at 185 mph. It was kept at 180 mph even though a dropsonde measured 185 mph and SFMR measured 204 mph.
Serious question…Why do you repeatedly post disinformation like this?
NOAA2 mission 10 dropsonde 4 reported 185 mph.
AF309 mission 8 SFMR reported 204 mph.
Milton was a category 5 by a wide margin and is now the 5th most intense cyclone in the Atlantic Basin in terms of pressure at 897 mb.
So why would a place like earth.nullschool.net have totally different wind speeds ?
It is because they use the GFS analysis. The GFS uses a C768 cubed sphere grid mesh. This means there are 6 * 768 * 768 grid cells to cover 510000000 km^2 of surface area. So each cell represents ~144 km^2. Milton’s eye had a surface area of only ~25 km^2 at its peak and well below the model resolution. Further still the website must then take an already downscaled and unresolvable eyewall feature and downscale it even further for display. Even now with Milton’s much larger eye you can see the low resolution modeling artifacts on the website. Notice how the eye is represented as 4 noncontiguous focal points in each quadrant expanding into 4 isosceles triangles the further away from the eye you go. When zoomed out you see a reasonably accurate depiction of the broader wind speed. But when zoomed in you see an unrealistic horizontal structure missing the finer details like the eyewall structure and its associated band of maximum wind.
Story Tip These reports need investigation by climate researchers:
Project Cirrus initiated 1947 by US military partnered by General Electric, declassified. Theory: change temperature outside eye-wall of hurricane by seeding clouds (e.g. silver iodide) to decrease strong winds. Oct 13 1947 P.Cirrus targeted hurricane heading out to sea, 180lbs dry ice dropped into clouds. Hurricane changed direction, made landfall on Savannah, Georgia. Public blamed government. Irving Langmuir, head of GE’s Atmospheric Research Dept., admitted Project Cirrus’ purpose was weaponization of weather, and change of hurricane direction. Govt. denied for 12 years. Project was resumed. 1965 Project Storm Fury targeted Hurricane Betsy for seeding. Storm changed direction, made landfall south Florida. Congressional hearings blamed Project Storm Fury: Govt.claimed hurricane changed direction before seeding done. Project resumed after 2 months of congressional hearings. 1967 US Defense Secretary Cohen admitted have technology to control weather, including earthquakes and volcanic activity.
We have come a long way, baby!
Hurricane Betsy was NOT seeded, because it changed direction. It never entered the Project STORMFURY area where seeding was allowed, so the experiment was called off. The Project Cirrus hurricane had already changed course before the seeding experiment, but researchers didn’t find this out until later. In 1969, Hurricane Debbie WAS seeded, on two non-consecutive days. This was the best executed of the four STORMFURY experiments. Debbie did NOT change course.
The only thing that Cirrus or STORMFURY accomplished was to fuel conspiracy theories from now until Kingdom come.
Roy Spencer,
I am glad you have presented some of your vast knowledge about weather, as it relates to Florida hurricanes
I did not know Miami had only 444 people in 1896.
At that time, Florida was largely forested
A hurricane could come and go, and hardly anyone would know about it, or be affected.
It is likely there were no wind speed gauges, as there are to-day, so, basically, any statement about hurricanes in the early 1900 is totally guesswork.
The error bands of the scarce data at that time are huge, compared to to-day
We need to emphasize this to fact check/prevent any scare-mongering by the usual suspects
I lived through Camille (1969), that hit the Mississippi coast. That was a bad storm! Ships and barrages were pushed to the inland side of US 90. The storm downgraded moved to Virginia were it claimed more lives because of heavy rainfall.
In my line of work, verification is EVERYTHING. In my line of work, everything is verified by a “second set of eyes” including my own work.
Unfortunately, although this article is highly credible, I have no way to independently verify any of it.
I can not trust media. I have sadly learned that peer reviewed research can not be trusted. Even NASA and NOAA data are suspect (and I can not verify that data, regardless).
Then there is the little bit of how to know when a politician (or politically oriented spokesman) is lying? His comments are published in the NYT. No need to see his lips.
So what do we do? How can we, as pragmatic scientists, find the truth?
So , if Tampa gets a bad hit and Harris/Walz screw up again , will it be
Tampa Tim ?
😉
I have seen how most people live just one metre above sea level in Tampa. If a big one hits of course these houses will all be gone.
It is like building a city inside a river. It’s not If but When .
How do you know a politician is lying? His/her lips are moving…
The maximum sustained surface wind speed (peak 1-minute wind at the standard meteorological observation height of 10 m [33 ft] over unobstructed exposure) associated with the cyclone is the determining factor in the The Saffir-Simpson Hurricane Wind Scale.
How is this standard being upheld with wind speeds measured at altitude?
The Saffir-Simpson Hurricane Wind Scale
https://www.nhc.noaa.gov/pdf/sshws.pdf
An altitude correction factor is applied.
Milton is moving away from the Yucatan and growing in strength. At this point it is a very dangerous hurricane and will remain so when it reaches Tampa Bay.
A bit off topic but the NHC currently suggest Milton is a few miles north of the Yucatan Peninsula and has sustained winds of 135kts. Merida and Cancun airports currently report 16kt winds forecast to max out at 20kt gusting to 25kts. The forecast models GFS et al are saying 60kts when it hits Tampa. Why is this?
Pressure in the eye now 972 hPa.
The hurricane is in a 700 hPa jet current loop that pulls cold air from the north.
https://earth.nullschool.net/#2024/10/10/0400Z/wind/isobaric/700hPa/overlay=temp/orthographic=-103.75,34.58,810