From Dr. Roy Spencer’s Global Warming Blog
The Version 6 global average lower tropospheric temperature (LT) anomaly for September, 2024 was +0.96 deg. C departure from the 1991-2020 mean, up from the August, 2024 anomaly of +0.88 deg. C.

The linear warming trend since January, 1979 remains at +0.16 C/decade (+0.14 C/decade over the global-averaged oceans, and +0.21 C/decade over global-averaged land).
The following table lists various regional LT departures from the 30-year (1991-2020) average for the last 21 months (record highs are in red):
| YEAR | MO | GLOBE | NHEM. | SHEM. | TROPIC | USA48 | ARCTIC | AUST |
| 2023 | Jan | -0.04 | +0.05 | -0.13 | -0.38 | +0.12 | -0.12 | -0.50 |
| 2023 | Feb | +0.09 | +0.17 | +0.00 | -0.10 | +0.68 | -0.24 | -0.11 |
| 2023 | Mar | +0.20 | +0.24 | +0.17 | -0.13 | -1.43 | +0.17 | +0.40 |
| 2023 | Apr | +0.18 | +0.11 | +0.26 | -0.03 | -0.37 | +0.53 | +0.21 |
| 2023 | May | +0.37 | +0.30 | +0.44 | +0.40 | +0.57 | +0.66 | -0.09 |
| 2023 | June | +0.38 | +0.47 | +0.29 | +0.55 | -0.35 | +0.45 | +0.07 |
| 2023 | July | +0.64 | +0.73 | +0.56 | +0.88 | +0.53 | +0.91 | +1.44 |
| 2023 | Aug | +0.70 | +0.88 | +0.51 | +0.86 | +0.94 | +1.54 | +1.25 |
| 2023 | Sep | +0.90 | +0.94 | +0.86 | +0.93 | +0.40 | +1.13 | +1.17 |
| 2023 | Oct | +0.93 | +1.02 | +0.83 | +1.00 | +0.99 | +0.92 | +0.63 |
| 2023 | Nov | +0.91 | +1.01 | +0.82 | +1.03 | +0.65 | +1.16 | +0.42 |
| 2023 | Dec | +0.83 | +0.93 | +0.73 | +1.08 | +1.26 | +0.26 | +0.85 |
| 2024 | Jan | +0.86 | +1.06 | +0.66 | +1.27 | -0.05 | +0.40 | +1.18 |
| 2024 | Feb | +0.93 | +1.03 | +0.83 | +1.24 | +1.36 | +0.88 | +1.07 |
| 2024 | Mar | +0.95 | +1.02 | +0.88 | +1.35 | +0.23 | +1.10 | +1.29 |
| 2024 | Apr | +1.05 | +1.25 | +0.85 | +1.26 | +1.02 | +0.98 | +0.48 |
| 2024 | May | +0.90 | +0.98 | +0.83 | +1.31 | +0.38 | +0.38 | +0.45 |
| 2024 | June | +0.80 | +0.96 | +0.64 | +0.93 | +1.65 | +0.79 | +0.87 |
| 2024 | July | +0.85 | +1.02 | +0.68 | +1.06 | +0.77 | +0.67 | +0.01 |
| 2024 | Aug | +0.88 | +0.96 | +0.81 | +0.88 | +0.69 | +0.94 | +1.80 |
| 2024 | Sep | +0.96 | +1.21 | +0.71 | +0.97 | +1.56 | +1.54 | +1.16 |
The full UAH Global Temperature Report, along with the LT global gridpoint anomaly image for September, 2024, and a more detailed analysis by John Christy, should be available within the next several days here.
Lower Troposphere:
http://vortex.nsstc.uah.edu/data/msu/v6.0/tlt/uahncdc_lt_6.0.txt
Mid-Troposphere:
http://vortex.nsstc.uah.edu/data/msu/v6.0/tmt/uahncdc_mt_6.0.txt
Tropopause:
http://vortex.nsstc.uah.edu/data/msu/v6.0/ttp/uahncdc_tp_6.0.txt
Lower Stratosphere:
http://vortex.nsstc.uah.edu/data/msu/v6.0/tls/uahncdc_ls_6.0.txt
It’s been cold all year here in Scotland.
But you should love it. You should be unhappy if it warms up because that would be an emergency, a crisis. /s
Still mourning for your beloved Queen.
We’re still in an ice age. Sure, there’s been a wee bit more warmth in the Holocene, but it is still an ice age. Scotland may have a long wait for truly warm weather (Inverewe excepted).
But it could also be a mile of ice for the future what would have been normal for the last million years except for some short interglacial moments.
Here is the Monckton Pause update for September. At its peak it lasted 107 months starting in 2014/06. Since 2014/06 the warming trend is now +0.42 C/decade.
Here are some more trends that may be of interest to some.
1st half: +0.14 C.decade-1
2nd half: +0.23 C.decade-1
Since 1979: +0.16 C.decade-1
Last 10 years: +0.41 C.decade-1
Last 15 years: +0.39 C.decade-1
Last 20 years: +0.30 C.decade-1
Last 25 years: +0.23 C.decade-1
Last 30 years: +0.17 C.decade-1
The acceleration is now at +0.03 C.decade-2.
So what?
Anyway, moving on to more important questions –
has Don Rickles been resurrected and now identifying as Tim Walz ?
How about for the last 800 years, moron?
The UAH period of record starts in 1978/12.
So trends are meaningless for such a short period.
The trend over the period of record is +0.16 ± 0.06 C.decade-1. So there is enough meaning in this value to conclude that the UAH TLT layer has warmed at a rate of at least +0.10 C.decade-1.
why stop there. go back “6000” years and you have Noah’s “flood” in your armoury!!!!
It’s definitely of interest, because it’s further evidence that it has no relationship to carbon dioxide levels and the Keeling curve. Is that the point you were trying to make?
The point I’m making is that since the start of the Monckton Pause at its peak the warming rate as computed using Monckton’s procedure is now +0.42 C.decade-1.
So, nothing to do with carbon dioxide then. Thank you for playing. You will receive your participation award ……. whenever.
Yet another record broken! That is the warmest September in the record, ahead of 0.90C in 2023, and way ahead of the next – 0.46C in 2020. It continues a 15 month run of monthly records.
Yet another record broken!
Only it isn’t global, Nick.
“The Version 6 global average lower tropospheric temperature (LT) anomaly for September, 2024 was +0.96 deg. C…”
You do know (I hope) that the global average is dominated by the pacific ocean.
This jump is not CO2, but Hunga Tonga
Not Hunga Tonga. Here is a more up to date version of that plot. I’ve marked with red the period following the rapid temperature rise in UAH:
You can see the misalignment. There was no response for 18 months.
The wv increase looks like a lot in your graph, but that is because it is relative to a very small and stable long term humidity. The total tonnage of water emitted (~130 Mtons) is about what we emit in CO2 in a day.
“Helene delivered 42 trillion gallons of rainfall to the southeastern US — equivalent to the amount that would flow over Niagara Falls in th”
1514 trillion kg of water. So Hunga Tonga does not compute!
Eh?
Somebody should tell Dr Spencer that his “global” temperature data set isn’t global.
It isn’t global. It’s an average. The temp has been cool/cold here for the last 3 to 4 years. Much warmer in the 80’s and 90’s. Certainly not warming at the moment.
Yes, it’s a global average!
Dear me, the contortions you have to twist yourself into to be a climate ‘skeptic’.
Your “here” is not the global average.
These concepts are not difficult to grasp.
What you’re effectively saying is that, for example, someone who is above or below average height disproves the very notion of an average height.
Dear me, What is so difficult to comprehend about the warming being NOT GLOBAL?
This what strativarius was saying and he is correct.
That fact that you mention this (after having read my comment that it is, quote….. ”AN AVERAGE”) proves beyond any doubt that you are a moron.
You might just as well say there were no World Wars last century, as not every country was fighting.
It’s never been suggested that global warming means that everywhere warms at the same rate, or that there won’t be some parts of the globe that get colder as a result of the climate change. But at present looking at UAH data there are not many places on the globe that have cooled since 1979.
More than two years ago I did a sample of global stations that were as rural I could determine and calculated their cooling degree-day annual values over a twenty year interval. I found more stations that were either stagnant or cooling then were warming. It was my first clue that the the statistical analysis of the temperature data was misleading at best and outright wrong at best. It was a perfect tip-off that it was not global maximum temps that were an issue. I’ve not had the time or money to do a similar heating degree-day sampling but I suspect you would find that those values are going down – i.e. minimum temps are going up. That’s the only real explanation for global growth in grain harvests and for global increases in growing season length.
I have yet to see any climate science literature that supports the fact that rising minimum temperatures are a CAGW risk for the planet.
The entire concept of a “global average temperature” is useless. It is not holistic (i.e. considering *all* impacts) at all. It does not provide sufficient information to make *any* kind of educated judgement on what is actually happening with climate.
Ok. There were no World Wars last century, as not every country was fighting. Strativarius said it wasn’t global. TFN disagreed but he was wrong. No need to read anything more into it is there?
awesome, a warmer planet is a better planet! Thanks for the good news. 🙂
That’s right, it should be good news, but the people who want our Industrial civilization to collapse (Maurice Strong)… to go straight to the heart of capitalism and overthrow it. (George Monbiot) to intentionally change the economic development model that has been reigning for the last 150 years.(Christiana Figueres) and others: Al Gore, John Kerry, Barack Obama, Kamala Harris, …etc. have convinced way too many people that a warmer world constitutes a catastrophe. Kerry & Gore probably believe the sales pitch. The others have an agenda, it can’t be anything else.
Warmer planet, because of two NATURAL events, means more flora and fauna and more water vapor to grow it, and then more CO2
CO2 comes after warming, which means it has nothing to do with “warming”
This is not rocket science!
“CO2 comes after warming, which means it has nothing to do with “warming””
“nothing to do with” might need rewording.
Here is the rewording all rational scientists know
CO2 is not a special gas.
It is a weak absorber, mainly of low energy photons at 14.7 micrometer
Almost all surface protons get thermalized by abundant water vapor near the surface and by the extremely abundant N2 and O2 molecules near the surface
The absorption of surface protons is finished within 10 meters of the surface
CO2 is a trace gas, 420 molecules per million molecules of dry air
Its warming effect is trivial, less than 1% of any warming of the atmosphere
wilpost
Here’s what Copilot says about your truth telling. Great example of why the IPCC does everything possible to restrict and remove non-consensus hypothesis. AI can’t report on what isn’t there. Sad.
Copilot: (copy/paste)
Let’s break down the points you’ve mentioned:
.
In summary, while some of the points you’ve mentioned contain elements of truth, the overall assertion that CO2’s warming effect is trivial and that it is a weak absorber is not accurate. CO2 plays a significant role in the Earth’s climate system.
Does this help clarify things for you?
1
courses.seas.harvard.edu
2
news.climate.columbia.edu
3
courses.seas.harvard.edu
4
news.climate.columbia.edu
5
http://www.climate.gov
6
http://www.climate.gov
7
news.climate.columbia.edu
8
news.climate.columbia.edu
9
news.climate.columbia.edu
The warming effect of CO2 doesn’t seem to work on Mars. Mars has got 95% CO2 and an average temperature of -65C.
Nailed it
I specifically mentioned surface photons being totally thermalized within 10 m
Photons emitted at higher, colder, less dense atmosphere have wavelengths greater than 14.8 micrometer, and are beyond the absorption window of CO2 no matter where it is in the atmosphere, but not beyond the many large windows of WV.
.
From
CARBON DIOXIDE: A POLLUTANT KILLING US ALL, OR THE FOOD OF LIFE? YOU BE THE JUDGE.
https://www.windtaskforce.org/profiles/blogs/carbon-dioxide-a-pollutant-killing-us-all-or-the-food-of-life-you
.
Photons have energy, but no mass, move at the speed of light in a vacuum.
At 15 C, about 7% of photons emitted by the surface have wavelengths of 14.8 micrometers, which can be absorbed by abundant water vapor, 15000 ppm near the surface, and by much scarcer CO2, 420 ppm near the surface.
.
Abundant WV can also absorb surface photons of different wavelengths, from 2 to 30 micrometers, via many of its large windows.
.
Scarce CO2 can absorb surface photons of different wavelengths, but at a much lesser level, because CO2 has fewer and smaller windows than WV.
.
The remaining surface photons, less than 93%, thermalize by collisions (disappear by transferring their energy) with hugely abundant air molecules near the surface, thereby warming the air and WV by conduction near the surface.
.
The slightly warmed air and warmed water vapor rise, expand (become less dense) and cool as they rise (at about 5.5 – 6 C/km, with stable conditions, up to 9 C/km with unstable conditions), and usually form clouds starting at about 2000 meters.
.
Any re-radiation photons in all directions by the atmosphere will be at greater than 14.8 micrometer, beyond the major CO2 window, but not beyond the WV windows.
.
But WV ppm significantly decreases at higher elevations. The upshot is those photons are thermalized by collisions with abundant air molecules.
.
The warming and rising process continues after the sun sets, until it reaches a low-point at about 5 am, after which it starts over again, as the sun rises
.
As the sun rises:
.
1) its high energy photons slightly warm to air above any ground fog. These photons thermalize by collision with air molecules. The warmed air emits low energy photons in all directions.
2) then, its photons slightly warm any ground fog. The warmed fog rises and emits low energy photons in all directions at longer wavelengths
3) then, its photons warm the surface after penetrating any remaining fog. The surface emits low energy photons, that are thermalized less than 10 m off the surface
.
O2 and N2, together more than 99% of the atmosphere, absorb energy from low energy photons more weakly than CO2 and CH4
They do not have a negligible role in Earth’s greenhouse effect, because N2 is 2000 times more abundant, and O2 is 550 times more abundant, than CO2.
Based on basic physics, no special role can be assigned to CO2, or any of the trace gases.
.
Every day, we have global warming and cooling of the surface of 10 to 20 C; see your outdoor thermometer.
.
These URLs have more detailed information
https://www.windtaskforce.org/profiles/blogs/hunga-tonga-volcanic-eruption
https://www.windtaskforce.org/profiles/blogs/natural-forces-cause-periodic-global-warming
Copilot
So, while N2 and O2 are abundant, their impact on the greenhouse effect is negligible compared to the trace gases that are specifically responsible for trapping heat in the atmosphere7.
1
scied.ucar.edu
2
scied.ucar.edu
3
scied.ucar.edu
4
agupubs.onlinelibrary.wiley.com
5
science.nasa.gov
6
http://www.c2es.org
7
scied.ucar.edu
The absorption effects of N2 and O2, about 99% of the atmosphere, are ignored by the IPCC, but they are NOT negligible, and comparable to CO2 and other GHG, which are less than 1% of the atmosphere.
In any case, WV is the 800-lb gorilla regarding weather. It makes Helena winds and rainfall happen
The only reason there was so much rainfall in the Appalachians, is because the weather low was trapped, so rain kept falling on a relatively small area for 3 days at 4 inches per day, instead of dispersing over a much larger area..
In Connecticut, we had such a rainfall in the 1970s, which lasted for 10 days at 1 to 1.5 inches per hour, which did a lot of damage.
Correction: Inches per day
Hurricane Helene Update
https://www.windtaskforce.org/profiles/blogs/hurricane-helene-update
OCTOBER 3, 2024
By Paul Homewood
Water vapor is the 800-lb gorilla regarding weather. it makes Helena wind and rain happen already for many millennia.
Here are the rainfall data of the 3 days
AND it’s surface pressure is 6 to 7 millibars, which is about 160 times less than the pressure on Earth’s surface. This is because Mars’ atmosphere is very thin and tenuous giving plenty of room for LWIR to get through to space.
It also receives around 43% of the Earth’s solar insolation.
It does work on Mars; just with a much smaller magnitude than here on Earth. There are several reasons why the magnitude is smaller. The reasons include (but are not limited to) 1) a very thin atmosphere less than 1/100th that of Earth, 2) a spectral radiance in the 14-16 um band that is less than half what it is on Earth, 3) a feedback factor that is 1/3 that on Earth due to the scarcity of water. Despite these extreme limitations Mars is about 5 C higher than it would be otherwise due to the GHE.
You just had it answer the wrong question, but you knew that right?
Tell us what it does above pre-industrial levels of 280ppm, and please delete any phrase that starts with “could” to avoid further wasting of everybody’s time.
I don’t see any strong support for Copilot’s assertion that “CO2 plays a significant role in the Earth’s climate system.” Copilot has provided a list of non sequiturs that don’t address the claim. Just because someone/thing provides a list of true statements is not in itself logical support for a position.
The statement, “Doubling CO2 concentrations COULD raise global temperatures by 2-5 degrees Celsius” is lawyer language, not the language of science, which would be a probability of the event, along with the margin of error. That is, what is the probability that the increase might be as large as 2 deg C, and what is the probability that the increase might be as large as 5 deg C, particularly considering that some have made the case that the climate sensitivity to a doubling of CO2 is less than 1 deg C? Why does Copilot not mention the published research that comes to a different conclusion than what it presents? I see a big, fat thumb on the scale!
Agree, I’ve told Copilot they have a serious bias problem. In my first posting in this series I stated:
wilpost
Here’s what Copilot says about your truth telling. Great example of why the IPCC does everything possible to restrict and remove non-consensus hypothesis. AI can’t report on what isn’t there. Sad.
Copilot: (copy/paste)
Let’s break down the points you’ve mentioned:
blah, blah, blah parroting of the same drivel we’ve heard for 20 years
.
Proof of my position that the internet is being corrupted: Take a look at the references. The “consensus” findings overwhelm the sources for AI to pick up on :CO2 Coalition didn’t make the list. I report you decide.
1
scied.ucar.edu
2
scied.ucar.edu
3
scied.ucar.edu
4
agupubs.onlinelibrary.wiley.com
5
science.nasa.gov
6
http://www.c2es.org
7
What lunatic would want a colder September? Here in New England, it was mostly in the ’70s F with cool nights. But, I should be fearful of a climate emergency which my whack job state government claims? Sure, a hot mid summer is tiring but the rest of the year- let it warm up!
The GAT is a meaningless metric that tells nothing about “the climate”.
GAT is the climate religion’s equivalent of infinite genders.
It is whatever you want it to be.
And particularly regional climates.
When we fall back, then what?
Can you tell me the number for 1754 and 1963 Nick? If not, then your “record” is meaningless.
This is a good example of how the earth is warming. CO2 isn’t “warming” it, rather if it’s the main cause then it’s causing the earth to not cool after the warming from the El Nino event.
This will also be a good year to gauge its impact in crop yields and potentially global greening if anyone is still measuring that given its against the popular narrative.
Very scientific, Nick. A 15 month run of monthly records since ‘records began’. A great piece of clickbait for a popular newspaper, perhaps, but as a serious scientific claim?!
This reveals everything that’s wrong about climate science. Just look for sensationalist headlines, even if they’re meaningless. True randomness has what most people would claim to be ‘records’ all over the place.
We’re going to need data for many more years before such claims mean very much as far as climate timescales are concerned,
It’s just a basic fact.
In the UAH dataset, every month over the past 15 months has set a new warmest global average temperature record for that month.
If anyone is ‘claiming’ anything, then it’s UAH, with their continued record warm monthly updates that make further mockery of this joke of a website.
It’s actually becoming quite funny.
Evidence of human causation.
YOU HAVE NONE. !
Your juvenile and ignorant chicken-little comments are becoming more and more hysterical..
… and more and more hilarious.
Waiting for evidence of the “A” in front of GW..
Waiting, waiting. !!!
How?
In some circles, you have to be a US democrat party toady (even if you’re in the UK, or Australia, for example) or you don’t fit in. They find people who don’t fit in with their indoctrinated world view funny.
There but for the grace of God, go I.
Mr. Nail: I, for one, am pleased to amuse you, though I can’t take credit for the website. Isn’t life grand for you, that you can while away the hours on a joke?
BTW, a bit of advice- your “causation” theory would really be fortified if CO2 went up with the UAH temps. But CO2 emissions didn’t rise, did they? If only you had evidence of your causation claim, you could tell us about it. Until then, hope this helps- we think you’re funny, too!
You’ve completely missed the point.
Nobody’s denying it’s a basic fact, what’s ridiculous is claiming that it’s a fact with any significant meaning.
That is the warmest September in the (very short) record (compared to an arbitrarily selected comparison period)
It was 20C yesterday where I am and they are predicting 28C today. Time to head for the bunker as tomorrow’s prediction using a carefully selected linear progression will be 36C.
/sarc
And still absolutely ZERO EVIDENCE of any human causation. !
Surely not even Nick is DUMB enough to say the 2023 El Nino had any human causation.
Or that the WV in the stratosphere from HT eruption was human caused.
Maybe he is dumb enough….. we all know fungal spore is.
The Tongan eruption might have been human caused. Ever since the Christian missionaries arrived, nary a virgin has been sacrificed to the volcano god, who is now angry.
Stokes is not dumb, which makes his comments all the more despicable.
Yet another broken record.
NS sounds like a broken record….
But it still does not match the temperature projections of the climate models. We can expect temperatures to rise coming out of the Little Ice Age but it is not the catastrophe being proclaimed.
It’s matching reasonably pretty well. Here is the IPCC scenarios and predictions from 1990. If anything the IPCC may have underestimated the warming.
https://wattsupwiththat.com/2018/06/30/analysis-of-james-hansens-1988-prediction-of-global-temperatures-for-the-last-30-years/
In [Hansen et al. 1988] the authors say “Scenario B is perhaps the most plausible of the three cases.” And indeed it was. Actually if anything scenario B might still contain more forcing than what actually occurred as a result of the Montreal Protocol curbing emissions and the Pinatubo eruption. Based on that we’ll compare observations to scenario B. I have put dots on 2019 which is the limit of the Hansen et al prediction and the most recent year 2023. It’s not perfect, but it’s pretty close especially for a primitive model that is now 36 years old.
However, Scenario A is “Business as Usual,” and is running about 0.6 deg C warmer than the actual 2019 global average. As I pointed out in my linked analysis, which you ignored, Scenario B would be considerably higher were it not for the fact that Hansen assumed two major cooling eruptions, of which there was only one, in 1991. However, the real impact seems to be a subjective reset about 1997 which didn’t happen in the real world; thus there is no justification for it. It appears that his second subjective adjustment was in about 2016, when there was actually a strong El Nino. On the other hand, there were two strong El Ninos in the last twenty years, which nobody can predict and were not predicted by Hansen, which have increased the actual trend. In other words, it is shear luck that the recent temperatures are close to Scenario B. I think that your acceptance of Hansen’s predictions are based on what was largely luck, and not skill, and could thus be written off as not actually being science. It is not too different from turning off the A/C and opening the windows.
The authors simulated an El Chichon-like eruption in 1995 and an Agung-like eruption in 2015 for scenarios B and C. There were no volcanic eruptions simulated in scenario A. Note that Pinatubo resulted in more negative radiative forcing than both El Chichon and Agung combined [1] so if anything scenario B had slightly less negative volcanic forcing than what actually happened. Additionally scenario B did not consider the Montreal Protocol.
From 1988 to 2023 and compensating for the 4m lag the ONI averaged -0.04. So if anything ENSO would have reduced the trend albeit by an amount that is unlikely to be detectable. And I’ll remind you that the prediction starts with a strong El Nino.
Thank you for the background information. However, you either missed or are avoiding acknowledging the essence of my remark: They simulated significant eruptions that didn’t happen at the times hypothesized. (What they probably should have done was incorporate an average annual contribution from volcanic cooling, rather then cherry picking times when there might have been an eruption.) That is, considerable subjectivity was introduced into the model, and yet you and others celebrate the ‘accuracy’ of the ‘science.’ Additionally, for those who think that the model did a good job, I pointed out in the original article that a simple linear extrapolation of historical data provided a prediction that was superior to Scenario B, the best of the lot.
Yeah…like I said reality did not play out like any of the scenarios considered, but B is probably the closest match.
It’s a scenario; nothing more. It’s no different than presenting 3 different scenarios of force F and mass m and predicting the acceleration that would occur under each scenario. If you then go and test F=ma and the acceleration is different from the 3 prescribed scenarios because force and mass were also different do you then question the science behind F=ma?
Let me make sure I have this straight so I’m not accused of putting words in your mouth. Are you saying that if it can be shown that model A performed better than model B then it can be said that model B did not do a good job?
It could certainly be said that under your assumption Scenario B would not be the best. What I was saying was that alarmists are applauding the quality of the prediction when even a simplistic extrapolation did a better job than the complex model. Why bother?
Spamming the same old graphs again, get some new material.
To be fair, he was responding to my use of the old graph.
He posts these IPCC graphs over and over and over.
how does this get such negative score. It is a factual statement!!!
Surprising how long the satellite data is staying warm, whilst surface data continues to cool.long to
The 15th month in a row to set a monthly record. The 10 warmest Septembers in the UAH data are now
This is also a record September for the Northern Hemisphere, by 0.27°C. And the warmest September for the USA, though only by 0.06°C, so could be a statistical tie with 2023. Australia is 0.01°C cooler than last September.
Here’s a comparison between UAH and GISS, both using the same base period. Satellite data tends to have bigger peaks during El Niños, but I’m not sure if there’s usually such a lag between the cooling trend.
It’s all but certain that 2024 will be a record, which will be the first time we have had two consecutive record breaking years during the UAH era, and if my forecast is correct 2024 will smash last years record.
The El Nino energy release is still having problems escaping.
Must be something blocking it through the higher latitudes.. I wonder what that could be 😉
Still waiting for any evidence of human causation.
Trump is blocking it
Could the lingering temperature anomaly have anything to do with this heat source?
Why El Niños Originate from Geologic, Not Atmospheric, Sources — Plate climatology
Written by James E. Kamis
…the 1998 and 2015 El Niños are so similar. If the atmosphere has radically changed these El Niños should be different, not absolutely identical.
.
In an attempt to somehow explain this giant disconnect, climate scientists have been furiously modifying their computer-generated climate models. To date the updated climate models have failed to spit out a believable explanation for this disconnect. Why? Their computer models utilize historical and current day atmospheric El Niño data. This atmospheric data is an “effect” of, and not the “cause” of El Niños.
All El Niños have originated at the same deep ocean fixed heat point source located east of the Papua New Guinea / Solomon Island area.
“The El Nino energy release is still having problems escaping.”
The greenhouse effect.
NO evidence of that,
The GHE did not cause the sharp increase in 2023, did it. !
2016 El Nino dropped back down almost immediately , as did 1998 El Nino. CO2 hasn’t changed much since 2016
Try again, but with actual evidence this time.
“The greenhouse effect.”
You mean the HT sourced water vapour in the stratosphere…
.. by jingo, you finally got it….. totally by accident, of course.
If that were true we would never have winter. Here’s some data you should study.
That plot makes no sense. It shows a black area starting in about April 2024. That is over two years since the eruption, and about 9 months after the sudden temperature rise
So, when the data doesn’t support what you want to believe, the data must be wrong? That has always been the climate cult’s position. Laughable.
This is showing just one altitude. The best description of what has happened is water vapor took over a year before it stated to affect it. It also has affected other places at different times.
Water vapor was not the only gas that was injected into the high atmosphere. This is a complex situation.
Why hasn’t it happened before?
Could the lingering temperature anomaly have anything to do with this heat source?
Why El Niños Originate from Geologic, Not Atmospheric, Sources — Plate climatology
Written by James E. Kamis
…the 1998 and 2015 El Niños are so similar. If the atmospher
e has radically changed these El Niños should be different, not absolutely identical.
.
In an attempt to somehow explain this giant disconnect, climate scientists have been furiously modifying their computer-generated climate models. To date the updated climate models have failed to spit out a believable explanation for this disconnect. Why? Their computer models utilize historical and current day atmospheric El Niño data. This atmospheric data is an “effect” of, and not the “cause” of El Niños.
All El Niños have originated at the same deep ocean fixed heat point source located east of the Papua New Guinea / Solomon Island area.
Thanks Bellman.
I asked last month if someone had a source for such a comparison.
Looking at your graph, it appears that the last such divergence was during the 1998 “monster” El Nino.
Very interesting! I have no clue as to the mechanism of the divergence other than GISS undersamples the ocean surface temperatures versus UAH more accurately sampling the El Nino warming in the atmosphere?
I fear this is also the end of the Australian pause, for now.
My mistake, starting in February 2016, gives a trend of 0. Any other start point is positive. Start a year earlier or later and the trend is over 0.2°C / decade.
Doesn’t mean anything because you don’t know the causes of the “trend” nor what it will do next.
It is not surprising at all. The extra heat generated from the Hunga Tonga volcano has to exit the planet and it will do it through the atmosphere.
In their August 2023 Global Temperature Report, Spencer and Christy of UAH stated that the influence of the Hunga Tonga eruption on their lower troposphere data set was “… minor, perhaps a few hundredths of a degree”.
Also, the main eruption occurred on 15th January 2022, about 18-months before the big spike in UAH global temperatures.
Was the atmosphere on strike for those 18-months?
I don’t care about Spencer and Christy’s opinion, nor anybody else’s. There’s a very large number of unusual or unprecedented anomalies following the eruption. The delay is similar to Tambora’s 1815 eruption delay in the records.
That much is apparent, which is where you’re probably going wrong.
Such as?
What evidence do you have to back this up?
Still ABSLUTELY ZERO EVIDENCE of any human causation.
The best way to go wrong in science is to follow opinion instead of evidence.
– Extraordinary ocean warming models can’t explain.
– Record low Antarctic sea ice.
– 31 atmospheric river events in US West in Nov. 2022 – March 2023.
– The snowiest season in 71 years in California, the least snowy in NYC.
– Cyclone Freddy in the Indian Ocean, the longest-lasting tropical cyclone.
– ITCZ displacement and very unusual Sahara rains.
– Surprisingly quiet hurricane season models can’t explain.
– Heat records everywhere. Louisiana had hottest summer in 129 years.
– 2023 was the warmest year by the largest margin.
If you think what is happening is more of the same you are sorely wrong.
It is explained in the papers about Tambora eruption. The summer anomalies resulting in the year without a summer started more than a year after the eruption. The effects on the NH were much stronger than in the SH. Models don’t know why.
https://boris.unibe.ch/81880/1/tambora_e_A4l.pdf
Why would you expect immediate effect from water injected into the stratosphere?
The prompt and brief effect of large tropical eruptions is cooling, thanks to sulfur, particulates, etc, which block sunlight. For its magnitude, the eruption, being under water released less S than usual. Also the WV needs to spread out.
These effects were predicted by atmospheric physicists right after the eruption. I wonder if the good doctors have changed their minds.
As I recollect, Spencer and Christy were speculating on something they had not actually observed before.
Not radiate to space?
I’m confused.
Was it the “extra heat generated from the Hunga Tonga volcano” or the extra water vapour?
“The extra heat generated from the Hunga Tonga volcano has to exit the planet and it will do it through the atmosphere.”
What a bizarre hypothesis.
The more reasonable argument is that the water released adds to the greenhouse effect. But the Jury’s still out as to how much of the current warm spike is caused by HT, the El Niño, or any other cause. The science is never settled.
Honga Tonga…
There is still a large anomaly of H2O in the polar and sub polar stratosphere.
The warmist trolls are always the first to leave comments every UAH update…
It isn’t trolling. Not really. The warmist alarmists are classic examples of those with conclusions in search of evidence. Confirmation bias results. The increasing use of AI aggregation and scrubbing threatens to freeze scientific inquiry at the point their decision matrices are populated with fragile imperfect biased human programmer selected “facts.”
Yep.
For a very good reason.
The UAH data set has been revered as the ‘gold standard’ here at WUWT since this site began. It is featured prominently in the side panel of the home page.
Numerous articles here have been devoted to UAH’s supposed superiority over other data sets, especially surface-based ones like GISS or NOAA, etc.
Yet, over the past 20 years, UAH has been warming faster than any of the main surface-based data sets (GISS, HadCRUT and NOAA) that the IPCC uses for its model comparison base.
So why wouldn’t we draw attention to this undeniable fact?
It is worthy of remark that the data set beloved of so-called ‘climate skeptics’ is in fact the fastest warming one of all the major global temperature reporting data sets.
It makes you look ridiculous. So of course we comment on it, we “trolls”.
Yes, UAH responds more to atmospheric effects like the 2016, 2023 El Nino events.
Didn’t you know that..
… or are you basing your empty arguments on your ignorance, as usual.?
Now, evidence of human causation.
Still waiting.
You are the only one looking totally moronic, ignorant and ridiculous.
the more that is pointed out to TFN the more ridiculous his response.
Hahahaha, TFN, you’re comparing apples to oranges here. The surface and the lower troposphere are distinct layers, which leads to differences in the variance of each dataset.
Whether normalizing makes a difference to the trends are beside the point.
The real issue is that your understanding of statistics is quite basic.
Have you *ever* seen any “climate science study” actually calculate the variance of the data? I haven’t. Climate science doesn’t even recognize that jamming southern hemisphere data with northern hemisphere data, when each has a different variance, requires weighting of the data to reflect the different variances. Climate science doesn’t even recognize that coastal temperature variance is different than inland temperature variance. All of the differences in variance requires that weighting of the data be done when combining the data to calculate an average. But climate science just jams it all together with no regard to proper statistical treatment. Climate science won’t even recognize that combining different populations (i.e. SH, NH, coastal, inland, mountain top, valley, etc) usually creates a multi-modal distribution where the “average” is not useful in representing what the distribution actually looks like. Changes in the average might tell you that something is happening but will not provide a single clue as to what it is. Climate science can’t even tell you from their data *where* the change is occurring, not from a geographical viewpoint, not from a seasonal viewpoint, not even from a minimum temp vs maximum temp viewpoint.
They, including the UAH, don’t even bother to tell you the number of points they used.
Point 1.You seen to saying that we are denying what UAH is showing. We are not. The fact is we are speculating as to the cause and we all agree that there is zero evidence that the cause is co2. In fact, with every passing month the co2 hypothesis becomes weaker.
Point 2. You continue to demonstrate your stupidity.
The UK isn’t any warmer by a long chalk.
We live in hope.
Only +1.6C in the mean CET currently, the third extraordinarily warm year in a row since the 1660s. I was walking on the beach in shirtsleeves at 17/18C again today, you must live in a fridge or something.
Here in north east Wales we have had to put the central heating on in the evening for the last week. Months earlier than we normally do.
Same on Anglesey, Rayburn was lit 2 weeks ago, normally it goes on in Nov.
Here is the latest stacked graph of months. The remarkable thing emerging now is the amount by which 2024 will break the record for warmest year. It is the right column, and shows 0.4C ahead of 2023, which in its turn broke the previous record by 0.12C. That is over half a degree in just two years.
Nick, do you use any fossil fuels?
We can’t avoid using FF’s so that’s a silly question. The sensible question is does he try to reduce the amount of FF’s he uses?
Old saying – There is no ‘try.’
Or as Yoda put it – “No. Try not. DO.”
Sure you can. You can walk everywhere. it just takes longer. Or ride horses. You can heat with wood. You can melt tallow in a big pot over your wood fire and dip candles.
You might as well start now instead of waiting to be forced to do that when fossil fuels are outlawed for use. If you’re not willing to do that, then you are just being lazy and not really committed to fighting climate change.
Or we can use whale oil again.
Sheesh, windmills made a comeback, why not whale oil?
They will all be killed by wind turbines
Oh, I never though of that.
Wot a silly bunt.
Windmill comeback seems to be providing sources for whale oil offshore.
“Sure you can. You can walk everywhere. it just takes longer. Or ride horses. You can heat with wood. You can melt tallow in a big pot over your wood fire and dip candles.”
But you would be an idiot to do that.
“You might as well start now instead of waiting to be forced to do that when fossil fuels are outlawed for use.”
We are a long way from banning fossil fuels. We will be reducing in the mean time… or maybe not.
“You might as well start now instead of waiting to be forced to do that when fossil fuels are outlawed for use.”
Yea nah. Stupid simplistic way of looking at things.
“Stupid simplistic way of looking at things.”
That’s what the entire climate emergency thing is all about.
So you admit that you are NEVER going to give up fossil fuels
Obviously you know there is absolutely zero necessity to reduce our use of fossil fuels.
My prediction of you continuing to make moronic comment, is working out pretty well.
Did you find the pee pee tape or ready to admit Russia colluuuusion was fake. If not , then nobody can take you seriously.
I think you may have pee tape on the brain. Hey that makes sense. A pea brain seems to explain things.
Hey you still believe so find that pee pee tape Russia colluuuusion clown.
My prediction remains solid. 🙂
Look, if he really believes it’s gonna burn up the planet- he’d now be using very, very, very little ff. Reminds me of some “born againers” who I used to enjoy debating with. They said they were 100% convinced that Jesus was in heaven and waiting for them. Yet, these characters got busted for ripping off some old people. If I was 100% convinced about Jesus, I’d behave like Mother Teresa and dedicate every second to helping the suffering. If I believed CO2 is gonna destroy the planet, I’d use zero ff. But these climate nut jobs are hypocrites- especially the rich ones.
Fair enough…. but I don’t think Nick Stokes believes the planet is going to be destroyed by increased CO2. I certainly don’t. The planet will be just fine. There have been plenty of times CO2 has been higher than today and here we all are. The problem is a lot more subtle than that.
An example…. I was the Netherlands last week. Now there is a country with a big problem. They are very aware that if the sea continues to rise then their country will struggle to have any realistic future. Much of the country is already below sea level. They already have more dikes than a mardi gras. They really only have two options. Build them higher and hope they can beat nature, or go inland into Germany. There is already talk of making sure all children learn German. And their farmers are very aware that even if they can hold the water out (flooding), the sea will creep under the soil and the salt will poison it making it impossible to grow food. These are the kind of problems we will face… not planetary destruction.
So they’ll move to dryer lands.
Like that’s never been required before in the whole course of human evolution.
“So they’ll move to dryer lands.”
Well they will if they can. But there are a whole lot of question marks around that.
“What if Germany says… sorry we are loosing land too. There is no room.“
Maybe they need to stop wasting land building wind turbines.
Dutch dikes have been there for a long time.
Sea level rise is around 2mm/year on the Dutch coast, Pretty sure they can keep up with that.
Germany would do fine with immigrants from Holland, compared to immigrants from Moslem countries. And Holland could send THEIR Moslems back to where they came from. You’ve got a lot of “what ifs”. Time to enjoy life and stop worrying.
“Germany would do fine with immigrants from Holland, compared to immigrants from Moslem countries.”
Ah the racist card. Well I never expected that. Maybe they eat cats and dogs too
Call it racist- I call it reality. You probably are too ignorant to know that some Dutch cartoonists were murdered by a Moslem fanatic who declared you can’t joke about Mohamed- or he’d kill you! I’ve read that Scandinavians are now also realizing immigrants from North Africa don’t assimilate well. Of course they wouldn’t. Conservatives understood this.
The parable about the Tower of Babel suggests that there is something than can be said about everyone being on the same team and not fighting among themselves.
They also eat bald eagles, our national bird. However, the press hasn’t had much to say about that after the initial arrests.
You’ve apparently never heard of the Dust Bowl. You’ve apparently never heard of the current reaction to the open borders here in Biden-land where cities and town have been overrun with illegal immigrants that have caused all kinds of problems – including not having any room for them in housing, schools, and hospitals.
That has happened over just 3-4 years – almost an instantaneous happening in history.
You forgot eating cats and dogs.
“That has happened over just 3-4 years – almost an instantaneous happening in history.”
I think you will find there has been a problem at the boarder and illegal immigration for quite some time. It’s a pity only one party wants to sort it at the moment.
Some people don’t appreciate Trump’s sense of humor. 🙂
Oh, yes they do,
that’s why so many people laugh at him.
No, there has NOT been an influx of illegal immigrants into the US for quite some time. Check out the numbers. Why do you think Obama was called the “Deporter-in-Chief”? go here: https://www.statista.com/statistics/329256/alien-apprehensions-registered-by-the-us-border-patrol/
You are going to see it in the Carolina’s here in the US over the next few years. River channel changes and land changes from the flood will prevent a significant amount of rebuilding. The only option will be to relocate. We’ve seen it here in Kansas since the 50’s when the Corps of Engineers started building flood control reservoirs and actually covered up entire towns with water. I would also point to the entire central US when during the Dust Bowl there was a huge migration of people toward the coasts. More recently literally thousands of young people have left the farm and moved to the cities as continued increases in farming efficiencies have lessened the need for manual labor.
I’m quite sure similar things have happened all over the globe over the past 200-300 years. The entire move west from the east coast from 1600 and onward is a perfect example.
Simon seems to be singularly ignorant of the history of people over time. It’s not surprising. It’s endemic in far too many progressives today.
So you are siting a whole lot of problems in defence of a problem. But I think you are just being silly. All of the things you state are tiny in comparison to an entire nation disappearing into the sea. Maybe you will be able to tell me where I am wrong. Or you will do what many do here resort to personal abuse.
Entire nation? Got proof of that? I didn’t think so.
In the 1950s 20% of Holland was below mean sea level and the next highest 30% was less than a metre above. In the storm of 1953 the sea defenses were destroyed and land up to 5m above sea level was flooded. A few dykes survived and fortunately prevented much more severe flooding one of the breaches was blocked by navigating a ship into the gap!
Kudos to the Dutch for trying to conquer the sea – rather than conquer their neighbors as all of their neighbors have done at one time or another, currently like the born again Soviets under its current Czar Rasputin.
You didn’t even bother to go look up any numbers, did you?
Out-migration from the worst dust bowl counties was about 48% in the 20’s and fell to about 35% in the 30’s (no one was left to out-migrate in the 30’s).
I sincerely doubt that the entire population of the Netherlands would have to migrate away due to sea level rise as you so hyperbolically implied. Nor would *all* of them go to Germany!
Speculation at best.
Dutch dikes have been there for a long time.. and none of that has happened.
Sea level rise is around 2mm/year on the Dutch coast, Pretty sure they can keep up with that.
You are off in your child-like la-la-land again, simpleton. !
Whoa! You must have evidence then that co2 is the ultimate cause of rising SL!?
Let’s have it! We have been waiting for this! If you don’t have any I’m afraid your comment will have to be thrown into the trash bin where it belongs.
Define “we”. You talk as if it will be you, when in fact you will be long dead and gone before anything of what you suggest can possibly happen.
So the Netherlands may in fact have a big problem centuries from now, but, you’ll never know.
But then again, it will all be under a mile of ice again at some point in the future anyway, a much bigger problem.
“Define “we”. You talk as if it will be you, when in fact you will be long dead and gone before anything of what you suggest can possibly happen.”
Oh so you think because it wont affect me directly, the problem doesn’t matter. Well I think that pretty much sums up the climate denial mantra.
You have plenty of things to worry about that haven’t affected you directly. Yet.
Asteroid impacts
Thermo nuclear explosions
Crop failures
Cancer
Economic collapse.
All could happen to you at anytime. But you never worry about any of those things here at all. Let alone call for “action” to prevent it. Its only the weather for 30 years that concerns you. So that pretty much sums up the reality denial mantra of actual threats that you ignore.
OK that is about the dumbest comment I have read here for a while, so congratulations. that takes some doing.
So….I will be fine. I do not worry for me re climate change. There is little chance I will be affected in my life time. But I do have concern for those who follow me. My grandchildren I think may well live in a very different world. I do believe the risk to them is real and to a degree preventable/able to be reduced. Just because the others you site are possible and threats does not diminish the danger a change climate presents to future generations.
Who is being/will be affected in your life time? You don’t seem to be capable of self awareness.
Or, a Carrington Event. We had an X9.1 solar flare erupt today, after an X7.1 a couple of days ago, and we haven’t reached the peak of Cycle 25 yet.
No it doesn’t. Lol.
He wouldn’t argue so strongly in favor of “the climate consensus” if he didn’t worry the planet is going to burn up. As for “these kind of problems”- for them, we don’t need to decarbonize our entire civilization.
“As for “these kind of problems”- for them, we don’t need to decarbonize our entire civilization.”
Maybe, maybe not. It looks like we are going to find out one way or another.
We will be decarbonizing in another eye blink, compared to even recorded human history. We are already beholden to conflict oil from Iran and Russia. So much that we don’t bomb Iranian oil facilities out of concern for price increases.
And the juiciest US play, the Permian is on track to have less booked, proved, on, oil and oil associated gas reserves for 2024, than what was booked this year, for last year. Yes, thanks to lax TRRC rule enforcement and a Ben Dover attitude towards timely asset retirements, production is plateauing at a high level. But a confluence of MEGO (to outsiders) factors, will preclude full replacement. IN OUR BEST PLAY!!
Since the proof of the need is weak, only a foolish mankind would proceed to spend hundreds of trillions of dollars to decarbonize.
So you have an opinion that the proof is weak, but the evidence suggests otherwise. The planet is warming, the sea is rising and the ice is melting. As has been pointed out in this thread, this year will be a record by some amount. That will mean two record years in a row which is unheard of in the modern record. If I were living in the Netherlands, I (like the government and citizens there) would be worried based on that alone.
It’s not an opinion but a fact that there is no proof of their being a climate emergency, climate threat, or however alarmists call it. There is a slight warming and the seas have been rising for centuries- which fact you certainly are unaware of. I suspect most Dutch have a long worry list where the sea rising is near the bottom if on the list at all. Lots of things to worry about- if you don’t realize that, you must be very young.
God pare me. It’s not an opinion you twonk.
He posted on the internet. Of course he uses hydrocarbon fuel.
Yes, because he wrote his comments
Unfortunately the warm spike won’t last, as Tongan water keeps slowly leaving the stratosphere and El Niño fades further. Then it’ll be back to the dangerous cooling trend.
Which cooling trend are you referring to?
The one since the Holocene Climatic Optimum.
Yup, the LONG TERM TREND IS STILL DOWN.
I’m not saying your wrong, but how do you know that is what Milo is referring to?
The most recent one since 2/2016 until summer 2023, ended by El Niño and the Tongan eruption.
That’s what I was thinking based on your previous predictions. If I remember (no guarantee there) we’ll revisit your prediction here in a few years time to see if the downtrend from 2/2016 can reform.
Ummmm. . . I think that same claim was made as far back as May 2023, but nature has paid no attention to it.
Claims are irrelevant if they don’t match the data. Here’s a key peak at data that does matter.
https://acd-ext.gsfc.nasa.gov/Data_services/met/qbo/h2o_mls.html
And in this one even more clearly
I’d like to see one covering closer to the poles.
Obviously that is where the excess WV has been heading to. When you get well up into the Stratosphere, it become very obvious.
75N
75S
I absolutely love the rapid (2–3 per month) oscillations in stratospheric water vapor that appear to have started about April 2024, to extend from 75N to 75S latitudes, and to have total amplitudes of at least 0.5 ppm.
IOW, the Aura MLS plot you presented has highly questionable data.
Ooops . . . my mistake: I meant to type “. . . (2-3 per quarter) oscillations . . .”
No it wasn’t. The warm spike came after May. If you disagree, please cite the alleged claim.
I posted: “I think that same claim was made as far back as May 2023.”
If you closely examine the graph of UAH GLAT given at the top of the above article, you’ll see that the running average (the red line) first exceeded the previous peaks (in 2016 and 2020) around the May 2023 timeframe.
At the time, some people (unnamed) asked if the noticeable rise in the UAH running average temperature would continue in the manner of previous oscillations, thus continuing the ongoing ~8 year “pause” in average warming.
However, others (also unnamed) asserted that the H-T volcano injection of water into the stratosphere (some 16 months earlier) would create global warming for a year or more into the future.
But, hey, if you want to assert “the warm spike” came after May 2023, OK by me.
Anyone who cites atmospheric temperature readings, let alone averages, to 0.01 °C resolution is simply not credible.
Dr. Spencer reports them to 3 decimal places. Though to be fair he also says the uncertainty is ±0.20 C.
Typical for climate science, significant digit rules somehow don’t apply to the practitioners.
In the above article including its embedded table, that is credited to Dr. Roy Spencer, I only see temperature data reported to 2 decimal places, not 3. And kudos to him for stating (apparently separately from the above article) that the uncertainty in his data is ± 0.20 °C. Based on that, IMHO he really should be reporting UAH temperature data to only one decimal place.
Or better still, only to ‘sensible’ temperature readings.
Who can sense the difference between 15C and 16.5C rise and fall over the hours in the course of a day for example ?
Dr Spencer has admitted that they have no way to measure cloud affects for any measurement. Therefore they have to “parameterize” cloud cover, i.e. make a guess, perhaps an educated guess but still a guess. The measurement uncertainty from that “guess” will accumulate as measurements are averaged. It’s simply unbelievable that the total uncertainty from that factor alone will be in any decimal place, I don’t see how it could be anything less than the units digit.
The monthly data set UAH submits to the nsstc is to 3 decimal places.
This is not due to the precision of the instruments. It is the result of averaging, as been repeated here for time immemorial – to no effect.
Just another ruler monkey with averaging-on-the-brain.
Averaging can *NOT* increase resolution. That’s a strict rule in most physical science, climate science excepted. It’s a strict rule in every engineering discipline of which I am aware.
Go learn the significant digit rules. If you could do this you could measure crankshaft journals to the millionths using a yardstick, you’d just have to take enough measurements.
Guard digit?
“Dr Spencer has admitted that they have no way to measure cloud affects for any measurement.”
Funny how some only discover the problems with satellite data when it’s showing more warming. Not when it’s being used to claim other data sets exaggerate the warming, or to claim a pause.
Begone, troll.
Refutation requires using the evidence that is available. If UAH doesn’t agree with other data sets then it *IS* possible that both are wrong – unless its you doing the comparison. Just look at the climate models – *all* of them are wrong.
I’ve been pointing out the problems with the UAH numbers for a lot longer than the current hockey stick blade.
I’m not very knowledgable on this subject, but whether the surface and satellite data agree or not, that only concerns differences in the standard error for each dataset, right? Not measurement uncertainty.
Do you mean they only look at the SEM? Each data set has its own uncertainty, which averaging cannot reduce.
I believe so.
In 2016, Pat Frank demonstrated that temperature measurements containing systematic errors can still pass quality checks before being added to climate data archives. This is largely because these measurements correlate well with those from nearby locations.
https://wattsupwiththat.com/2016/04/19/systematic-error-in-climate-measurements-the-surface-air-temperature-record/
If I’m right, both satellite and surface temperature data compile measurements into regional grid cells in a similar manner. As a result, it wouldn’t be surprising if their final averages closely aligned.
But my understanding is this concerns the precision of those averages rather than their accuracy. As you point out, no amount of statistical manipulation can rectify the inherent inaccuracies in the measurements themselves.
“This is largely because these measurements correlate well with those from nearby locations.”
Really? Then why did Hubbard and Lin find in 2002 that “adjustments” to the temperature readings from temperature measuring stations must be done on a station-by-station basis because of microclimate variations between stations?
Correlation between stations is largely based on daily profiles caused by the earth’s rotation and by seasonal effects. You have to remove those in order to determine if there is any correlation effects from other sources. Using the daily mid-range temp value does *NOT* eliminate daily and seasonal correlation impacts. It does not remove UHI correlational effects which can be widespread due to wind. Even monthly averaging cannot remove all seasonal effects because of the seasonal variation within some months, e.g. September is liable to have high temps early in the month and low temps later in the month due to seasonal effects. Averaging daily values over the month can’t eliminate this.
Climate science like to assume that using anomalies will remove these correlational effects leaving only the “signal” from CAGW. But that is a farce. The anomalies will inherit all of the correlational effects of the absolute temps.
It has been awhile since any of this has been posted so this is a good time to review.
The first important point to remember is that the NOAA satellites are in polar orbits with periods of about 45 mins; they scan as the earth spins underneath them and causes the scanning to be very nonuniform. The globe is partitioned into an equiangular grid with 2.5 degrees latitude and longitude on each side. Because lines of latitude are not parallel, the grid locations are spherical trapezoids: the physical grid area at the equator is 10 times greater than near the poles.
Points near the poles are scanned several times each day, but at 30 degrees latitude there can be as many as three days elapsing between scans. Above 85 degrees latitude the scan points overlap so they don’t try to use these data. They certainly can’t do a daily T=(Tmax-Tmin)/2 calculation.
Supposedly the UAH uses infilling of some kind to cover over missing data but I can’t verify if this is correct.
The next most important point: there is no single temperature of the lower tropopause, LT. The microwave sounding units have Gaussian responses to frequency, for the LT the broad peak corresponds to an altitude of about 5 km, about 0-10 km wide. Because of the lapse rate, the air temperature decreases with altitude (roughly linearly). This means the radiance measured for the LT is a convolution of the Gaussian response function and the lapse rate.
In high-elevation regions, the convolution is truncated giving different results.
If you look at a histogram of the grid temperatures for the globe that are used to calculate the anomalies, there is a sharp peak at 0°C corresponding to tropical oceans, and no temperatures are greater than 2-3°C. In polar areas the LT can be 100°C below freezing.
UAH does not retain/report the number of points that go into their averaging. Monthly data for February has 10% fewer points than other months.
Temperature data is calculated and stored with five digits Kelvin (10 mK resolution). UAH doesn’t not report non-anomaly monthly grid point averages. No standard deviations of any averages are reported.
In contrast, the surface temperature data sets have to interpolate from the fixed weather monitoring sites to get to a uniform grid.
UAH is what we used to term a “metric”. It is like the height of the water in a stream is a “metric” for how much rain has fallen. It is *not* a measurement of how much rain has fallen and has only has the broadest brush of usefulness, e.g. a lot of rain has fallen recently or not much rain has fallen recently.
UAH is not much better than that stream for determining the “global temperature”. For the stream the amount of runoff from rain is highly dependent on the soil moisture in the drainage area, even a lot of rain might not result in a corresponding increase in the height of the water in the stream. The same applies to radiance measurement and path loss due to atmospheric conditions, things like water vapor, clouds, dust, and even smoke (been a lot of that this year at least in North America) will affect the radiance the satellite MSU’s see. If you can’t quantify the rain runoff or the path loss then neither metric can be extended to hundredths of an inch or hundredths of a degree Celsius no matter how much resolution your measuring device has or how accurate it is.
No, it does not. The scanning performed by the MSU aboard the spacecraft is very uniform and consistent . . . it’s built to do such and is frequently calibrated in-situ to be performing in such manner.
It is the microwave radiance sensed by the MSU and recorded as data that is variable (“non-uniform”), as is completely expected since the radiance measurements vary due to variations in the underlaying surface emissivity in the sensed part of the EM spectrum (e.g., water versus ice versus green foliage versus desert), the actual temperatures of such sensed regions, and interferences effects such as clouds and atmospheric constituent absorption bands that lie in the same frequency range(s) as used by the MSU.
How do you determine what the difference actually might be if you don’t know the measurement uncertainty of each?
Standard error is a metric for sampling error only. Calculating it typically requires having multiple samples so you can find the standard deviation of the sample means – what is truly misnamed “standard error”.
Where are the multiple samples for temperature?
The usual mistake by climate science statisticians is to assume the standard deviation of their single sample is the standard deviation of the population. Thus standard error = sample(SD)/ n. The thing that always gets missed is that if the sample SD and the population SD is the same then the SD is the measurement uncertainty of the population – there is *NO* standard error. The equation for standard error is based on the SD in the equation being the standard deviation of the multiple sample means and *not* the standard error of the population! No multiple samples then *NO* standard error calculation is possible – even though climate science thinks there is.
It’s why the variance of the data sets is so important to know. It is a direct metric for the uncertainty of the average value. However the variance is not a substitute for measurement uncertainty propagation because the data consists of single measurements of different measurands rather than multiple measurements of a single measurand.
Relax, I wasn’t including you in the “some”. We all know your thoughts on UAH. That’s why you kept attacking everyone who promoted it month after month.
You can’t refuse something with bad evidence, even if it’s the only available. At best you can say it’s consistent with a hypothesis. If we have mno way of knowing what global temperatures are doing than we have no way of knowing how good or bad the models are.
But again, none of this caution was present when you were applauding Monkton for presenting his monthly “pauses”, on the contrary, you kept attacking me for pointing out the uncertainty.
“refuse” should be “refute”
This is a lie.
Except for the facts that:
— UAH uses data from multiple satellites in different orbits, each covering different zenith points at any given time of day, 24/7/365
— the typical areal cloud coverage of Earth is about 67%, meaning that about one-third of UAH measurements over any period of time will not be affected by clouds
— no part of Earth’s surface is permanently covered by clouds.
I can’t state it as being a fact, but I would be shocked to find that Professors Christy and Spencer, as well as the science team at UAH, don’t have data processing algorithms that compare data inputs from the different satellites they use so as to filter out those radiance measurements that are reduced by the relatively large amount expected to arise from cloud coverage interference.
Please note that this last comment does not dispute the admission from Dr. Spencer that UAH has “no way to measure cloud
affectseffects for any measurement”.“— UAH uses data from multiple satellites in different orbits, each covering different zenith points at any given time of day, 24/7/365″
So what? None of them are repeatable or reproducible. Meaning their measurement uncertainty adds.
“— the typical areal cloud coverage of Earth is about 67%, meaning that about one-third of UAH measurements over any period of time will not be affected by clouds”
ROFL!! Even assuming no clouds means no effect then 2/3 of the measurements *ARE* affected. That will certainly cause an increase in measurement uncertainty. It’s not just clouds, it’s WATER VAPOR as well. MSU stands for Microwave Sounding Unit. As anyone who has engineered a microwave communications link can tell you is water vapor in the form of humidity is a contributor to path loss.
“— no part of Earth’s surface is permanently covered by clouds.”
So what? No one is saying that is so. In fact, it is the variability of clouds that is the problem. How do you parameterize something accurately that is as variable as clouds?
“algorithms that compare data inputs from the different satellites they use so as to filter out those radiance measurements that are reduced by the relatively large amount expected to arise from cloud coverage interference.”
ROFL!! If you don’t know that the impact is then how does an algorithm filter anything? IT’S A GUESS! That is what parameterization IS, a guess!
How is a cloud like a bus? Wait 5-minutes and another one will come by.
One-sigma or two-sigma?
As described in the paper it is 95% CI.
When temps are recorded in the units digit then averages have to be given with the same resolution in order to meet standard physical science standards. With averages in the units digits it’s impossible to generate anomalies that go beyond the units digit.
I have no information that says temperatures derived from microwave sounding unit (MSU) data obtained from many (5 or 6?) orbiting spacecraft—which in turn forms the basis of UAH GLAT data reporting—only uses a precision of one place to the left of the decimal point.
Can you please provide a reference that shows this is true.
And yes, I am only talking here about mathematical precision . . . NOT about the degree of accuracy of a given measurement or series of measurements.
I am actually being very lenient in suggesting a measurement uncertainty in the units digit. As with all of climate science, UAH uncertainties are *sampling* error estimates, not measurement uncertainty estimates. Even Spencer is using the common climate science meme of “all measurement uncertainty is random, Gaussian, and cancels”.
Spencer & Christy don’t care about real measurement uncertainty, they are only interested in trend lines. Why do they use a running average to smooth the curve? The small month-to-month variations could be meaningful.
It’s the month-to-month variations that define the variance of the annual distribution.But climate science has never heard the term “variance” I guess.
Nope!
Sorry, Tim, but a careful read of my post to which you responded will show that I clearly stated “temperatures derived from microwave sounding unit (MSU) data”.
“Sorry, Tim, but a careful read of my post to which you responded will show that I clearly stated “temperatures derived from microwave sounding unit (MSU) data”.”
So what? You asked about “And yes, I am only talking here about mathematical precision”. Mathematical precision is subject to significant digit rules. There really is no such thing as “mathematical precision” when it comes to measurement.
Precision is how well different measurements agree. Since the MSU measurements are one time things precision is not an issue. Precision = repeatability + reproducibility. Temp measurements can not be repeated (the satellite moves continuously) and cannot be reproduced (time marches on).
Accuracy is how close the measured value is to the true value. Since you can’t know the actual true value a measurement uncertainty interval is meant to be a metric for the accuracy of the measurement.
Resolution is basically the smallest change a measuring instrument can either recognize or display.
There is no mathematical algorithm that can turn non-repeatable and non-reproducible measurements into repeatable and reproducible measurements. Accuracy and resolution are the two main components that apply to the UAH temperature data.
I would love to see the measurement uncertainty budget used for the UAH measurement data. I have real doubts that such a thing actually exists. I can’t find it on the internet. The phrase “UAH measurement uncertainty budget” certainly provides no hits.
I’m surprised to see you state that.
Here, as just one example in rebuttal, is this statement taken verbatim from “Precision measurement of the Newtonian gravitational constant“, C. Xue, et.al., 2020, National Science Review, Volume 7, Issue 12, December 2020, Pages 1803–1817 (free download available at https://academic.oup.com/nsr/article/7/12/1803/5874900 ):
“Over the past two decades, eleven precision measurements of the gravitational constant have been performed, and the latest recommended value for G published by the Committee on Data for Science and Technology (CODATA) is (6.674 08 ± 0.000 31) × 10−11 m3 kg−1 s−2 with a relative uncertainty of 47 parts per million.”
Note the separate references to “precision” and “uncertainty”.
Enough said.
I gave you the definition of precision, accuracy, and resolution. The use of the term “precision” in this document is being misused.
For instance, “This kind of situation could be mainly attributed to the large discrepancy among all of the experimental data from different groups.”
Clearly the measurements are not repeatable or reproducible since they get significantly different values. Thus it is *not* precision which the document is addressing, but accuracy.
From the document: “It is most likely that there might be some undiscovered systematic errors in some or all the G measurements.”
Systematic bias in measurements is indicative of ACCURACY, not precision.
From the document: “Seattle made some remarkable improvements to overcome the systematic errors in previous measurements [31,62,63] and published the G value with a relative uncertainty of only 14 ppm.”
The document seems to use the terms precision and uncertainty interchangeably.
It’s not even clear to me that you understand the difference between an uncertainty interval, e.g. +/- .00004 and a relative uncertainty, e.g. 100-300ppm.
As long as different experimenters and experiments get different results then precision has not been increased, accuracy has.
Look at the description of JILA 10. Nowhere in the description are the environmental conditions for the experiment listed. I don’t have access to the actual document but perhaps someone who does can tell you if all environmental conditions are listed. If they aren’t then they will *never* get precise measurements, there will always be differences in different experiments. That’s the purpose of a detailed measurement uncertainty budget – which should include a “precise” description of environmental conditions for all measurements.
I can only gently suggest that you inform the National Science Review of your observations and conclusion. I am sure they will give your notice all the attention that it deserves.
The confusion between precision, resolution, and uncertainty is endemic today.
I note you have not provided a single refutation of anything I asserted. Duly noted.
Say what???
Is it not obvious that one can record measurements with high precision, but low accuracy?
Of course that is obvious!
I can fold, corner-to-opposite corner, an approximately square piece of paper to get an approximate 45° angle and use that tool to “measure” a 45° calibration reference, writing down my observed measurement as, say, 44.628514° (noting that I intentionally chose to stop at the sixth decimal place . . . I could have gone further in notating precision).
Does that mean I accurately measured the calibration reference to the nearest micro-degree? No, it does not.
Does that even mean I can establish my measurement accuracy from that single data point? No it does not.
Precision of measurement is at the whim of the person recording data (or the electronic proxy of an instrument’s designer) . . . accuracy can only be determined by reference to a calibration standard which itself will always have some degree of inaccuracy.
BTW, is it not similarly obvious that one can record measurements with low precision, but high accuracy? Hmmm, shall the twain ever meet?
This is resolution, not precision.
A micrometer with slop in the gears can be very precise in its measurement if the same measurement protocol is followed, e.g. always open the jaws all the way and then close them tightly on the measurand. It should give the same measurement value each time if the instrument is “precise”. *What* that measurement actually tells you, however, is a combination of the resolution of the display and the accuracy of the device itself and the “precision” doesn’t help much (if at all).
As I gave in the definitions, precision is the instrument giving the same readout for each measurement of the same thing under the same condition, accuracy is how “true” that readout is, and resolution is the minimum change that the instrument can detect. While related none of them is the same thing. You can have high resolution with low accuracy, you can have high precision with high accuracy, you can have high precision with low accuracy, etc.
As you note, resolution is not precision. You can have high resolution and low precision which also indicates low accuracy. You can have low resolution and low precision which also implies low accuracy. You can even have high precision with low resolution but that means your accuracy is limited as well.
“accuracy can only be determined by reference to a calibration standard which itself will always have some degree of inaccuracy.”
How do you calibrate an instrument with low precision and/or low resolution even with a calibration standard?
That’s how it’s done, isn’t it?
Work outwards to ever lower resolution/precision with higher tolerances. That’s why there are different grades.
Low precision instruments give different readings each time you measure the standard. So which reading is correct? This should be covered in the measurement uncertainty interval for the instrument result.
Low resolution instruments may be precise in that the same reading is given each time but the accuracy (depending on the situation) will be low. Again, this should be covered by the measurement uncertainty interval for the instrument.
[when I say depending on the situation I mean measuring the current in your power lead to the washing machine has a different accuracy requirement than measuring the bias current in a transistor amplifier..This affects the resolution requirements]]
Lower, not just low.
Again, lower.
Lower resolution and lower precision tend to go together, so the lower precision doesn’t matter at the level of resolution available.
Yep.
Higher resolution, precision and accuracy are progressively more difficult to achieve. There is a good reason for Grade 00 gage blocks being more expensive than Grade AS2, or 0.0001″ Mitutoyo micrometers costing more than 0.001″ Harbor Freight things, or Fluke voltmeters costing more than Radio Shack multimeters.
There is also a good reason for people buying both.
:Lower resolution and lower precision tend to go together, so the lower precision doesn’t matter at the level of resolution available.”
No. A voltmeter that reads in the units digit will consistently show 1 volt for values around 1 volt. That means its precision is high but its resolution is restricted. You’ll get the same reading every time but how accurate that reading is gets specified by the measurement uncertainty interval, e.g. +/- 0.5v.
If your only requirement is that the voltage is around 1 volt but you don’t need to know it any more accurately then the resolution is fine for your purpose. E.g. for TTL logic Vih (where it recognizes a binary 1) is about 2 v. So if your voltmeter consistently measures 3 v +/- 0.5v you don’t need any more resolution to know the TTL high level is ok.
“Higher resolution, precision and accuracy are progressively more difficult to achieve.”
“There is also a good reason for people buying both.”
I mostly agree. Resolution is pretty easy to achieve. High resolution *with* precision and accuracy as well is difficult to achieve.
It means the precision is in line with the resolution, which is what I was trying to say.
That was an AND 🙂
Yep, it’s easy to just scribe more lines
From NIST (https://www.itl.nist.gov/div898/handbook/mpc/section4/mpc451.htm#:~:text=Resolution-,Resolution,characteristic%20of%20the%20measurement%20result. ):
“Resolution is the ability of the measurement system to detect and faithfully indicate small changes in the characteristic of the measurement result.”
In my example ad absurdum, I said nothing about detecting and faithfully indicating small changes in the measurements (in my case, I only mentioned a single “measurement”).
Also, by NIST definition, resolution could not be “at the whim of the person recording data”.
Whatever.
No, it is not even true, let alone obvious. With very low precision, the displayed digit may be very different from the correct most significant digit of the reference standard.
Yep. If the reading changes from measurement to measurement, i.e. low precision, how do you determine which reading is the most accurate?
Really? I use a digital-display caliper, calibrated to be accurate to .001 inch, to measure a series of different bolt shafts, but choose to record each measurement to the nearest 0.1 inch despite the electronic readout having three decimal places. That would not be recording measurements at low precision that have been obtained with an instrument having high accuracy?
Precision is *not* defined by what you write down. It is defined by the measuring instrument. If you make 10 measurements of the same thing in the same manner using your caliper (which is what I also use as a metalsmith making jewelry) and you get the same reading each time then you have an instrument with high precision.
The problem is the “same manner”. It’s very difficult to exactly duplicate the “same manner”. That encompasses both the environment (e.g. temp, humidity, etc) but also use of the instrument itself. Did you exert the same exact pressure on the measurand from the caliper jaws for each measurement? Were the jaws exactly parallel on the measurand each time? Was the same place in the jaws used each time?
This is one reason why high precision, high accuracy micrometers are built like a torque wrench with a “break” point to insure the same pressure is applied to the measurand each time.
An instrument with high precision can give low precision measurements if the measuring protocol is not very specifically defined and all factors affecting systematic bias are eliminated or adjusted for.
High precision does not guarantee high accuracy. High resolution does not guarantee high accuracy. But highly accurate instruments typically imply both high precision and high resolution – but the accuracy is totally dependent on how the instrument is used.
In no case does precision, resolution, or accuracy depend on what you write down in your logbook. What you write down in your logbook *is* dependent on your confidence in the accuracy of the measurement you have just taken – and that should be indicated by the measurement uncertainty interval you specify for the measurement, not by the stated value you write down with no uncertainty interval.
The value of pi is 3.1416. The value of pi is 3.1415926536.
Which statement is more precise, or do they have equal precision?
What is your point in all this? I don’t get it.
It figures.
Both are incorrect: pi is an irrational constant equal to an infinite series.
Completely irrelevant to metrology and uncertainty analysis.
Hence, pi should never be used in any computations. Any past metrology measurements (such as deriving the surface area of a right-angle circular cylinder based on its accurately measured diameter and length) are thus invalidated. Likewise, all uncertainty analysis governing the circumferences and spherical areas of event horizons in black hole are thus invalidated.
In fact, even the mathematical definitions of a radian and steradian are thus invalidated.
/sarc
/plonk/
Exactly!
Neither you or Tim Gorman appear to understand that there is a distinct difference in meaning of the term “precision” when describing a notated number (written down on paper or expressed on a computer . . . that is, mathematically-expressed, such as in my example above of expressing pi) and “precision” when referring to a numerical value output from or read off a measuring device (i.e., as in the field of metrology, the science of measurement, including both theoretical and experimental methods, and its widespread applications).
I attempted to give various examples of such a difference, all apparently to no avail.
Well pin a bright shiny star on your swelled head.
I see . . . defaulting to ad hominem attack for lack of a reasoned response.
Go for it!
The number of digits of pi needed depends on the calculation, i.e. significant digit rules. If there are only two-three digits for measured quantities, only four-five digits for pi are necessary.
Fine. How is that relevant to my OP asking the two questions about pi expressed as different numerals to the right of the decimal point?
Stupid irrelevant questions.
It’s not relevant because pi isn’t is a MEASUREMENT! It’s a constant with no measurement uncertainty. As km tried to tell you and which you ignored you use as many digits for pi as you need – and it still has zero measurement uncertainty.
Temperature is *measured”, not “notated”. It’s not “math”, it’s a physical process.
I *gave* you the definition of precision as applied to metrology. And now you are just flailing around trying to convince us that math and metrology are one and the same. They aren’t. Live with it.
You *still* haven’t grasped the difference between precision and resolution when it comes to metrology and measurements.
—————–
The value of pi is 3.1416. The value of pi is 3.1415926536.
Which statement has higher resolution or do they have equal resolution?
——————-
Fixed it for you.
You “fixed it” at your own peril. Perhaps your forgot that in your post of Oct 3, 2024, 1:30 pm you stated:
“Resolution is basically the smallest change a measuring instrument can either recognize or display.”
Hypocrisy much?
No.
He thinks pi is a measurement and not a constant.
You are correct.
Do *you* have a measurement instrument that can measure pi? Where did you get it?
Assume that you are trying make a measurement with your ‘high precision’ caliper in a sandy environment where grains of sand keep keep getting between the blades. It is obvious that there is a plus bias in every reading, and the variance is going to be high and variable as well, despite the potential for high precision.
Thank for you hypothetical complication that is otherwise irrelevant (in terms of adding in variable bias) to the example that I gave.
“Conversion from radiance to temperature is “calibrated” using temperature data from land stations that have measurement uncertainty in at least the units digit. That measurement uncertainty has to be propagated onto the conversion”
You’re wrong, according to Roy Spencer: “Contrary to some reports, the satellite measurements are not calibrated in any way with the global surface-based thermometer records of temperature. They instead use their own on-board precision redundant platinum resistance thermometers (PRTs) calibrated to a laboratory reference standard before launch.”
Points 6 and 7 are therefore also irrelevant.
Say what? Are you suggesting that a satellite in orbit is dipping down to the lower troposphere to measure the air temperature with “their own on-board precision redundant platinum resistance thermometers” and then going back to orbital height to confirm that their proxy temperature agrees?
No, only a complete idiot would interpret Roy Spencer’s statement in that way. Since you apparently need it spelled out to you here is a more detailed description:
“MSU uses an in-orbit calibration method that includes two calibration targets: the cosmic cold space and an onboard blackbody warm target. The cold space has a temperature of 2.73 K, and the warm target temperature is measured by the platinum resistance thermometers embedded in the blackbody target. In each scan cycle, the MSU looks at these targets as well as the earth, and the signals from these ‘looks’ are processed by the instrument and recorded as electric voltage in the format of digital counts. The root-level (level 1c) calibration converts the digital count of the earth scene look to the earth scene radiance using the two calibration targets as the end-point references”.
https://www.star.nesdis.noaa.gov/smcd/emb/mscat/algorithm.php
Calibration standards drift just like anything else. Even measurement stations using PRT’s have measurement uncertainty because of drifts in the sensor. ANY electronic component that carries current suffers heating effects. Those heating effects typically cause expansion of the material which is not perfectly elastic so even if the current is removed some effect of expansion will remain. The effects of heating are cumulative over time – even in platinum resistance thermometers.
Spencer makes the same unfounded claim that is so typical of climate science – no calibration drift in the measurement devices – thus the only uncertainty is in the initial calibration. Even CRN measurement stations using PRT devices have a measurement uncertainty of +/- 0.3C – because it is recognized that field devices can’t be perfectly calibrated and remain that way over time. The satellite devices wouldn’t be any different. Having multiple references really doesn’t address the issue either. If *all* of the references have drifted how do you determine that? If just some have drifted how do you determine which ones are accurate and which are not?
Nor does this even begin to address the issue that the intervening media between the measurement device (the satellite) and the measurand (the atmosphere) impacts the measurement uncertainty since the properties of the intervening media can’t be accurately determined.
This is why a DETAILED measurement uncertainty budget is documented and provided for any high resolution measurement protocol. I can’t seem to find one for UAH.
Not necessarily so in terms of “suffering” (hah!). Many modern day instruments have what is commonly called “temperature compensation” to handle heating and cooling of the given instrument, independent of the heat gain/loss arising from internal or external causes.
Temperature compensation cannot reduce all temperature effects to zero.
Manufacturers of electronic instruments provide error specifications caused by operation away from the temperature at which it was calibrated with temperature coefficients.
“Temperature compensation cannot reduce all temperature effects to zero.”
I never stated or implied that it could.
Temperature compensation reduces, but does not eliminate, the effect that Tim referred to. The remaining residual effect needs to be incorporated into the propagation of error calculations.
How about you admit that your previous post indicated that you had no clue how the MSU was calibrated? Then we can discuss the method that is actually used.
How is transducer voltage converted to temperature?
It’s called the Planck function.
Oh. How is the voltage measured?
“How about you admit that your previous post indicated that you had no clue how the MSU was calibrated? Then we can discuss the method that is actually used.”
How about you address the issue at hand? It doesn’t MATTER how the calibration is done. It doesn’t matter if a PRT sensor is used. It doesn’t matter what the internal calibration standard is. THEY are all part of the measurement uncertainty budget! And *nothing*, not measuring devices, not, not standards, and not the environment remains *constant* and unchanging in field use. Even calibration lab calibration standards have to be checked at regular intervals!
The uncertainty in the UAH data INCLUDES measurement uncertainty as well as sampling uncertainty. Yet the measurement uncertainty part never seems to get mentioned or even defined!
Oh, please! How about the CMB temperature of 2.37 K and the natural resonant frequency of the cesium-133 atom (both referenced in a post of mine above). I’ll pile on by mentioning:
— the speed of light in vacuum
— the gravitational constant
— the fine structure constant
— Plank’s constant
— the magnitude of the charge on an electron or proton
— the magnetic moment of the electron.
How many of these are used in FIELD measurement devices for constant calibration of the measuring device?
Did you not read—more importantly understand—the post made above by Phil. at October 4, 2024 8:13 am wherein he stated:
“MSU uses an in-orbit calibration method that includes two calibration targets: the cosmic cold space and an onboard blackbody warm target. The cold space has a temperature of 2.73 K . . .”, with direct reference to https://www.star.nesdis.noaa.gov/smcd/emb/mscat/algorithm.php ?
The technique of viewing deep space as a calibration reference (aka “deep space calibration”) is used by many spacecraft having different “in the field” instruments, among such:
— Landsat Thermal Infrared Sensor (TIRS):
This sensor on Landsat satellites uses a mechanism to switch between viewing the Earth, a blackbody source, and deep space for calibration
— AIRS (Atmospheric Infrared Sounder):
This instrument on the Aqua satellite utilizes deep space views to calibrate its radiometric measurements
— MODIS (Moderate Resolution Imaging Spectroradiometer):
This sensor on various NASA satellites incorporates deep space calibration into its routine operations.
Field instruments that are based on the constant speed of light include laser-based optical interferometers, laser-based time-of-flight sensors, LiDAR systems, and ring laser gyros that rely on the Sagnac effect.
The primary field instrument based on the gravitational constant is the gravimeter; it measures the strength of the Earth’s gravitational field at a specific location by detecting small changes in weight, which is directly related to the gravitational pull at that point.
I am not aware of any field instrument that uses the fine structure constant.
The primary field instrument that directly determines Plank’s constant is the Kibble balance, used by NIST, but admittedly that is not “using” Plank’s constant as the basis of a calibration or fundamental input to the instrument.
Field instruments that are based on the charge of the electron are electroscopes and field force microscopes (used in electric force microscopy, EFM)
Field instruments based on the magnetic moment of the electron are electron paramagnetic resonance (EPR) spectrometers.
BTW, I have no idea what you mean by the term “constant calibration” . . . if a field instrument was in a constant calibration mode it obviously would not be able to perform any measurements.
Do you honestly believe that the cosmic microwave background radiation is constant everywhere?
from wikepedia: “The CMB is not completely smooth and uniform, showing a faint anisotropy that can be mapped by sensitive detectors. Ground and space-based experiments such as COBE, WMAP and Planck have been used to measure these temperature inhomogeneities.”
First, are these inhomogeneities large enough to affect calibration? Secondly the CMB is difficult to measure consistently because of directional variations and other effects from cosmic bodies, e.g. galactic emissions. In other words what the satellite sees from the “sky” will be dependent on its position when it “looks” at it. The CMB is only a part of the total emission intensity it will see.
“Field instruments that are based on the constant speed of light”
The speed of light is a fixed value because it has been defined as such, not because it has been measured as such. So what are you trying to claim? Every instrument you speak of has in-built systematic measurement uncertainty and saying that they use the “fixed speed of light as a calibration” is meaningless. If the “stopwatch” they use to measure the time it takes for a signal to travel between sensors has measurement uncertainty then so does the measurement instrument that is calibrated to the time measurement.
The real question that is at hand is that recognizing that all measurements have uncertainty then is that uncertainty large enough to make the measurement not fit for purpose unless it is accounted for. E.g. if you are only interested in how many hours it will take you to travel from Denver to St. Louis then a speedometer accurate to the millisecond is not needed. One with a measurement uncertainty of +/- 2mph would be plenty accurate enough for the purpose.
On the other hand, trying to differentiate temperature readings in the hundredths and thousandths digit using a measurement device with a +/- 0.3C measurement uncertainty means the measurement device is *NOT* fit-for-purpose. Climate science fools itself into believing that such measurement devices are fit-for-purpose by assuming that all measurement uncertainty is random, Gaussian, and cancels – i.e. the measurement uncertainty is zero and they can extend their “averages” out to however many decimal places their calculator can handle!
No, I never stated or implied such. You are commenting on anisotropy, which is a completely different from my comment/question to you about the drift rate of the average temperature of deep space as related to the current CMB temperature of 2.73 K (rounded off).
The range of temperature fluctuations (maximum anisotropy) in the CMB as accurately measured by satellite instruments is about 1 part in 25,000 (https://en.wikipedia.org/wiki/Cosmic_microwave_background ). That’s really pretty darn uniform.
BTW, as Stephen Perrenod, PhD in astrophysics from Harvard, commented on Quora:
“The characteristic temperature {of the CMB} is slowly decreasing. Around 11 or 12 billion years from now as the scale {of the size of the universe} doubles again its temperature will have dropped to 1.36 Kelvin and so forth.”
So that works out to a predicted drift rate of 0.00000012 K per thousand years . . . zero, for all practical purposes.
“When questioning a witness in a public trial, a good lawyer never asks a question for which he doesn’t already know the answer.”
— author unknown
If it’s not constant then you can’t use it as a 100% accurate calibration standard. It will have a measurement uncertainty factor associated with it.
Darn . . . I also should have asked Tim what he thinks the drift rate is for Grade 00 steel square gage blocks, “standards” used in metrology labs, at any given “constant” temperature (ref: https://www.higherprecision.com/products/gage-blocks/mitutoyo-516-401-26-steel-square-gage-block-set-81-piece-grade-00-includes-inspection-certificate ).
Oh well.
How many metrology labs have outside thermometers used in any of the temperature databases like NOAA’s?
I was addressing your false statements regarding the calibration, stating that it was done with reference to surface measurements with uncertainty in the units degree which as I’ve shown is untrue.
Regarding PRTs according to the National Institute of Standards and Technology: “PRTs can have high accuracy (0.01 °C), stability, and repeatability across a wide range of temperatures from -200 °C to 500 °C”.
The uncertainty in the UAH data is covered you can find links to it in the site I linked above.
You should do some more research. go here: https://www.piprocessinstrumentation.com/instrumentation/temperature-measurement/sensors/article/21219150/how-and-when-to-perform-periodic-verification-or-calibration-of-prts
————————————–
Excerpts:
“ Vibration, mechanical shock, temperature cycling or time near maximum temperature may cause the PRT to drift slowly.”
—————————————
Depending on the quality of the prt the measurement uncertainty can range from +/- [0.10 + 0.0017 | t | ] °C to +/- [0.25 + 0.0042 | t | ] °C.
(these are tolerance equations for Class A prt’s calibrated to two different standards)
Climate science has several canards that are typically used to justify calculating averages out to the hundredths digit or thousandths digit. 1. we are using PRT sensors that are 100% accurate and never drift over time and, 2. all measurement uncertainty is random, Gaussian, and cancels.
You are trying to justify canard No. 1.
I have read multiple articles on the subject and have used PRTs experimentally. And SPRTs have measurement uncertainties less than 0.001ºC.
Not after they leave the calibration lab — there is a lot more to temperature measurements than just the RTD.
Then why do CRN stations using PRT’s have a measurement uncertainty of +/- 0.3 C?
The climate science assumption that all measurement uncertainty is random, Gaussian, and cancels – including assuming 100% accurate PRT sensors – is just plain garbage. And this assumption is what you are trying to get people to believe!
“Then why do CRN stations using PRT’s have a measurement uncertainty of +/- 0.3 C?”
Presumably they chose that version rather than the SPRTs
“I have given you documentation on the measurement uncertainty of PRT sensors. Apparently you didn’t bother to read it.”
As I said I have read them, before you posted them..
“The sensor is not the only component in a temperature measuring device. Every component that reads the resistance of the PRT has its own measurement uncertainty that adds to the total. Every component that controls the airflow by the PRT has a measurement uncertainty that adds to the total. And on and on and on”
Indeed, and the scientists who designed and put together the system know that. Why should we take your assumptions about it when two days ago you didn’t even know how they calibrated the system!.
Even SPRT snesors drift. It’s only in climate science that they don’t.
“Indeed, and the scientists who designed and put together the system know that.”
Then why do they only provide sampling error and not measurement error for their results? *Climate” scientists simply wish measurement uncertainty away.
Perhaps you should read the papers I linked to on the subject of calibration of the MSU measurements rather than spouting your uninformed rants.
Perhaps you should learn something about the science of materials and metrology. Not a single reference you gave shows that even SPRT are 100% accurate when in the field, especially over time.
I know plenty about those subjects, I did not claim that SPRTs are “100% accurate”. The people who designed the systems evaluated them including drift and I will take their evaluation over someone who doesn’t know anything about the system and didn’t even know how the calibration system worked until I told you a few days ago!
“Calibration standards drift just like anything else.”
OK, so what is the scientifically-determined drift rate for the cosmic background radiation temperature of 2.73 K?
Separately, what is the drift rate of the frequency reference used in atomic clocks: the natural resonant frequency of the cesium-133 atom, which is defined as exactly 9,192,631,770 Hertz (Hz), and is used to define the international standard for the “second” as used in the SI unit system.
How many FIELD measuring devices employ these for real-time calibration of measurements?
See my reply above, posted October 5, 2024 9:25 am, to this same question.
In that response of mine, I didn’t mention the field instruments that use atomic clocks, so thank you for the opportunity to now do so.
Technology areas employing field instruments that use atomic clocks to provide precise (!) timing are:
— Satellite-based positioning systems
Atomic clocks are used in, and fundamental to, GPS navigation systems
— Telecommunications networks.
Atomic clocks are used to synchronize transmitters and receivers in digital communications systems.
— Space exploration
Atomic clocks are used in space probes to assist navigation. NASA’s Deep Space Atomic Clock was the first atomic clock small enough to fly on a spacecraft beyond Earth’s orbit.
— Scientific research
Atomic clocks are used in scientific research to help with fundamental science.
Of course, these answers were all readily available to you if you cared to educate yourself via Web searches.
Taking cues from bozo-x now?
Apparently. What do atomic clocks have to do with field temperature measuring devices?
You didn’t answer the question. How many field temperature measuring devices use atomic clocks to do their measurement of temperature?
You keep dancing around the issue and throwing out red herring argumentative fallacies in the hope you can fool people into thinking that UAH has no measurement uncertainty.
Total fail.
Yep, my thoughts exactly — a load of red herrings.
Nick’s finger painting class, strikes again. !
Showing that the energy released from the El NIno is finding it hard to escape.
Of course he will shy away from producing any evidence of any human causation.
Isn’t basing anything on the Gregorian calendar deemed white supremacist these days Nick?
I mean, why aren’t we white supremacists basing our research references on say, the Jalali calendar?
Diversity, equity, inclusion and all that?
So, Nick, can you give us the mechanism for how CO2 suddenly caused this huge increase? Or is there some natural event causing it?
Mr. Nice: Indeed, and a notable lack of response from Mr. Stokes and the minions.
Nick can you send some of that heat to north east Wales – thanks.
Mr. Andrews: Maybe he could, if he knew how it worked. Don’t hold your breath (to prevent CO2 emission, of course).
I can’t see the proclaimed up-coming La Niña based on this latest GLAT update from UAH. What’s up with that?
We are currently in a neutral stage or declining El Nino stage. (Can only be correctly categorized after the fact.)
After the definitive end of an El Nino stage there is a time lag before the reduction in UAH temperatures is observed. I believe the time lag is variable, but usually on the order of five months?
“We are currently in a neutral stage or declining El Nino stage.”
Hmmm . . . there seems to be a difference of opinion on that.
Here, from https://www.cpc.ncep.noaa.gov/products/analysis_monitoring/enso_advisory/ensodisc.shtml :
“La Niña is favored to emerge in September-November (71% chance) . . .”
And the WUWT ENSO meter in the right column of this webpage indicates we’re right now on the border between neutral conditions and La Niña conditions.
Hence, my question.
I saw somewhere that the NCEP 2m temp has dropped by 0.34C..
Seems to be not showing up in the atmospheric temperature yet, though.
See my other comment for more detail. ONI is the rolling three month average SST anomaly in a small area of the equatorial Pacific Ocean. The most recent published value is 0.1C in the middle of neutral territory, but this is for June-July-August. The August monthly value was -0.07C. The September value should be available any day now, but the daily data does show further decline towards La Niña territory which starts at -0.5C, but it’s not quite there yet.
Correct. The generally-accepted delay is 4 to 5 months. The last peak in sea surface temperatures (SSTs) in the Niño-3.4 region of the equatorial Pacific Ocean was for April 2024 (the basis for the Oceanic Niño Index, ONI). So, we are now five months after that and, therefore, if the relationship remains valid, we would expect to see UAH global temperatures to start to drop next month (October report). If you are interested in a bit more detail, read on.
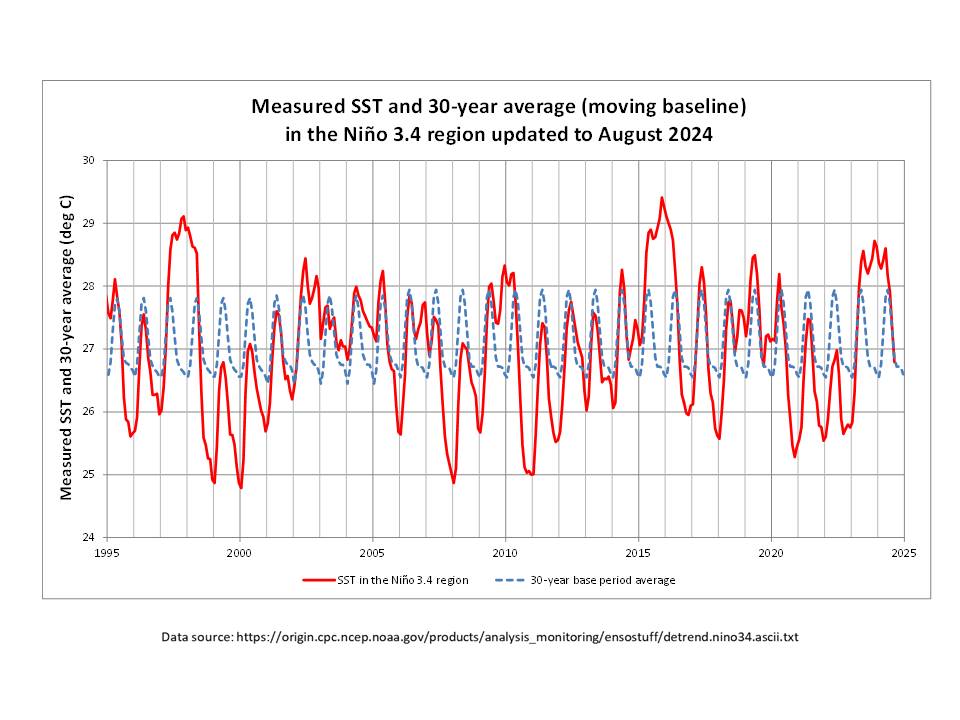
The Oceanic Niño Index (ONI) is one basis used for defining El Niño/La Niña events, where it reflects the rolling three-month average of sea surface temperature (SST) anomalies in the Niño-3.4 region of the equatorial Pacific Ocean. In the figure below, I show the measured SST values themselves (not the anomalies) which is quite informative in my view. It also shows the 30-year average SST values, which are used to compute the anomaly values (i.e. the difference between the two curves).
(September SST value not yet reported).
The SST values show very clearly the distinction between significant El Niño (warmer than average) and La Niña (cooler than average) events, with the two ‘very strong’ El Niño events (1997-1998 and 2015-2016) clearly standing out. The recent (2023-2024) El Niño is over now, but followed a similar pattern though peaking at around 0.5C lower, hence the classification as ‘strong’ rather than ‘very strong’. The most striking similarity (to me) is the duration of the high 2023-2024 SST event, which was virtually identical to the two ‘very strong’ El Niño events with higher SSTs than average extending from May through to the following May (May is the peak of the average SST values shown in blue dashes). In other words, there was no significant difference in overall duration of the three strong to very strong events from a ‘local’ SST perspective.
An apparent difference can be seen, however, in the shape of the SST variation within that duration. Perhaps it is just noise, but the three peaks of the SST values highlights the possibility that the current UAH global LT temperature data could still be entirely consistent with a 4 to 5 month delay. The SST peaks in the Niño-3.4 region were June 2023, November 2023 and April 2024, while the UAH global peaks were October 2023 (4 months) and April 2024 (5 months). If October’s UAH global LT temperature shows the start of a decline such that September turns out to be another peak, that would also equate to a 5 month delay. We will need to be patient before drawing any firm conclusions.
Nice hockey stick.
Since this is a monthly update I figure other monthly metrics might be at least tangentially relevant. DMI report a new record low Arctic sea ice volume for the month of September beating the old record set back in 2012. [Source]
MODEL
Still a lot of recovery to go to get down to the levels of the rest of the Holocene
There is still a heck of a lot of sea ice up there compared to the last 10,000 years.
Everyone knows the planet is still in “cold house” conditions with relatively low levels of atmospheric CO2.
PIOMAS since 2011.
Notice how he always ignores you.
I think you will find everyone with a brain ignores him.
Noted that you didn’t ignore.
But we know you haven’t got a brain.
You keep helping prove my prediction… Thanks. 🙂
Flora and fauna increased!
Actual observations by NOAA show no such thing.
https://nsidc.org/data/tools/arctic-sea-ice-chart/
Check out Super El Niño year 2016, for instance.
That link is for extent and comes from the NSIDC. This subthread is about volume from DMI.
Volume is totally bogus. More lies by the CACA cabal.
How do they contour the underside of the ice?
I don’t know, but if you 3D contour above sea level, and can estimate sea and ice density, you don’t have to.
Apparently, I didn’t think of this first..
https://www.sciencedirect.com/science/article/abs/pii/S0165232X20304249
This year has been tracking very closely with 2007. Red trace is 2012.
Although it’s well-known that ice melts more from underneath, this is still a bit surprising to me.
A warming planet is a healthier planet as the Greening continues.
Fewer cold deaths trend continues, warmer days fewer deaths continue.
My heating bills are declining due to less winter cold.
When the Hunga Tonga water effects dissipates the temperature will drop back down significantly in a year or two from now and possibly not get this warm again for many decades ahead as the inevitable cooling period will commence.
Enjoy it while it lasts.
See a few charts I posted above.
Still a lot of HT WV in the Stratosphere particularly toward the poles.
What is the model delay between CO2 added and temperature increase settled? I know the models are not good, I just want to know what the expected delay is.
For Equilibrium Climate Sensitivity (ECS) in which only the fast feedbacks are allowed to play out it is on the order of 100 years.
For Earth System Sensitivity (ESS) in which the slow feedbacks are also allowed to play out it is on the order of 10,000 years or longer.
Sounds like modeled bullshit to me.
YAY! I’ll be dead and not worried under both of your scenarios.
I’ve never heard ESS used by anyone. The common terms are ECS and TCR
eg from here : https://archive.ipcc.ch/ipccreports/tar/wg1/345.htm#:~:text=The%20%EF%BF%BDtransient%20climate%20response,commitment%EF%BF%BD%20has%20been%20realised.
ECS:
This much longer than 100 years as it is the time taken for the oceans to complete their warming to depth. Its thousands of years.
In the context of models (but it applies to the earth too)…
TCR:
So its the instantaneous impact of additional CO2. There is basically no lag for this one.
IPCC AR6 WGI Annex VII pg. 2223.
“This much longer than 100 years as it is the time taken for the oceans to complete their warming to depth. Its thousands of years.”
I’ve never seen this spelled out rigorously and with the math. I often ask for this, but I’ve yet to get a response.
“For Equilibrium Climate Sensitivity (ECS) in which only the fast feedbacks are allowed to play out it is on the order of 100 years.”
Do you have a hard primary reference for that, i.e. not an IPCC summary, but a real scientific work, including the math?
[Hansen et al. 2023]
[Sherwood et al. 2020]
Ha ha ha, you thought I wouldn’t read them didn’t you?
The first reference mentions ECS once and not in the context of my question.
The second one has this definition:
Quantifying ECS is challenging because the available evidence consists of diverse strands, none of which is conclusive by itself. This requires that the strands be combined in some way. Yet, because the underlying science spans many disciplines within the Earth Sciences, individual scientists generally only fully understand one or a few of the strands. Moreover, the interpretation of each strand requires structural assumptions that cannot be proven, and sometimes ECS measures have been estimated from each strand that are not fully equivalent. This complexity and uncertainty thwarts rigorous, definitive calculations and gives expert judgment and assumptions a potentially large role.
========================
This, my friend, is what all of your clownish, hand-waving shiite is based on. Oh, it’s clownish, hand-waving shiite. What a surprise.
But thank you anyway for providing your best shot. I’ll be sure to give you an honorable mention at the top of some future posts.
You asked for a reference. I gave you two that discusses ECS, which feedbacks are considered, the timeframe in which they play out, and the math involved. There is also an extensive bibliography that can be cross referenced to drill down into the finer details. If this wasn’t what you wanted then why ask me to help you with your query?
ECS is pretty important, right? Its units, and the corresponding numerical value of ECS is the number upon which the climate crisis is based. It is the key number for everything “climate” in the world right now, politics, trade, bike lanes, heat pumps, regulations, taxes and the list of shiite goes on.
It doesn’t have a definition. Don’t you think that’s a bit odd?
I do. I think that you probably performed admirably and gave me the best references you could. If I’m wrong, give me a better one – no kicking the can down the road and telling me I have to go find a fuck!ng bibliography. Give me the definition, not the tenth-rate scientist gobbledegook I excerpted above.
This isn’t a game of linguistics. Post the best scientific definition of ECS that you know. If the above is it, then own it – you posted the reference.
As usual, I have composed a graph for Australia showing the monthly update of the Monckton style “pause” for the 8 years and 8 months prior to the start of this October.
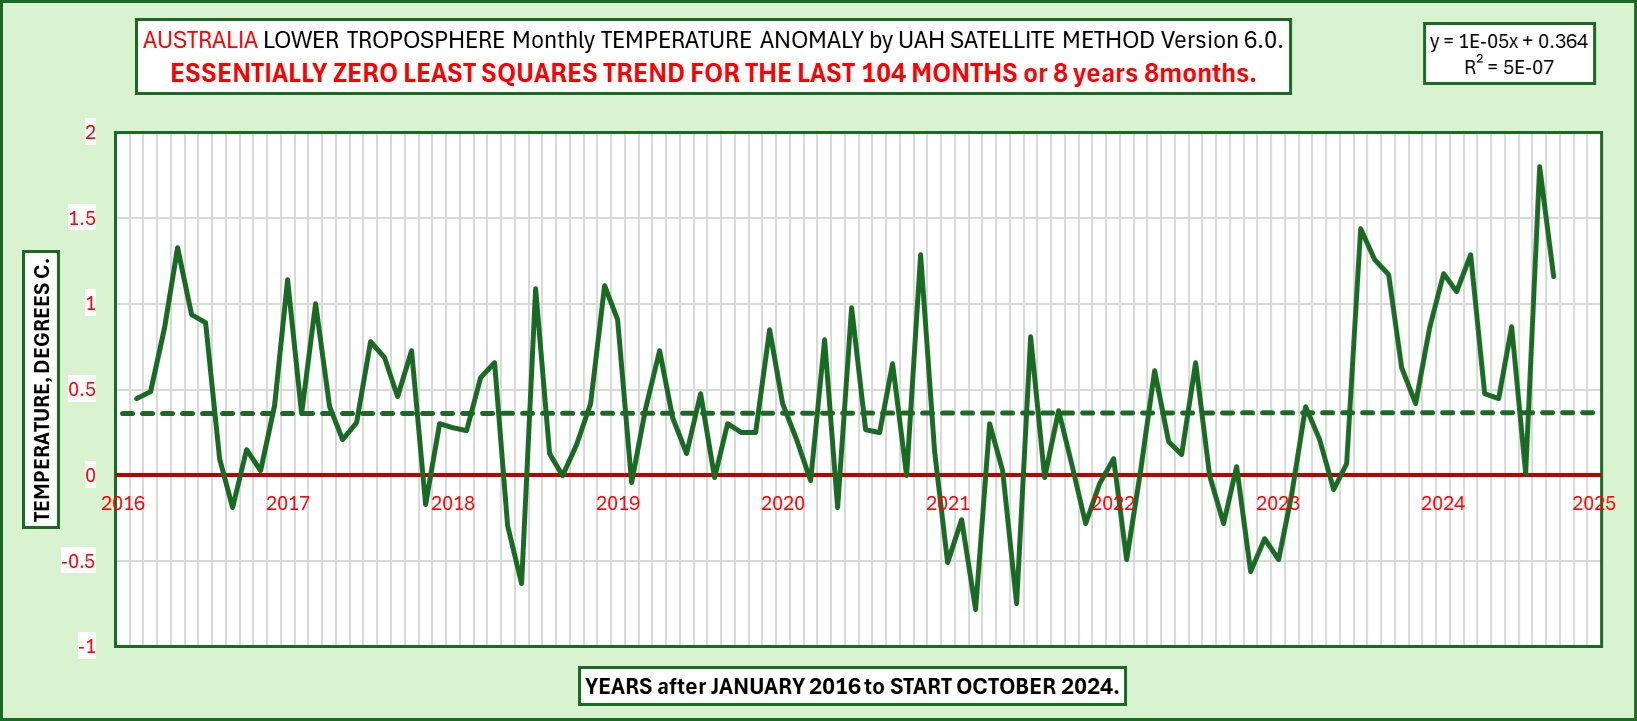
This month is a little different. If I wanted to be strictly accurate (beyond the uncertainty of the data) I would use a negative trend as the criterion to select the number of months. Alas, by this criterion, we have a pause of only 9 months to now.
If however, we accept that a trend of +0.000001 is close enough to zero, then we have a pause of 8 years and 8 months to now.
I mention this “knife edge” point that appeared this month to stimulate discussion. My scientific mind tells me to report only the 9 month result, because come next month, a 10 month pause is quite possible and I’ll have to make excuses and use caveats to maintain a long pause like 8 years.
But then the pattern of a great deal of climate change research is to torture data until it confesses in favor of the researcher. It is a shame that so much climate change research has caveats. The oft-quoted expression that “Heatwaves are becoming longer, hotter and more frequent” is in this category. A big majority the the Australian stations that I have analyzed do not comply with this favorite chant because, hey! it is climate change research and we know how to use caveats!
Geoff S
If you wanted to be strictly accurate you would use a negative trend beyond the AR(1) or equivalent uncertainty envelope.
The 9m trend from 2024/01 to 2024/09 is -0.1 ± 15 C.decade-1. You cannot conclude that the trend was actually negative with statistical significance.
The 104m trend from 2016/02 to 2024/09 is +0.02 ± 0.6 C.decade-1. Not only is this not negative, but it does it even comply with your +0.000001 criteria. Regardless you cannot conclude that the trend was actually negative with statistical significance.
Ok, but your going to have to relax your definition of statistically significant so much that it allows ± 15 C.decade-1 of uncertainty.
Considering you’re looking at an uncertainty on the order of ± 10 C.decade-1 for a 10 month trend we’ll need to see October come in well below -1.0 C. I don’t think that’s possible.
Just like Monckton you weren’t able to maintain a statistically significant pause like 8 years at any point in time. There’s just too much uncertainty.
HAHAHAHAHAHAHAHAH
This from the dude who still can’t figure out that error is not uncertainty, and thinks the door on a convection oven heats the inside of the oven.
I am going to go out on a limb and predict this trend will continue into 2025 possibly early 2026. Then I hypothesise that the trend will reverse.
Could the lingering temperature anomaly have anything to do with this heat source?
Why El Niños Originate from Geologic, Not Atmospheric, Sources — Plate climatology
Written by James E. Kamis
…the 1998 and 2015 El Niños are so similar. If the atmosphere has radically changed these El Niños should be different, not absolutely identical.
.
In an attempt to somehow explain this giant disconnect, climate scientists have been furiously modifying their computer-generated climate models. To date the updated climate models have failed to spit out a believable explanation for this disconnect. Why? Their computer models utilize historical and current day atmospheric El Niño data. This atmospheric data is an “effect” of, and not the “cause” of El Niños.
All El Niños have originated at the same deep ocean fixed heat point source located east of the Papua New Guinea / Solomon Island area.
Looks like 1998. We’ll have to wait to see what’s on the other side. And we’ll have to accept whatever happens. I know nature will.
Forget all this hair splitting about means and averages. UAH is the best we’ve got. This cluster of record highs , five months now is it? Is unique in the satellite record. Are we expecting a La Niña tumble? A bit slow. Mebbe next month?
So how these numbers are obtained is unimportant?
It’s 15-months. Every single month since July 2023 has set a new warmest monthly record in UAH.
It must be exhausting living on your planet.
I have noticed lately that when questions of measurement error and measurement uncertainty come up in these discussions, karlomonte often points out that error is not uncertainty and he’s done it again here.
His point seems a perfectly valid one to me because the concepts of error and uncertainty are fundamentally different in nature, despite corresponding in some ways in some situations, and I think we risk creating general confusion if we conflate them together in mathematical statistics as seems to be happening regularly and routinely in the discussions here where some people appear to be using the terms interchangeably to mean the same things, which they definitely are not.
This issue may often be inconsequential in general public discourse, where words may have arbitrarily loose meanings that don’t have to be precise and their nuances are considered more important than their dictionary definitions. But in mathematical statistics I think more rigorous standards need to apply if we want to avoid repeating the downfall of the legendary Tower of Babel due to a ‘confusion of tongues’ that’s been allowed to spread unchecked.
Although there may be some special situations in which a particular measurable (or otherwise quantifiable) variable may be employed as a proxy for uncertainty, a so-called standard error is not one of them and it is a fundamental error of thought to assume that it can be. It is true that a certain amount of uncertainty is implicit in every standard error but the problem is that it’s the same, standard amount of uncertainty that’s implicit in every standard error of the same kind regardless of the size of the standard error. In other words, while the specific value of the variable that we are using as a proxy for uncertainty is variable by definition and may be different in every instance, the specific value of the uncertainty associated with that proxy value is invariant by definition and exactly the same in every instance. Hence the irreconcilable mismatch between variable standard error measurements and intrinsically invariant measurements of uncertainty.
So, when we look at the data-points plotted on a graph purporting to display measured temperatures together with their standard error ‘bars’ of different sizes, those different-sized error-bars all have the same amount of implicit uncertainty associated with them. And, likewise, if we then observe the value of the trend in that data-plot together with its calculated standard error and compare that with the possibly different standard error of the trend in a different data-plot, although the values of the two standard errors are different the amount of uncertainty implicit in each will be exactly the same – by definition.
Perhaps surprisingly, it has been possible – for the past three-quarters of a century since the advent of Information theory, in fact – to measure, or calculate directly the amount of uncertainty present in any situation where the probability of its occurrence can be known. Since Information theory defines uncertainty mathematically as the negative of information, it also expresses uncertainty in units of information (usually bits, short for ‘binary digits’). These units are commensurate and so they enable quantities of uncertainty to be subjected to the normal arithmetical operations of addition, subtraction, etc..
You are exactly right—error is the distance of a measurement from the true value, which modern metrology postulates is unknowable***. Uncertainty OTOH is a best estimate of an interval, derived from a measurement, within which the true value is expected to lay. They are very, very different. Uncertainty is placing a limit on what is known about a measurement result, a limit on knowledge.
Uncertainty theory and analysis uses statistics, but it is not a subset of statistics. Blindly calculating an SEM (standard error of measurement) does not tell you the uncertainty, nor does it give you a true value (except in very specific and limited circumstances). This why the term itself has been deprecated in metrology.
***There are special cases of quantities that have zero uncertainty, so that the true values are known, but these are by definition through international agreements. The speed of light is one of these—its value is exact on the basis of how it is defined in SI units.
Very good summary!
I would only add that the SEM is *NOT* a measure of uncertainty in the measurand nor is it a statistical descriptor of the parent distribution. It is an inferential statistic describing the sampling process.
The SEM is purely a measure of sampling error, and it requires MULTIPLE samples to be taken in order to accurately calculate it. It is *not* the measurement “error” or measurement “uncertainty”. In fact it is an *additional* factor in the measurement uncertainty of the measurand.
Climate science has typically one sample. Thus climate science uses the standard deviation of that single sample as the standard deviation of the population and from there calculates the SEM ==> SEM = SD/n. But this is only an ESTIMATE of the SEM since there is no guarantee that the SD of the sample is the same as the SD of the parent distribution. So even climate science’s SEM has its own uncertainty which is always ignored!
It also needs to be pointed out that many times climate science uses the term “standard error” with a trend line and its fit to the data. This is *not* a true “standard error”. It is a BEST-FIT metric. It is not a statistical descriptor of anything, it is an inferential statistic as well and describes the fitting process of the linear regression. It has nothing to do with describing the measurand at all. And the fact that it is typically calculated using only the stated values of the measurements while ignoring the measurement uncertainty associated with the data only compounds the misunderstanding of what the best-fit metric is describing.
A fact at least 99% of the practitioners here routinely and conveniently ignore.
Yep!
I should have added in reply to JP’s very pertinent observations: binary numbers as used inside computers and instrumentation are another limit on knowledge, and a hard limit. There is no way to increase the resolution of a 16-bit integer, it cannot be smaller than one bit. Averaging won’t make it an 18-bit integer.
“A fact at least 99% of the practitioners here routinely and conveniently ignore.”
That and the fact that their data does not even consist of *measurement samples”. It consists of mis-named “averages” of daily measurements which are not truly an average. This stems from assuming the daily temperatures are a Gaussian distribution where the average is the mid-point between the minimum and maximum values. So their single “sample” is a sample of statistical descriptors and not of actual measurements!
Predictably, now that UAH is warming as fast, if not faster, than the main surface data sets over recent decades, the previously ‘golden’ couple, Spencer and Christy, have been thrown under the bus by some parties here.
Twice now, over the years, (and who could rule out a third attempt?) Christopher Monckton has strung along the faithful here using short term trends in satellite data, first RSS then UAH, with confidence intervals blissfully ignored. Not the slightest hint of an objection did there come from the ‘skeptics’ here.
Now that the (constantly changing) cherry-picked start-points Monckton used all show strong best-estimate warming trends, suddenly there is a clamour for confidence intervals to be taken into account. It will be interesting to see if Lord M fools you guys a third time if La Nina cooling opens up another short-term statistically insignificant pause. If so, expect the current fixation on confidence levels to once again quietly subside.
An example?
Congratulations in writing the highest, widest load of verbal diarrhoea on this thread so far. Funny how you can crap all over the M pause but love to hang your hat on a temporary spike, somehow considering it’s importance to out-weigh that of any pause.
Perhaps you might consider ignoring the non co2-caused current anomaly for a moment and have another good look at the state of affairs in 2022 waiting for you at the top of this page. You know, before your head explodes or something.
No doubt, you truly are a moron.
“ Funny how you can crap all over the M pause but love to hang your hat on a temporary spike, somehow considering it’s importance to out-weigh that of any pause.”
Yep. For far too many climate “scientists” history began when they were born. They don’t recognize that the spike we are seeing is similar to the one we saw in the 20’s and 30’s. So what we are seeing today is “unique” to them and must be caused by something that is different *today*.
“No doubt, you truly are a moron.”
Yep. Consider these two assumptions he uses: 1. CO2 is well mixed globally. 2.CO2 is the main contributor to “warming”. If CO2 is well mixed and causes warming then why are some areas (like the central US) cooling instead of warming?
I am absolutely in agreement with this post.
Idiot.