By Kenneth Richard on 30. August 2024
“Clearly, the atmospheric CO2 observation data are not consistent with the climate narrative. Rather, they contradict it.” – Koutsoyiannis, 2024
Per a new study, the Intergovernmental Panel on Climate Change (IPCC) utilizes “inappropriate assumption and speculation,” as well as non-real-world models of “imaginary data,” to claim CO2 emissions derived from fossil fuel burning function “weirdly,” far differently in the atmosphere than CO2 molecules derived from natural emissions (e.g., plant respiration, ocean outgassing) do.
“The ambiguity is accompanied by inappropriate assumptions and speculations, the weirdest of which is that the behavior of the CO2 in the atmosphere depends on its origin and that CO2 emitted by anthropogenic fossil fuel combustion has higher residence time than when naturally emitted.”
While the IPCC acknowledges emissions from natural sources have an atmospheric residence time of only 4 years, they have simultaneously constructed model outputs that assert CO2 molecules derived from fossil fuel emissions remain in the atmosphere for hundreds, thousands, tens of thousands, even several one hundred thousands of years.
Per the IPCC:
“15 to 40% of an emitted CO2 pulse [from anthropogenic emissions] will remain in the atmosphere longer than 1000 years, 10 to 25% will remain about ten thousand years, and the rest will be removed over several hundred thousand years.”
“Carbon dioxide (CO2) is an extreme example, its turnover time is only about 4 years because of the rapid exchange between the atmosphere and the ocean.”
Again, a four-year residence time for natural CO2, but hundreds of thousands of years residence time for CO2 molecules elicited from fossil fuel burning. It would seem just about any result can be derived from imaginary data.

Image Source: Koutsoyiannis, 2024
Instead of relying on models built on assumption and speculation, Dr. Koutsoyiannis utilizes a well-established, hydrology-based theoretical framework (refined reservoir routing, or RRR) combined with real-world CO2 observations to robustly conclude the residence time for all CO2 molecules, regardless of origin, is between 3.5 and 4 years.
The applied theoretical results match the empirical results so closely (e.g., an empirical mean of 3.91 years vs. a theoretical mean of 3.94 years at Barrow, and an identical 3.68 years for both empirical and theoretical means at Mauna Loa from 1958-2023) that the theoretical framework can be said to be “close to perfect.” In other words, the consistency of the applied calculation with real-world observations provides robust evidence that CO2 residence time is likely close to this range.
In contrast, the calculated probability for the modeled, imaginary-data-based claim that the residence time for a CO2 molecule persists for over 1000 years is 10⁻⁶⁸, which means the probability value is “no different from an impossibility.”

Image Source: Koutsoyiannis, 2024
A residence time of only 4 years for all CO2 molecules, regardless of origin, is consistent with the conclusion that nature is dominant in driving changes in CO2 concentration. Fossil fuel emissions serve only a minor role.
Since 1750, additions to the atmospheric CO2 concentration derived from natural emission sources associated with biological processes are about 4.5 times larger than the contribution from fossil fuel emissions (e.g., 22.9 ppm per year from nature, 5.2 ppm per year from fossil fuel combustion).
In other words, observed CO2 data contradict the climate narrative that says anthropogenic fossil fuel burning is driving CO2 concentration changes.

This seems to agree with the analysis of Jamal Munshi in his paper “Responsiveness of CO@ur momisugly to Fossil Fuel Emissions”
Moderators My previous comment is compromised and should be removed.
In a 2017 article Munshi denied that manmade CO2 emissions were causing a rising atmospheric CO2 level. I have no access to any of his more recent Facebook claptrap. He is obviously a fool on the subject of climate science.
DMA, Munshi in one of earlier works, first detrended the increase in the atmosphere, thus effectively removing the cause of the increase – human emissions – and then did prove that human emissions were not the cause of the increase…
My deepest thanks to WUWT for posting about my paper and, especially, to the original author of the post, Kenneth Richard.
Thanks also to those who read my paper and those who posted their comments about it, whether they had read it or not.
Glad to hear it brought fun and laughter to some (including Kamala) even without having read it. 🙂
For those who haven’t read it, I would suggest a read, starting from the epigram, which I copy here:
Then they could read the Glossary to see my attempt to clarify the related concepts and combat IPCC’s intentional vagueness. (See section 3 for a description thereof).
I tried to be consistent with science, rigor and reason, which necessarily means that I had to be inconsistent with IPCC’s intentional vagueness.
I must therefore warn interested readers that they may have difficulty in trying to find a correspondence between the content of the paper and the IPCC’s vagueness.
Demetris,
I do find it extremely unfortunate that Kenneth Richard used this forum, while the discussion at NoTrickZone still is going on and that we will have this discussion hopefully worked out at the workshop in Athens, September 19th under the supervision of Clintel.
I have had similar discussions already 20 years ago with fellow skeptics and also 14 years ago on this forum:
https://wattsupwiththat.com/2010/08/05/why-the-co2-increase-is-man-made-part-1/
https://wattsupwiththat.com/2010/08/20/engelbeen-on-why-he-thinks-the-co2-increase-is-man-made-part-2/
https://wattsupwiththat.com/2010/09/16/engelbeen-on-why-he-thinks-the-co2-increase-is-man-made-part-3/
https://wattsupwiththat.com/2010/09/24/engelbeen-on-why-he-thinks-the-co2-increase-is-man-made-part-4/
With over 600 responses for some of them.
My opinion got compiled at following website:
http://www.ferdinand-engelbeen.be/klimaat/co2_origin.html
Others also came to the same conclusion of an around 50 years “adjustment time”, while the 4 years residence time is completely irrelevant for the removal of any extra injection of CO2 out of the atmosphere:
Ir, Peter Dietze, already in 1992, here reflected at the late John Daly’s website in 1997:
http://www.john-daly.com/carbon.htm
Prof. Lindzen:
https://www.youtube.com/watch?v=69kmPGDh1Gs
Dr. Spencer:
https://www.drroyspencer.com/2019/04/a-simple-model-of-the-atmospheric-co2-budget/
And here at WUWT, our clear thinker, Willis Eschenbach:
https://wattsupwiththat.com/2015/04/19/the-secret-life-of-half-life/
That the IPCC uses a different “adjustment time”, based in the faulty Bern model, doesn’t prove that the 4-years residence time has anything to do with the real removal rate of any extra CO2 injection into the atmosphere…
Do warm seas hold more or less carbon dioxide than cold seas? If cold seas hold more then one would expect that atmospheric levels to decrease until equilibrium is reached. As the seas warm then there’s outgassing until equilibrium is reached. Therefore during an extended glacier period the atmosphere would be drier with less carbon dioxide. In the middle of Antarctica is there measurably less carbon dioxide than in the middle of the Northern Territory of Australia, if this is possible of course?
Of course carbon dioxide molecules from anthropogenic sources are labelled so that plants know not to absorb them.
Study the comments I made earlier on this thread and you will find that there is much truth in the comment you made: the warmer the seas the more CO2 up in the air.
PS. Be careful with the Keeling curve. It could be a bit adjusted to go along with AGW….
Yes Henry, but only 16 ppm sea CO2 emission per degree.
Nope…
Look at the graph from Ennersbee that I posted earlier.
That is not temperature sensitivity, that is spurious correlation.
JohnC, the influence of the ocean surface temperature on CO2 in the atmosphere is not more than about 16 ppmv/°C over the past 800,000 years as seen in ice cores. Recently confirmed by the formula of Takahashi, based on near one million seawater samples with the formula:
(pCO2)seawater @ur momisugly Tnew = (pCO2)seawater @ur momisugly Told x EXP[0.0423 x (Tnew – Told)]
Or some 4% increase per °C.
That makes an increase of about 13 ppmv since the Little Ice Age, That is all.
The measured increase is 135 ppmv of which thus 10% from the increased ocean surface temperature, the rest from the over 200 ppmv human emissions. Labeled or not…
It appears that at-signs cause strange behavior for WUWT’s WordPress installation. Takahashi’s formula should be:
To repeat, one should not use the Mauna Loa CO2 concentrations for critical applications where small differences matter. The ML numbers are culled (“cherry picked”) before release, as extensively described on web sites.
For some uses, this culling does not matter much apart from offending scientific purity. For other applications, errors are likely.
Consider a scenario with a coal burner making electricity with CO2 pouring out the chimney. The neighbourhood is agricultural with large, vigorous maize fields growing by sucking up some of that CO2. It never gets near Mauna Loa, or other noted sites like South Pole, Cape Grim etc.
I do not know what fraction of total CO2 emissions ever make it into the ML numbers. Some of it is purposely rejected as described. One has to assume that a fraction of total CO2 emissions are not currently recorded.
Culling also happens when researchers deal with early estimates of global CO2. A pre-industrial level of 280 ppm is currently trendy, but almost certainly wrong. Beck has documented thousands of analyses above 300 ppm, but these are currently ignored.
Culling is dangerous. It is subjective, potentially different from author to author. If some numbers are planned to be culled out of sight, proper science demands an explanation.
Geoff S
Geoff,
I would expect better from you: one can obtain all measurements of Mauna Loa as one-hour averaged measurements, including the variance over that hour.
All raw data.
Some of these data are marked as unreliable, because of wind from the volcanic vents (+4-5 ppmv) and others because of upslope winds from the valley in the atfternoon (-4-5 ppmv). These data are “flagged and not used for daily, monthly and yearly averages.
But if you plot the data with or without the outliers, that doesn’t even change the result at the end of the year with 0.1 ppmv:

Only less noise around the trend…
And about the historical data: never measure over land near trees, grass, cars, houses, towns,… Or you can measure any CO2 level that you (don’t) want. Not global levels, except over the oceans, coastal with wind from the sea, on the top of mountains or in (ice) desserts…
See: http://www.ferdinand-engelbeen.be/klimaat/beck_data.html
Compare the modern station data of Giessen (Germany – near the exact location of the main data of Beck’s “peak”) under inversion for the same days as for Barrow, Mauna Loa and South Pole, all raw, uncorrected data:
Simple calculation of the carbon mass balance with the figures supplied, shows that Koutsoyiannis’ theory is wrong:
From Figure 9 in the above story:
Human carbon balance: 5.2 ppmv/year in – zero out = +5.2 ppmv/year.
Natural carbon balance: 101.5 ppmv/year in – 104.1 out = -2.6 ppmv/year.
The natural “contribution” of CO2 in the atmosphere over the past 6 decades was near always negative, thus can’t be the cause of the increase in the atmosphere…
Ferdinand
You are ignoring Lance Ennerbee’s graph who finds a near 100% correlation with the increase in T (of SST) and the increase in [CO2] in the atmosphere. Now if you say, like Hans, that it is only 16 ppm der + 1 degree K (SST), then surely you are only fooling yourselves. With wft (HADSST3) I calculate with Ennerbee’s formula exactly the 420 that we are sitting on now. No room for much else. 2 things happened that may have confused people, mostly imho it is Keeling’s fault for not clearly pointing it out. 1) SST has generally been rising since he started measuring CO2 and 2) when SST was falling they changed the procedure for measurement from the wet-chemical to the FTIR method. That may have pointed to ‘errors’ in the past, so I suspect that was conveniently being used to get things smoothed out.
Now if you – and others here – are saying that it was the increase in CO2 that caused SST to rise, then you must prove that to me. And here we are again – I am sure I have asked you earlier to prove that to me. Remember, percentagewise v/v we are looking at a change of only 0.01% extra CO2 in the atmosphere that must cause a rise of at least 0.6 K of SST over the past 40 years or so.
I have already worked out for you that it is not the extra CO2 in the atmosphere that causes any extra warming of earth….
“You are ignoring Lance Ennerbee’s graph “
Enough of this nonsense graph. What he did was to compare 12-month smoothed CO2 with 21-year smoothed SST over a 23 year period. The CO2 is smooth, almost linear. The SST is smoothed so much that it is almost linear. With the re-scaling needed to match one set of units to another, you can’t fail to get a good correlation between two line segments.
Nick.
Fill in the current delta SST from 1985 in Ennerbee’s formula. What do you get?
What does that mean? If you have any two variables that are virtually linear in time, they will have near perfect correlation, and a ratio of trends. They can be totally unrelated, doesn’t matter.
So
What was the result?
You are not getting it.
You cannot work it out because you are stuck into your own thinking of what the truth must be. But I am thinking of the same trouble here we have with FE. What is the point of discussing this point about the increase in CO2 in the atmosphere if you never calculated what warming the delta CO2 is causing?
It is nothing…
https://breadonthewater.co.za/2022/12/15/an-evaluation-of-the-greenhouse-effect-by-carbon-dioxide/
Henry,
Enderbee’s formula is nonsense: He assumed that there were no human emissions and all increase in the atmosphere was from warming oceans. As both are straight lines (if you average everything) then of course you can fit both with a simple formula.
The only problem: the increase is far beyond Henry’s law…
Henry…
1) There are three lines over the past 65 years (if you average everything): temperature, human emissions and increase in the atmosphere.
The increase in temperature since 1958 is 0.6°C. According to Henry’s law, a new equilibrium (wherever that may have started in 1959) between ocean surface and atmosphere will be reached when CO2 in the atmosphere increases with 8 ppmv, using the formula of Takahashi, which exactly calculates the CO2/T relationship over the past 800,000 years.
8 ppmv increase by warmer ocean surfaces.
110 ppmv increase observed.
over 200 ppmv CO2 added by fossil fuel burning over the same period.
2) What are you saying? Keeling developed a far more accurate gravimetric chemical method for measuring CO2 than the usual titration technique already in the 1940’s, He did make his own equipment (as he was a skilled glass blower) and calibrated everything minituous down to a fraction of a ppmv, an enormous effort for that time.
His own equipment was used up to begin 2000’s to calibrate the calibration gases all over the world…
When begin 1950’s the new NDIR technique emerged, he tested that technique to find out of that was sufficiently accurate to be used as a continuous measurement device, before using it at the South Pole and Mauna Loa.
The old wet methods never were used at Mauna Loa, as far too inaccurate (+/- 10 ppmv)…
3) We are talking about the cause of the CO2 rise, which is largely from human emissions and a very small contribution from warming oceans. If that has much effect on temperatures is a different question and not at stake here.
My problem with this kind of discussions is that anyone promoting that humans are not responsible for the increase are only fooling themselves and discrediting all skeptics where they are right: that there is no climate emergency…
Ferdinand, now you say
The only problem: the increase is far beyond Henry’s law…
Clearly you are not a chemist. What plays in the atmosphere and the surface of the oceans + deep ocean is not only Henry’s Law. There are a number of chemical reactions where the outcome is dependent on Kc of each reaction in a slightly alkaline solution. Nothing much to do with poor old Henry..
The moon is stirring the pot all day long to keep each of these reactions going and as long as there is a surplus of Ca+ all that happens with the extra (human) CO2 not being used immediately by the bio-sphere is that more CaCO3 is formed. These reactions are also strongly dependent on temperature; hence it is just or mainly just SST that determines how much CO2 is in the atmosphere. That is my opinion.
Henry,
I am a chemist… What you write is simply not true.
If more CO2 enters the ocean surface than is released, then in the first step Henry’s law is what determines how much free CO2 gets in solution.
The next step is that any extra CO2 that is pressed into the water reacts with water to form carbonic acid, next step bicarbonates and last step carbonates.
In the last two steps hydrogen ions are formed. With more hydrogen ions, solid carbonate rock may be dissolved, the opposite of what you think, when the pH is low enough…
The first step is controlled by Henry’s law, no matter the pH of the solution and no matter for fresh water or seawater.
The difference between these two?
In fresh water, dissolved CO2 + carbonic acid is 99%, bicarbonates 1% carbonates 0%, pH ~4 (acid). Total DIC = CO2 in solution.
In seawater: CO2 1%, bicarbonates 90%, carbonates 9%. pH ~8 total DIC ~10x higher than in fresh water. That is called the Revelle/buffer factor.
No solid carbonates are chemically formed at pH 8, but specific species (coccoliths) do form them with biochemical reactions.
More CO2 from the atmosphere into the oceans will lower the pH and increase DIC, Outgassing due to higher seawater temperatures will decrease DIC and increase the pH.
All measurements in all oceans over time show a decreasing pH with increasing DIC.The end result is a 10% increase of DIC for a 100% increase of CO2 in the atmosphere. That is what is measured, not your or mine opinion…
Have a look at what really happens in the oceans:
https://en.wikipedia.org/wiki/Bjerrum_plot
Poor Henry has almost nothing to do with it. If you say are a chemist, then which reactions are playing and where do they play out?
Your Bj plot does not even bring in temperature as a variable. ..
let us have look/….
1) CO2 enters the ocean as a dissolved gas
CO2 (g) + cold = CO2 (dissolved)
2) CO2 reacts: CO2 + 2H2O = HCO3- +H3O+
3) HCO3- reacts: HCO3- + H2O = CO3(-2) + H3O+
4) CO3- reacts: Ca(+2) + CO3 (-2) = CaCO3 (s)
71% of the world’s surface is water which acts as a huge sponge soaking up and then storing CO2.

A straight line relationship between SST and CO2 is shown to exist by emeritus prof. Lance Endersbee
It does not matter how much CO2 is pumped up in the air, it will always find its own equilibrium concentration, but always dependent on the sea surface temperature (SST).
In the meantime is has become evident that earth is greening – which is good as it also gives us record crops. It is not possible to quantify how much CO2 is being used for this as even the oceans are also greening. But it could be a very, very big part of our emissions…Whatever coming from us that is not being used by earth’s bio-sphere will eventually disappear in in the deep ocean for as long as there is still free Ca(2+).
I am busy with my own investigation to see if the resulting acidification (see reactions) is going to be a serious problem. I only have 6 years samples from the Indian ocean so far, which is too short to make a prediction.
Henry, the law of the old Henry is the main point in the first step: no matter if that is fresh water or seawater. The other reactions simply follow what is dissolved as pure, gaseous CO2 in the water.
The net result is a 10% increase of all inorganic carbon species (DIC: CO2 + bicarbonates + carbonates) in solution for a 100% change in the atmosphere.
With an increase of 5 PgC/year in the atmosphere, that means an increase of 0.255 PgC/year of DIC in the ocean surface, not reverse.
Your reaction 4) doesn’t exist in seawater at a pH around 8.
No solid CaCO3 is formed at that pH by chemical reactions. Neither gets solid CaCO3 dissolved (as some do warn).
Only species that form carbonate skeletons (coccoliths, molluscs) spend a lot of energy to build their carbonate shells out of 2 molecules bicarbonates, setting CO2 free (!) while doing so…
And stop with plotting that impossibilty from the late Endersbee: 40 ppmv increase from only 0.275°C temperature increase means 145 ppmv/°C. Pure nonsense…
The ‘other reactions’ are sure to follow the dissolving of CO2 due to cold, because you are shifting equilibria.
To keep Calcium precipitated (because almost all algae need it), I keep the free alkalinity in my pool at about 120, which incidentally is almost the same as what is in sea water (Indian Ocean)….
The precipitation reaction to CaCO3 is not disturbed or restricted by pH as far as I remember my analytical chemistry, but if you have a reference?
I must say, I don’t even want to think of it, namely a drop in SST of about 0.5C – because it would be a disaster for mankind – but until it happens and we see what will happen you cannot simply say that Endersbee must be wrong. I think you are all underestimating what nature is doing for the good of us all….
You are relying on the ice analysis going back in time but as far CO2 is concerned, I don’t believe it is correct. There are a few people on this thread who agree with me on that. Read their comments. I only believe in real science.
https://dailysceptic.org/2024/08/27/party-over-for-alarmists-as-sea-temperatures-plunge-around-the-world/
Henry, please stop this nonsense. The effect of temperature on the equilibrium CO2 level with the atmosphere in seawater is not more than 16 ppmv/°C. That is all. Measured on near a million seawater samples all over the world and compiled in the formula of Takahashi.
Not 145 ppmv/°C if Endersbee was right.
I did find back an older graph that shows that Endersbee was cherry picking the part of the graph where the temperature goes up, but as you know, in the period 1946-1975, temperatures fell, to give scare to the “new ice age” scare of begin ’70s.
The 21-year moving average of 1975 already includes 10 years warming (1976-1985) and should be taken from the years before 1975, thus continuous cooling, while CO2 is increasingly going up, including in the period 1958-1975 when Mauna Loa and South Pole measurements started, completely refuting the nonsensical graph of Endersbee…
I keep the free alkalinity in my pool at about 120
Sorry. That should be
I keep the total alkalinity in my pool at about 120
Again, you don’t understand the reactions: at pH around 8.0 for seawater, no solid carbonates are formed or dissolved. None.
Carbonates are 9% in solution as dissolved CO3–. In solution, not precipitating.
Only with a lot of energy, coccoliths and mollusks can form one solid carbonate molecule (Ca/MgCO3) in their shells out of two dissolved bicarbonate ions (HCO3-) that stay solid at that pH and doesn’t dissolve, plus one free CO2 molecule.
Ferdinand
The reaction of free Calcium is simple. It is not dependent on pH as far as I know. I think it will prefer carbonate to hydroxide, if i am not mistaken. I asked you to prove to me that I am wrong?
Henry, there is no “free” Ca or Mg in seawater, only Ca++ and Mg++ ions in solution. At very high pH (much higher than in seawater) or at very high Ca++ levels, solid CaCO3 can be formed chemically and precipitates.
That doesn’t happen in current seawater.
All the carbonate layers you see over the world were made by calcifering organisms, mainly during the Cretaceous (why the name!), that spent a lot of energy to combine two HCO3- ions with one Ca++ ion (or Mg++ ion) to make CaCO3 + CO2 + H2O or MgCO3 + CO2 + H20 or a mix of both in their shells.
See: https://www.chemedx.org/blog/seashell-chemistry
‘only Ca++ and Mg++ ions in solution’
is what I mean with free Calcium.
All reactions that I told you about are in equilibrium:
Ca(2+) + CO3(-2) < = > CaCO3 (s)
If you add more carbonate (from more CO2) at whatever pH the solution is at, that equilibrium shifts more to the right to try and correct the imbalance. As a result, more CaCO3 will be formed.
Are we agreed now, on this.
I will never understand why it is so hard for some people to understand that adding CO2 to the atmosphere increases the amount of CO2 in the atmosphere.
1 ppmv CO2 = 7.8024 Gt CO2 = 2.1294 PgC. So adding 7.8024 Gt of CO2 to the atmosphere immediately increases the average atmospheric CO2 concentration by exactly 1 ppmv.
The question them becomes, for how long? That’s a trickier question that it seems at first glance—though not nearly as tricky as Koutsoyiannis tries to make it seem.
The “residence time” of a CO2 molecule is not what matters w/r/t the amount of CO2 in the atmosphere. What matters is the “adjustment time,” which you can think of as the “effective residence time.” It’s the duration of the effect from adding CO2 to the atmosphere, and it is much longer than the residence time.
When a CO2 molecule is absorbed by a puddle or raindrop, That’s the end of its “residence time.” When that puddle or raindrop evaporates, releasing the dissolved CO2 molecule back into the air, that’s the start of a new “residence time.”
Similarly, if a carbon atom is exchanged between the air and the terrestrial biosphere or ocean, either immediately or perhaps after a growing season, that exchange “resets the timer” if you’re counting “residence times” of carbon atoms, but it does so without affecting the amount of CO2 in the air.
That’s why the “residence time” of CO2 added to the air is much shorter than the “adjustment time” (or “effective residence time”), which is what matters.
If you add 10×7.8024 Gt of CO2 to the air, the atmosphere’s average CO2 level will immediately increase by 10 ppmv (though some months might elapse before you notice it at Mauna Loa or Cape Grimm). Measurements show that each 10 ppmv increase in CO2 level accelerates natural removals of CO2 (into the ocean and terrestrial biosphere) by about 0.2 ppmv/year (or a bit more if you count “land use change effects” as anthropogenic CO2 emissions). That means the adjustment time for CO2 is about 10 ppmv / 0.2 ppmv/yr = 50 years (for the first half-life), not “between 3.5 and 4 years.”
(Aside: If CO2 levels were falling, “browning” would replace “greening,” so there’s also a “long tail” to the theoretical decay curve. So if CO2 levels were falling, second and subsequent CO2 half-lives would be longer than the first half-life. Integrating [and exaggerating] that theoretical “long tail” is how people like Archer come up with their wild overestimates of average CO2 adjustment time. But second and subsequent CO2 half-lives are largely irrelevant while CO2 emissions exceed natural CO2 removals and atmospheric CO2 concentrations are rising, as is currently the case. Moreover, if CO2 levels fall so far that second and subsequent half-lives become relevant, it will be painfully obvious to everyone left alive that slowing the CO2 decline is desirable, not harmful. So using that theoretical “long tail” as an excuse for multiplying the supposed harms from carbon emissions is deceitful.)
Based on GCB 2023 v1.1, over the 10 year period 2013-2022, inclusive, mankind added an average of 4.62 ppmv/year of fossil CO2 to the atmosphere (36.0 Gt/yr). That estimate is from economic data, and it’s pretty solid; I’d guesstimate probably within ±10%.
GCP also estimates that “land use changes” (clearing forests, draining swamps, etc.) added an average of 0.60 ppmv/year of non-fossil CO2 to the atmosphere, but that estimate is pretty rough.
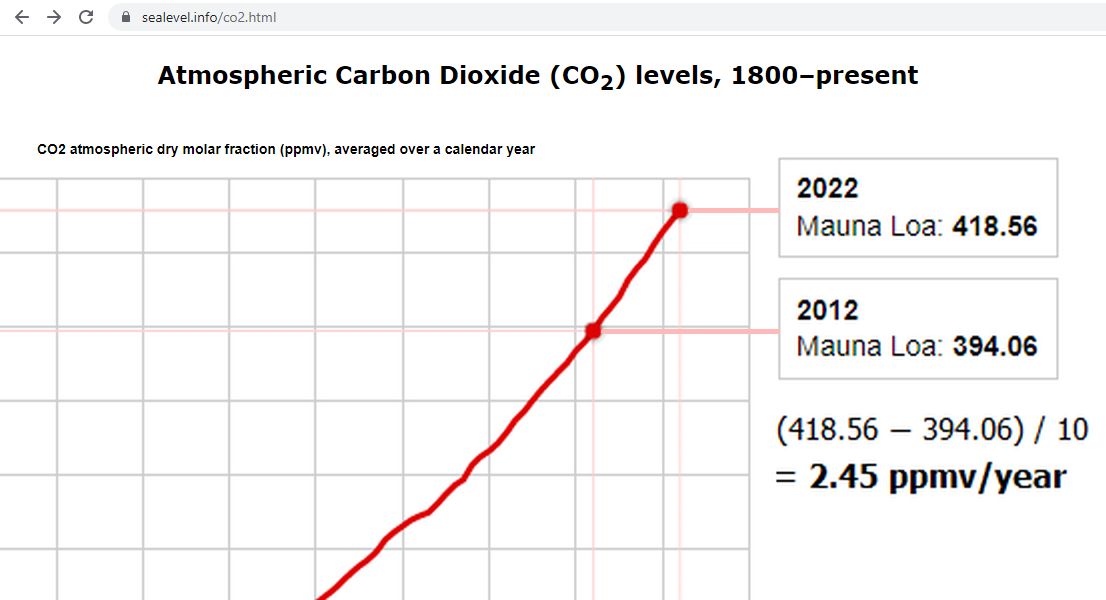
But the amount of CO2 in the atmosphere increased by an average of only 2.42 ppmv/year (18.9 Gt/year).
Or, if you compare average Mauna Loa CO2 level in 2012 to 2022, which is similar to using six month earlier data, you’ll find an almost identical average increase of 2.45 ppmv/year:
If you count “land use change” effects as part of natural CO2 fluxes (rather than as human emissions), that means Nature (the net sum of all natural sinks and sources) removed an average of (4.62-2.42) = 2.20 ppmv per year. If you count “land use change” effects as human emissions, and if you accept the GCP’s 0.6 ppmv/year estimate, then that means Nature removed an average of 2.80 ppmv per year.
That’s called a “mass balance” calculation, and it proves that Nature is removing CO2 from the atmosphere, not adding it.
Well explained.
Dave
there is not even a small dip in your graph during Covid-19.
It continued going up, apparently at exactly the same rate….
There is a small dip of some 10% in 2020: from 4.8 ppmv in 2019 to 4.4 ppmv human emissions in 2020. See the graph of the derivatives a few comments up.
The natural variability from year to year is +/- 1 ppmv, a one-year dip of 0.2 ppmv (half of the original -0.4 ppmv) is simply undetectable in the natural noise…
That’s because it was a very slight change, smaller than typical year-to-year fluctuations due to things like ENSO.
We’re currently emitting the equivalent of about 5 ppmv of CO2 per year. Economic downturns, like the Covid recession, reduce that slightly, as do CO2 emission reduction schemes, such as coal-to-gas power plant conversions.
But not much. The summed effects of the Covid-19 pandemic temporarily reduced 2020 CO2 emissions by less than 10%. The GCB estimates that fossil CO2 emissions fell from 10.109 PgC in 2019 to 9.555 PgC in 2020, which is a 0.26 ppmv (5.5%) decrease. Another frequently cited estimate was that CO2 emissions declined by 6.4% in 2020, which would be 0.32 ppmv.
That decrease is small compared to typical year-to-year variations in the annual CO2 increase. These figures are calculated from the GCB spreadsheet:
From 2012 to 2013 the CO2 level increased by 2.444 ppmv, which was about average.
From 2013 to 2014 the CO2 level increased by 2.034 ppmv (La Niña).
From 2014 to 2015 the CO2 level increased by 2.943 ppmv (El Niño).
From 2015 to 2016 the CO2 level increased by 2.833 ppmv (El Niño).
From 2016 to 2017 the CO2 level increased by 2.135 ppmv (La Niña)
As you can see, fluctuations of nearly 1 ppmv in the year-over-year CO2 concentration increase are common. So a mere 0.3 ppmv decrease gets lost in the noise.
So how much exactly is the natural emission from the oceans each year to which we all owe our lives?
It is 100 million tons of CO2…
My comment came in just before Dave’s comment.
100 million metric tonnes of CO2 is 0.0128 ppmv CO2, or just about exactly one day of human emissions of fossil CO2.
The oceans are net sinks (absorbers) of CO2. They emit CO2 in some places, at some times. But they absorb more CO2 than they emit.
Anyway …The accuracy of historically CO2 in ice cores discussed —-
Research on the smoothing of CO2/methane data from ice cores, the values measured from ice cores are an “..average value over a certain period of time, which removes the fast variability from the record ” + closing of air in ice layer can take tens to hundreds of years + also mentioned in other post; the leaking of CO2 before the lock-in phase..
“Consequently, the air enclosed in a given ice layer does not originate from a single point in time but rather is characterized by a continuous age distribution covering tens to hundreds of years”
“Consequently, the gases trapped in a given ice layer span a distribution of ages. This means that the gas concentration in an ice layer is the average value over a certain period of time, which removes the fast variability from the record.”
.
The estimations of CO2 rates of change are further altered by the process of discrete measurement, and measured values can be 3 times lower than the actual atmospheric rate of change.”
.
“However, the gas records in low-accumulation ice cores cannot be interpreted as perfect records of the atmospheric history. Indeed, due to the process of gas trapping in the ice, two distinct effects create discrepancies between the actual history of the atmosphere and its imprint in the ice. The first one is due to the heterogeneous structure of the firn when transforming into airtight ice with bubbles”
.
“The second effect that creates differences between the atmosphere and its imprint in the ice is due to the combination of diffusive air mixing in the firn (Schwander, 1989) and the progressive closure of pores in a firn stratum (Schwander et al., 1993; Mitchell et al., 2015).”
“Consequently, the air enclosed in a given ice layer does not originate from a single point in time but rather is characterized by a continuous age distribution covering tens to hundreds of years (Schwander et al., 1988, 1993; Rommelaere et al., 1997). Therefore, the concentration measured in an ice stratum is an average of atmospheric concentrations over a period of time. This effect removes the fast variability from the record and has therefore been referred to as the smoothing effect (Spahni et al., 2003; Joos and Spahni, 2008; Köhler et al., 2011; Ahn et al., 2014; Fourteau et al., 2017)”
.
Source:
https://cp.copernicus.org/articles/16/503/2020/
Fourteau, K., Martinerie, P., Faïn, X., Ekaykin, A. A., Chappellaz, J., and Lipenkov, V.: Estimation of gas record alteration in very low-accumulation ice cores, Clim. Past, 16, 503–522, https://doi.org/10.5194/cp-16-503-2020, 2020.
+ About mean values and more. Claims from David Dilley with references to research + Isotops telling about recent decades development of anthropogenic CO2 in atmosphere:
The ice-core examples spannes from 1000-4000 years. So a value of f.ex 280 ppm CO2 is mean value for those 1000-4000 year.
The CO2 leaks before airbubbles are closed. This can take up to 5000 years. The upper 688 feet isn’t totally closed ice.
Dilley points to research in the video and he says it leaks about 30 ppm CO2 during this phase. Dilley also says that in addition the mean value needs 17% adding because it is — a mean value for that “ice core-chunk” that represents 1000-4000 years.
.
Research/source + more in video:
+ Links and researches describing some the topic: https://wattsupwiththat.com/2021/01/15/the-co2-kink-firn-to-ice-transition/
A few points:
1) Ice core gas composition indeed is a mix of gas levels from less than a decade (Law Dome) to some 600 years (Vostok), depending of the local snow accumulating rate.
Over the past Holocene average 20 years, over the past 150 years less than 10 years.
Even in the 600 years resolution Vostok ice core, the current 130 ppmv rise of CO2 would be detectable as an unnormal peak of tens of ppmv beyond the usual CO2/T ratio of 8 ppmv/°C for Antarctic temperatures (16 ppmv/°C for global temperatures).
2) CO2 doesn’t “leak”, in the firn, it simply remains exchanged via diffusion between the atmosphere and the still open pores, until the firn is dense enough and the pores are closed to form bubbles.
The only point is that in stagnant air, the heavier isotopes and molecules tend to get enriched near the bottom, but that is compensated for by measuring the 15N/14N ratio (less than 1% correction for CO2 levels).
3) There is an overlap of about 20 years (1958-1978) between CO2 in ice and in the atmosphere at the South Pole for the Law Dome ice cores within the standard deviation for the ice core measurements (1.2 ppmv):
http://www.ferdinand-engelbeen.be/klimaat/klim_img/law_dome_sp_co2.jpg
Confirming that there is no gap between ice core CO2 and atmospheric CO2.
4) The huge drop of the 13C/12C ratio in the atmosphere since 1850 (-2 per mil!) was never seen before in 800,000 years of ice, even not during a glacial – interglacial transition (+0.4 per mil) or over the Holocene (+/- 0.2 per mil variability):


Independently confirmed by coralline sponges in the sea surface over the past 600 years:
More about ice cores reliability at:
https://co2coalition.org/wp-content/uploads/2024/06/Measurement-of-CO2-Concentrations-Through-Time-2024-June.pdf
Fresh from the press…
Rain is slightly acidic. That is due, in part, to CO2 combining with H20 to form carbonic acid.
CO2 dissolving in the ocean also forms carbonic acid (amongst other chemicals, e.g., calcium carbonate). Carbonic acid does not emit as CO2 when the ocean warms. This is apparently not included in the calculations.
The more we know, the more we know we don’t know.
CO2 in solution and non-dissociated carbonic acid together are less than 1% in seawater. 90% is bicarbonates and 9% are carbonates. carbonic acid is so low that one adds it together with CO2 in solution.
The emissions of CO2 out of the warm(er) parts of the oceans includes all the reactions from carbonates back to bicarbonates and carbonic acid / dissolved CO2 and are very accurately known with all the reaction constants. The main factor in the in/out CO2 flux is the partial pressure difference (ΔpCO2) between the atmosphere and the ocean surface. That changes with about 16 ppmv/°C for the sea surface.