By Kenneth Richard on 30. August 2024
“Clearly, the atmospheric CO2 observation data are not consistent with the climate narrative. Rather, they contradict it.” – Koutsoyiannis, 2024
Per a new study, the Intergovernmental Panel on Climate Change (IPCC) utilizes “inappropriate assumption and speculation,” as well as non-real-world models of “imaginary data,” to claim CO2 emissions derived from fossil fuel burning function “weirdly,” far differently in the atmosphere than CO2 molecules derived from natural emissions (e.g., plant respiration, ocean outgassing) do.
“The ambiguity is accompanied by inappropriate assumptions and speculations, the weirdest of which is that the behavior of the CO2 in the atmosphere depends on its origin and that CO2 emitted by anthropogenic fossil fuel combustion has higher residence time than when naturally emitted.”
While the IPCC acknowledges emissions from natural sources have an atmospheric residence time of only 4 years, they have simultaneously constructed model outputs that assert CO2 molecules derived from fossil fuel emissions remain in the atmosphere for hundreds, thousands, tens of thousands, even several one hundred thousands of years.
Per the IPCC:
“15 to 40% of an emitted CO2 pulse [from anthropogenic emissions] will remain in the atmosphere longer than 1000 years, 10 to 25% will remain about ten thousand years, and the rest will be removed over several hundred thousand years.”
“Carbon dioxide (CO2) is an extreme example, its turnover time is only about 4 years because of the rapid exchange between the atmosphere and the ocean.”
Again, a four-year residence time for natural CO2, but hundreds of thousands of years residence time for CO2 molecules elicited from fossil fuel burning. It would seem just about any result can be derived from imaginary data.

Image Source: Koutsoyiannis, 2024
Instead of relying on models built on assumption and speculation, Dr. Koutsoyiannis utilizes a well-established, hydrology-based theoretical framework (refined reservoir routing, or RRR) combined with real-world CO2 observations to robustly conclude the residence time for all CO2 molecules, regardless of origin, is between 3.5 and 4 years.
The applied theoretical results match the empirical results so closely (e.g., an empirical mean of 3.91 years vs. a theoretical mean of 3.94 years at Barrow, and an identical 3.68 years for both empirical and theoretical means at Mauna Loa from 1958-2023) that the theoretical framework can be said to be “close to perfect.” In other words, the consistency of the applied calculation with real-world observations provides robust evidence that CO2 residence time is likely close to this range.
In contrast, the calculated probability for the modeled, imaginary-data-based claim that the residence time for a CO2 molecule persists for over 1000 years is 10⁻⁶⁸, which means the probability value is “no different from an impossibility.”

Image Source: Koutsoyiannis, 2024
A residence time of only 4 years for all CO2 molecules, regardless of origin, is consistent with the conclusion that nature is dominant in driving changes in CO2 concentration. Fossil fuel emissions serve only a minor role.
Since 1750, additions to the atmospheric CO2 concentration derived from natural emission sources associated with biological processes are about 4.5 times larger than the contribution from fossil fuel emissions (e.g., 22.9 ppm per year from nature, 5.2 ppm per year from fossil fuel combustion).
In other words, observed CO2 data contradict the climate narrative that says anthropogenic fossil fuel burning is driving CO2 concentration changes.

“Weirdly” is NOT a scientific term.
This article should have been entered as a “Friday Funny”
Kamala is laughing.
What I was referring to is the assertion that natural CO2 lasts 4 years, but anthropogenic CO2 lasts 10,000 years.
You should have been clear that you were referring to the IPCC assertions, not the analysis presented.
Of course not, circulation time is four years.
e-folding decay time is 34 years, as Peter Dietze more that 20 years ago already showed.
see also Roy Spencer, Ferdinand Engelbeen and Kees Le Pair.
Yup. More on how off base, below. Confusion circulation with efold times is a basic mistake many, including Salby, have made
Yes, except that’s the half-life. The e-folding time 𝝉 (= atmospheric lifetime) is the half-life divided by ln(2), which is about 50 years.
E-folding time requires knowing the equilibrium level. What is that for atmospheric CO2?
For the current average ocean surface temperature, that should be about 295 μatm (~ppmv), 13 ppmv up from the LIA with 0.8°C up (choosing the largest increase in the many reconstructions) and 16 ppmv/°C.
You can also back-calculate that from two points (like 2020 and 1960) with the difference in CO2 level and the responding difference in net removal, as the e-fold “adjustment” rate is for a linear process is a simple formula, the same for any time frame:
Tau = disturbance / effect.
By back-calculation, zero net removal again is around 295 ppmv…
And so your logic comes full circle. All the CO2 since then is FFCO2, as you assumed. Congratulations. Blessed are those who go around in circles, for they shall become wheels.
It is not “assumed,” Ron, it is derived from measurements, and the analysis in this paper by Roy Spencer:
https://www.opastpublishers.com/open-access-articles/enso-impact-on-the-declining-co2-sink-rate.pdf
He blogged about it here:
https://www.drroyspencer.com/2024/04/net-zero-co2-emissions-a-damaging-and-totally-unnecessary-goal/
Ⅰ. Since 1958 we have excellent, precise measurements of atmospheric CO2 levels, from which the year-over-year incremental changes in the amount of CO2 in the atmosphere can be obtained by comparing each year’s CO2 level with the previous year’s level. Averaged over the years 2013-2022 it’s just over +2.4 ppmv/year.
Ⅱ. We also have good economic data for production and use of coal, oil, and natural gas, and also for cement manufacturing, from which we can calculate fossil CO2 emissions. (We also have rough estimates for CO2 emissions from “land use changes,” such as clearing forests and draining swamps, but I don’t really trust those estimates.) Averaged over the years 2013-2022 it’s 4.6 ppmv/year of fossil CO2 emissions, plus (very roughly) 0.6 ppmv/year of “land-use change emissions.”
Ⅲ. By subtracting (Ⅰ) from (Ⅱ) we can calculate the removal rate, which is the net amount of CO2 removed from the atmosphere each year by natural sinks (mostly the oceans and the terrestrial biosphere).
If we consider “land-use change emissions” to be a diminishment of natural CO2 removals, then we needn’t include them in our calculation. Then for the 2013-2022 ten year averages, the difference (i.e., the removal rate) is about 4.6 – 2.4 = 2.2 ppmv/year. The advantage of this approach is that the imprecision of “land-use change emission” estimates does not reduce the precision of our result.
(Alternately, we could consider land-use change emissions to be part of anthropogenic emissions. In that case, the difference is about 5.2 – 2.4 = 2.8 ppmv/year. That approach is more conventional, but less precise, because of the great uncertainty w/r/t land-use change emissions. IMO, that uncertainty makes it less suitable for this sort of analysis.)
Ⅳ. If you repeat those calculations for the entire period for which we have good data, 1958 to present, you can then plot the removal rate vs. the atmospheric CO2 level, and you’ll see that the relation is approximately linear, with an x-intercept somewhere below 300 ppmv.
When I did this exercise, ignoring ENSO effects, I found an x-intercept of 285 ppmv. Here’s the spreadsheet:
https://sealevel.info/Global_Carbon_Budget_2023v1.1_with_removal_rate.xlsx
Note: the Y axis is in GtC (PgC). To convert to ppmv of CO2 divide by 2.1294.
When Roy did a more refined analysis, taking into account ENSO, he found an x-intercept of 294 ppmv (see his paper). His earlier analysis, which he blogged about before writing his paper, found 295 ppmv.
Roy Spencer also said
“Although it’s popular, I don’t think using exponential decay is a useful way to think about the atmospheric CO2 budget, and I have never used it. It just happens to be a good mathematical approximation to what is going on physically and biologically. The “sink rate” is a better, and more physically-based, concept because it reflects how nature responds to “extra” CO2 in the atmosphere. Nature (e.g. forests) respond to how much CO2 is in the atmosphere, not to assumed decay profile. It is also a more appropriate way to model the behavior of the system on a year-to-year basis.”
-Roy
You also left out Spencer’s main points:
“Yes. Nature doesn’t know how much CO2 humans emit from year to year! It only knows how much is in the atmosphere. That’s what all of this is based upon!”
“(By the way, the previously popular CO2 “airborne fraction” has huge problems as a meaningful statistic, and I wish it had never been invented. If you doubt this, just assume CO2 emissions are cut in half and see what the computed airborne fraction does. It’s meaningless.)”
Roy is right, and I’ve said the same thing many times, most recently right here, but also here and here.
The satellites show CO2 plumes downwind of the sun warmed oceans beneath the subtropical high pressure cells in both hemispheres.
There are no such plumes downwind of population centres.
Our emissions get absorbed by nearby vegetation.
The source of the observed increase is the oceans.
It is entirely natural and beyond our control.
Modern climate science is a disaster.
Do you have a reference for that observation?
If he did, joel,you won’t discover that it passed the politically controlled litmus test of Peer Review. I would take one exception with Stephen. Modern Climate Science isn’t a disaster because it is not science. In reality it is the product of bureaucratic minds and computer programs i.e. politically driven manufactured consensus, for the monied elite, to control the great unwashed. If the universities don’t comply Billions in federal grant money dry up and go poof! The K Street lobbyists on behalf of the monied elite tell congress where to direct your tax money, and massive expenditures go towards creating and sustaining the multi-headed monster they call “Man Made Global Warm…ahh we really meant climate change all along” As we speak, Congress is working on spending the taxes that will be earned by future generations circa 2075. That is, if the United States hasn’t financially collapsed by then. Brush up on you mandarin and invest in yuan.
Here’s a link.
I once calculated that a tiny temperature change in the deep ocean would completely explain the modern rise in atmospheric CO2 … no human or biological sources required.
CommieBob
Great stuff. Wonderful. Is what I was saying. You are good.
Bob, suppose that the deep ocean were warming enough to add 2.5 ppmv of CO2 to the atmosphere each year. (Let’s ignore the difficulty with getting that extra CO2 out of the deep ocean and into the air.)
Then where does the anthropogenic CO2 go? We’re adding either a little more or a little less than 5 ppmv of CO2 to the atmosphere each year (depending on whether or not you count “land use change emissions”). So, where does it go?
If you think the ocean could really be emitting CO2, rather than absorbing it, then where does the CO2 that we emit go?
There is an equilibrium between atmospheric gasses and those dissolved in the ocean. It’s described by Henry’s Law. Since the ocean contains much more CO2 than the atmosphere, the atmospheric CO2 is determined by the solubility of CO2 in the ocean over the long term. As far as I can tell, this isn’t even controversial.
commieBob,
That equilibrium changes with about 4%/°C or 16 ppmv/°C or 13 ppmv since the Little Ice Age at maximum. We see an increase of some 130 ppmv since the LIA, of which over 100 ppmv since 1958 (in case if you don’t trust the ice core measurements).
Can’t be from the oceans, but over 200 ppmv human emissions since 1958 will do the job.
Moreover, measurements in the ocean surface shows an increase of DIC (sum of dissolved CO2 + (bi)carbonates) and a decrease in pH. If the oceans were the cause, the opposite would be visible.
How much is in the oceans is of no interest in this case, only the concentrations at the surface play a direct role. On long term, our emissions indeed will get all absorbed into the deep oceans, but that needs time (the above 50 years e-fold time, not the hundreds of years of the IPCC’s Bern model)…
Bob wrote, “the atmospheric CO2 is determined by the solubility of CO2 in the ocean over the long term”
“In the long term” means long enough for air and ocean to come into equilibrium, after a big influx of CO2 into the air. We’re far from equilibrium, now.
As Ferdinand mentioned, the e-folding (average lifetime) of CO2 added to the atmosphere is about 50 years. So the first half-life is about 35 years.
So if this afternoon we suddenly ceased adding CO2 to the atmosphere, then 35 years from now half of the current ≈120 ppmv elevation above equilibrium would have left the atmosphere, leaving the concentration at roughly 360 ppmv.
(That would be a catastrophe for agriculture, BTW.)
Stephen is entirely correct. My comment on this post came in on the 2nd page of the comments Just take a look at Lance Ennerbee’s calculations. The source of the observed increase in CO2 is 99.6% from the oceans.
No Henry you are confusing absolute source and mixing source.
Fossil fuel burning adds CO2 to the atmosphere, in four years that is completely replaced by biogenic co2, it did not get out of the circulation, the removal out of the system occurs with a half life of 34 years.
compare it with a leaky swimming pool and a pool pump. Circulation is fast, leaking is slow.
No Hans. I have my own convictions based mostly on a number of cross correlated observations. If there are at least three legs you can sit on the chair…
Anyways. Come back to CG and we can discuss it all in details.
Im sorry Henry, this is simple straightforward bookkeeping, there is more CO2 going into the ocean than coming out of it.
Henry, completely wrong: more CO2 is entering the ocean surface than is released from the same surface.
Measured at some 6 stations monitoring inorganic carbon species (DIC: CO2 + bicarbonates + carbonates) and pH in seawater over decades:
https://tos.org/oceanography/assets/docs/27-1_bates.pdf
See Figures 3 and 7 and Table 2.
DIC increases while the pH is dropping. If the net flow was from oceans to atmosphere, then the pH would go up and DIC would drop.
Or if undersea volcanoes suddenly released lots of SO2, lowering the pH, then DIC would drop…
Ferdinand,
As I mentioned later on in the thread, I am asking what the point is of this whole discussion if you and I believe that the increase in CO2 does not cause any warming?
Henry,
My point (and of others) is that bad science like this undermines the credibility of all who fight the “C”AGW meme…
Any bookkeeper worth his money can show you that humans are responsible for the CO2 increase in the atmosphere and not at all nature, thus insisting on this point is ruining your credibility on whatever point where you may be right…
Exactly right! The climate industry has no more effective allies than “skeptics” who argue points that are obviously wrong, like:
● the “slayers” who claim the 2nd Law of Thermodynamics means GHGs cannot cause warming; and
● Nikolov & Zeller, who insist that gravity, rather than GHGs and infrared radiation, causes warming; and
● the folks who claim that adding CO2 to the atmosphere does not increase the amount of CO2 in the atmosphere.
To quote “Dr. Switzer” . . .
Just STOP IT!
Claiming residence time in thousands of years is pure POOMA, derived from models only.
Nothing new about this standard “sceptic” nonsense. But the simple empirical test is the accumulation of mass of carbon in the air:
The increase of carbon in the air very closely follows the rate at which we put it there, which a steady airborne fraction of about 50% (the rest went into the sea). And that means half the CO2 we put into the air over the last century or so is still there. It didn’t have a 4 year lifetime.
Nothing new about your total lack of understanding and your denial of science.
CO2 flux is only some 4% of total, and as shown, human released CO2 is totally SWAMPED by changes in the natural system.
So what happened in all those centuries before 1850 when ppm CO2 in the air was constant, and CO2 flux was supposedly 96% of present?
Only a completely naïve anti-science fool thinks that warming doesn’t enhance the NATURAL carbon cycle.
Follow the science, as shown in the last section above…
… not the brain-washed idiotology !!
Nick turn off your computer and flush your car keys away, your C02 is killing the planet you silly hypocrite!
My understanding was that CO2 was close to 200 ppm during the previous glacial maximum. The plots also show a slight increase during the MWP and a slight decrease during the LIA. The curves also show that 350 out of the 550 Gton C from fossil fuels have been removed from the atmosphere. This implies the residence time for CO2 from fossil fuels is much less than the 300 to 1000 years claimed by the IPCC (though certainly more than 4 years).
Nick,
There is no doubt that CO2 was not contant before the industrial age. Read the papers of Beck that give numerous old analyses of CO2 in air above 300 ppm.
Geoff S
Geoff,
The numerous old analyses were in the middle of towns, forests, and a lot of other places where you can find any amount of CO2 you like. Everything except the real “background” CO2 levels as measured in 95% of the atmosphere: all over the seas, coastal with wind from the sea, at the top of mountains (or airplanes) and in (ice) desserts.
See: http://www.ferdinand-engelbeen.be/klimaat/beck_data.html
And in-depth, peer reviewed:
https://scienceofclimatechange.org/ferdinand-engelbeen-about-historical-co2-levels-discussion-of-direct-measurements/
“All” has no numerical value, but for about four centuries prior to 1850 there was the Little Ice Age which reduced plant growth and oceanic outgassing which would result in little variation in concentration.
Going back further, C02 concentration has waxed and waned between from hundreds to thousand ppm and back again – without Mankind’s help.
The Earth’s climate system didn’t start in 1850 as some think, it is 4.5 billion years old, and records don’t go back just 150 years.
The ratio CO2/T over the past 420,000 years is not more than 8 ppmv/°C in the Vostok ice core:
That is for Antarctic temperatures. Or about 16 ppmv/°C for global temperatures.
That gives some 13 ppmv since the Little Ice Age today. That is all.
The measured increase is some 130 ppmv…
“CO2 flux is only some 4% of total”,
BeNasty
Dingbat Alert
Carbon cycle CO2 emissions are slightly smaller than carbon cycle CO2 absorption. BeNasty always ignores natural CO2 absorption … and he ignores La Ninas when blaming all climate change on El Ninos. That’s how he earned the title of WUWT Court Jester.
“Dingbat alert?”
Yep, here you are !!
Great that I have rent-free, vacant possession of your tiny little mind.
Refer to bottom chart above.. Human CO2 from FF is about 4.4% of total… get over it.
Oh and you have yet to show us any warming except from El Nino spike/step events in the UAH data.
Still waiting. You are still failing.
I cannot be alone in heartily wishing you guys would take this someplace else. It adds nothing to the discussion. It may relieve your feelings, but surely you can find some other therapeutic forum where you don’t endlessly get in the way of people who have no interest in your rants.
Do you have any data for the past 12 years?
it looks as if carbon accumulation in the air began about 175 years ago, ie end of the Little Ice Age, well after forests were destroyed and mass coal burning began.
it’s mostly the naturally warming oceans.
The graph is from a post of 10 years ago. It shows cumulative emissions tracking total C in the atmosphere over that time, consistently.
But you didn’t answer the question. “Do you have any data for the past 12 years?” Try again.
I think the key period is from 2001 to 2014, the so-called pause. During this period, where global temperatures did not change, the rate of “anthropogenic emissions” increased by a rate of 10 times greater than the increase in atmospheric growth, but you all knew that all ready of course. Data is all available on the Global Carbon Budget website if you are interested.
“Try again.”
The graph covers a millenium, during which CO2 was near constant for 850 years, then started to rise in concert with our additions of CO2, with a loss factor of about 1/2. The last 12 years are not going to change that. So I am not going to redraw the graph.
Except it wasn’t.
Nice exaggeration of the Y axis
Shows why Mickey’s little hockey stick is level through the MWP etc
CO2 deficit as the control to tree ring growth.
Thanks Nick.
Mind you, 420ppm is still only marginally above “deficit” level, according to plant requirements.
We didn’t put the CO2 into the air just once, we put some into the air every year, usually a bit more each year than the year before. Residence time has a somewhat complex definition in the Koutsoyiannis paper, but assuming it’s something like content/flow, a residence time of about 4 years seems plausible. Even if it’s a few years more the suggestion of thousands of years is absurd.
Who says thousands of years for total CO2? The IPCC was talking about the tail of a pulse.
The rough arithmetic is that if you continuously emit 10 Mtons/year C, and it has a residence time of 4 years, then the max increase of C in the air that you could achieve would be 40 Mtons. That’s how residence time is usually estimated. But the observed increase is well over 200 Mtons C.
A NATURAL pulse from warming… which outweighs human emissions by more 4 times..
Same as we get a natural pulse of CO2 increase at El Nino events.
Did you know that the rate of CO2 increase very closely follows ocean atmospheric temperatures..
Mid 2024 More Proof Temp Changes Drive CO2 Changes | Science Matters (rclutz.com)
Not a steady rate of increase like it would be if it were 100% human.
“ C in the air that you could achieve would be 40 Mtons…..
But the observed increase is well over 200 Mtons C.”
So you are saying pretty much the same thing as the paper does at the end…
Total increase is 5 time man’s emissions.
Pretty close to what the paper says..
Pretty close to Ed Berry’s % of increase too.
The alternative working hypothesis is that the 10 Mt/yr is a serious underestimate. Also, your estimate of the “max increase of C in the air that you could achieve” is dependent on the shape of the decay function, for which you provide no estimate.
That’s nice, but the rest of us are talking about CO2 – the odorless, colorless gas.
The IPCC define the residence time, aka turnover time, thus.
AR2 WG1 p.76 “Turnover time (T) is the ratio of the mass of a reservoir – e.g., a gaseous compound in the atmosphere – and the
total rate of removal (S) from the reservoir: T = M/S”
They use the residence time to calculate total emissions, since the total rate of removal is about the same as total emissions, so we can tell what residence time they are using by dividing the atmospheric content by what they say the total emissions are. The IPCC use the word lifetime for both the adjustment time and the turnover time. After the second report, the mostly used “lifetime” for both. I think this has created a lot of confusion.
The following shows the residence times used in IPCC Assessment Reports calculated by dividing the content by total emissions. I hope it still looks like a table after I post it.
Report Atmospheric Content Total Emissions Residence time
FAR p.8 750GtC 197GtC 3.8yr
TAR p.88 737GtC 208GtC 3.4yr
AR4 p.515 762GtC 218.2GtC 3.5yr
AR6 p.700 870GtC 225.4GtC 3.9yr
Oops. A typo. The residence time for the TAR should be 3.5 years.
I prefer the term “turnover time” to residence time. I think it more accurately describes what it refers to.
BTW, I don’t think many understand, the turnover time is the inverse of the removal rate. So a turnover time of 3.9 years is a removal rate of 0.256/yr or 25.6% per year.
So take 3.5 years as the turnover time. Today’s level of nearly 420 ppm means that 120 ppm of inflow is required annually, or 120 +2 ppm if it is to increase as it has been. Where does 122 ppm of CO2 come from? Well, let’s say we can count on 6 ppm of FF CO2 (5%) and the other 116 being non-human emissions.
Clueless Klutz strikes again
Nature has been a net CO2 absorber for billions of years.
That CO2 is currently sequestered in rocks, shells, oil, gas and coal.
Mainly during the past 60 years, humans burning oil, gas and coal have recycled a lot of sequestered underground CO2 back into the atmosphere.
The extra CO2 is great news for 80% of plants — the C3 plants that prefer 750 ppm to 1500 ppm of CO2
The extra CO2 from manmade CO2 emissions also impedes Earth’s ability to cool itself, which mainly causes warmer winters.
The people who falsely claim that 3%, or 4% or 5% of atmospheric CO2 had manmade origins are fools. You are one of them. Therefore, you are a fool.
All of the last +140 ppm rise of atmospheric CO2 was from manmade emissions. That would be about 33%, not 3%, or 4% or 5%.
Turnover is eating and breathing of critters.
My guinea pigs have a huge annual CO2 turnover, yet on an annual basis my guinea pigs are a net co2 sink as they gain weight.
Hi Ron.
Your numbers are correct and agree with the IPCC numbers. I prefer to use gigatonnes of carbon (GtC) which is also petagrammes of carbon (PgC) because it is what the IPCC use and also I think it is less confusing to use the same units for both emissions and atmospheric content. Multiply ppm by 2.13 GtC/ppm to get GtC.
I think the main problem people have in understanding this is the failure to take into account the equilibrium relationship that exists between CO2 in the atmosphere and in the oceans. The IPCC recognise the equilibrium relationship exits but then assume it is always in balance, natural emissions equaling natural sinks. Observations of the real world tell us that is not true.
All things being equal, there has to be a balance between the concentration of CO2 in the oceans and the partial pressure in the atmosphere. However, things are not equal. We have observational evidence that the world has been warming and that CO2 in the atmosphere has been increasing.
As the world warms, the oceans warm, and so the solubility of CO2 in the oceans decreases. This will necessarily result in an increase in the atmospheric CO2 as the partial pressure must increase to balance the lowered solubility in the oceans. At this point, people make a mistake and claim that CO2 must move into the atmosphere from the oceans. But the atmosphere does not care from whence the CO2 comes. If humans had not being putting CO2 into the atmosphere, CO2 would have come from the oceans. However, humans are putting more CO2 into the atmosphere than is needed for the equilibration process and so the net movement is from atmosphere into the oceans.
If you could wave a magic wand and stop all human CO2 emissions, the CO2 in the atmosphere would continue to rise until a new equilibrium is reached.
We can tell this is happening by looking at the relationship between changes in temperature and changes in CO2 growth. When there is an increase in temperature, there is an increase in CO2 growth. That is, an increase in the rate of increase. When there is a decrease in temperature, there is a decrease in CO2 growth. Some people think the system rapidly equilibrates, but if this were so, we would see a reduction in temperature resulting in a decrease in atmospheric CO2. The system is equilibrating and the equilibration rate is temperature dependent.
A decrease in CO2 growth, so long as it does not go below zero, is still an increase in the amount in the atmosphere. This means there is a correlation between temperature going down and CO2 going up. If CO2 is the cause, this is not supposed to happen. It has to be that temperature is the independent variable.
This graph shows how change in UAH globe temperature anomaly annual average and change in CO2 growth vary over time.
John, theoretical, you are right, but the point is that the influence of temperature on CO2 levels is very modest: some 16 ppmv/°C over the past 800,000 years. Some 13 ppmv increase since the Little Ice Age. That is all.
In the past 6 decades of accurate measurements alone, the increase caused by temperature is less than 10 ppmv, while the measured increase is 105 ppmv and the summed human emissions are over 200 ppmv:
http://www.ferdinand-engelbeen.be/klimaat/klim_img/acc_co2_t_1960_cur.png
And have a look at the trends in the derivatives (taken from 12-month running averages for Mauna Loa CO2 and HadSST3, yearly emissions):
All the variability in rate-of-change of CO2 is obviously caused by temperature variability, but temperature has no slope in the derivatives, thus is not responsible for the slope (and thus the bulk of the increase) of CO2 in the atmosphere, while human emissions have practically no variability, but double the slope…
Hi Ferdinand.
You said “the influence of temperature on CO2 levels is very modest: some 16 ppmv/°C over the past 800,000 years. Some 13 ppmv increase since the Little Ice Age.”
You didn’t explain how this was calculated. Ice core values for CO2 are not a reliable measure of absolute CO2 values though. It isn’t valid to claim the ice core values are an accurate representation of the actual atmospheric content at that time.
You said “but temperature has no slope in the derivatives, thus is not responsible for the slope (and thus the bulk of the increase) of CO2 in the atmosphere”
It is not clear to me why the lack of slope in the change in temperature matters.
If X is the cause of Y, then a change in X should result in a change in Y.
This is what we observe with Temperature and CO2 growth.
When there is a change in Temp, there is a change in CO2 growth.
Notice that a change in CO2 growth is a change in the rate of change. That is to say, it is the second order derivative.
Here is a graph of Change in Temperature versus change in CO2 growth.
If you graph a cross-plot of temperature versus CO2 growth it shows the temperature will need to fall by about 1.5 degrees C from where it is now for the CO2 growth to reduce to zero.
Here is a cross-plot of temp vs CO2 growth.
John,
Your last fit shows what is really going on. It says
dCO2ppm/dt=2.143*T+2.034
There is a steady average annual rise of 2.034 ppm/yr, which is our emissions. And there is a temperature component of 2.143*T, where T is presumably relative to some average value. So the integrated effect of T on ppmCO2 will be 2.143*mean(T)*t.
mean(T) looks like it is about -0.1, but anyway small. So the fluctuating component is about a tenth the magnitude of the effect of our emissions. Which would make it something like FE’s 16ppm/C, if the sign were right. But it isn’t.
Hi Nick
I am honoured that you are commenting on my comment. You are something of a legend on this site. The fact that conflicting opinions are allowed here is a sign that the folk here are interested in science.
I will have to give your comment some thought. Where I am is late at night and I have had a couple of wines. I cannot give it the respect it deserves right now.
To be honest, I suspect we are on the opposite side of most discussions on the subject of climate change but the great thing about WUWT is different opinions are allowed to be expressed.
However, I will give your input serious consideration.
Hi Nick.
Sorry, but you have the wring end of the stick.
It isn’t 2.034 ppm/yr”, it is 2.034 ppm/deg C. Which is quite another thing. You are going to have to go back and have another look.
Sorry. Should have been “wrong end of the stick.” remember, I did mention the wine.
No, it’s ppm/yr. Those are the units of the y axis. It is 2.143 that has units ppm/C.
Again, I misspoke. That should have been 2.143ppm/deg C.
2.034 is the offset. 2.143 is slope of the graph, the rate of atmospheric CO2 change per degree C.
John,
To start with, please use the variables only at the same order…
Plot T versus CO2 or dT/dt versus dCO2/dt, not dCO2/dt vs T or of lower orders…
dT/dt has no slope, thus can’t be the cause of the slope of the observed dCO2/dt, while human emissions lack variability, but their slope is twice as steep.
That means that the change in T only gives a modest change in CO2 (but all variability), while human emissions are responsible for the bulk of the slightly quadratic increase in the atmosphere and zero for the variability.
The change in seawater pCO2 with temperature can be exactly calculated with the formula of Takahashi, based on near a million seawater samples:
(pCO2)seawater @ur momisugly Tnew = (pCO2)seawater @ur momisugly Told x EXP[0.0423 x (Tnew – Told)]
http://www.sciencedirect.com/science/article/pii/S0967064502000036
That gives some 4%/°C change, regardless of composition or start temperature. Or maximum 13 ppmv since the LIA.
Even if you don’t trust ice core measurements, if you start from 1958, the calculated increase is some 10 ppmv for 0.6°C SST change, while the measured increase is over 100 ppmv with over 200 ppmv human emissions…
Ferdinand.
you said “To start with, please use the variables only at the same order…
Plot T versus CO2 or dT/dt versus dCO2/dt, not dCO2/dt vs T or of lower orders…”
The relationship is between temperature and growth, so I have to use different orders. An increase in Temperature correlates with an increase in the rate of change of CO2 and vice versa.
Regarding https://www.sciencedirect.com/science/article/abs/pii/S0967064502000036
If my understanding is correct, Takahashi et al 2002 is to do with change in the flux. That is, changes in the movement of CO2 into and out of the oceans. It is interesting because it affects the turnover time of CO2 but it isn’t relevant to the point I am trying to make.
I am talking about the atmospheric concentration and the rate of change of the concentration which is something different.
Only into the sea? None into vegetation on land?
Or photosynthetic phytoplankton in the oceans.
Yes, some into biomass. But that is not a large reserve.
It can be. There is a lot of potential. Most forests outside the tropics have been cut in the past and are not holding as much carbon as they could. Not that it matters. The real reason to increase forest biomass is to put that biomass on potentially high value timber- to produce wealth.
Not according to a professor at MIT, she says all the CO2 emitted by humans by breathing is taken up by the vegetation so it is a closed loop and adds nothing to Climate Change, so that’s 7 million tons of CO2 taken up by this not large reserve
Nansar,
If CO2 in the atmosphere instantly doubled, that does not instantly double new leaf growing in next growing season: maybe a few percent, that is all. Only on long term one can expect 50% more growth for 100% more CO2 in the atmosphere.
Until then, if a tree captures a “fossil” CO2 molecule, it can’t capture an extra natural CO2 molecule, as the total CO2 it can capture in a season is limited. Thus even if all human caused fossil CO2 was captured by the next available trees, that doesn’t change the total increase in the atmosphere, as that is leaving a “natural” CO2 in the atmosphere instead.
Tell us why CO2 from termites doesn’t stay in the atmosphere for 10,000 years. It is just a part of the total, just like anthropogenic generated CO2. It is like adding salt to a solution from 4 salt shakers and after removing 90% of the salt, saying the all the salt from the 3rd shaker is what caused the remaining. Dumb, dumb, dumb.
CO2 from termites comes from oxidising wood and other materials, which were laid down by photosynthesis in preceding years. ie returning to the atmosphere. If it wasn’t taken from the atmosphere, termites can’t return it.
Fossil fuels C in CO2 was not taken from the atmosphere – at least not for many milions of years ago.
Are you implying that there is a little devil suspended in the air who, depending on where each CO2 molecule comes from (according to its identity card ?), decides whether it should go to heaven (i.e. be absorbed) or stay in purgatory (i.e. in the air) ?
Is that the new normal in science ?
No
Nice deflection. That’s not what I said. I said attributing all the increase to just one minor part of the total in a solution is dumb. Saying it remains essentially forever attributes the total annual increase every year to just one minor source with no actual measurement capability to actually measure the source content.
You do realize that correlation is not proof of a casual relationship? The attempts to use correlation to prove that the growth of human CO2 is driving the increase in CO2 ppm not scientific until accurate measurements of every source and their residence time is available. Until then, assessments of attribution are nothing but opinion.
If you pour water into a bucket and the water level rises, there is no argument about causation. Same here.
Jim, there is not the slightest reason to know all the individual natural CO2 flows to know the end result to quite accurate figures:
Human emissions are known to reasonable accuracy, thanks to sales (taxes!) and burning efficiency.
The increase in the atmosphere is known with high accuracy at several monitoring stations all over the world.
The difference between these two thus is known with reasonable accuracy and that shows what nature has net absorbed or released over a year, without knowing even one natural CO2 flow in or out.
The main result: nature was for 6 decades more sink than source, with the exception of a few borderline El Niño events…
Termites only emit a tenth of the overall emissions humans create every year, from anthropogenic fossil fuel emissions,
There are also CO2 emissions from volcanoes and vents
These natural sources of CO2 emissions were unable to keep the atmospheric CO2 level from declining over billions of years … to only 180 ppm just 20,000 years ago.
Nature has been a net CO2 absorber for billions of years.
Oh Really?
Goodness. The concentration, possibly, but the actual molecules, why no.
Hi Nick.
I get that we’ve had instrumentation to sample the makeup of elements in our atmosphere for a 100 years or so now, but – serious question – what were folks using to measure the concentrations of CO2 in the air from the years 1000 AD to 1850 AD?
Air bubbles preserved in Antarctic ice (Law Dome). Not a proxy – actual ppm CO2.
Ice cores are not reliable. Think about it.
https://friendsofscience.org/assets/documents/180CO2_summary.pdf
Ice core CO2 is very reliable, Beck’s historical data not at all.
One can’t obtain “background” CO2 data (as are measured in 95% of the atmosphere) in the middle of forests, towns, growing crops,… as most of the historical data were taken…
See my response of what the late Ernst Beck wrote at that time, with lots of discussion between us in the period 2000-2010 until his untimely death:
http://www.ferdinand-engelbeen.be/klimaat/beck_data.html
And here an in-depth response after a recent post mortem publication of him, peer reviewed:
https://scienceofclimatechange.org/ferdinand-engelbeen-about-historical-co2-levels-discussion-of-direct-measurements/
Thanks Nick.
I tried to find what confidence levels the IPCC assigned to the Law Dome analyses, but I got zip.
I did note in an article about Law Dome that the publishers claimed that their findings were within the error bounds of other such similar analyses, but weren’t quantifying anything. But they were “confident” in their numbers, while acknowledging several erroneous metrics taken from ice core samples.
Have you seen any error margins or confidence levels in IPCC publications?
(please don’t spend any of your valuable time & efforts on this Nick, if the IPCC hasn’t been out, front & centre about reliance upon the Law Dome data, I guess they’re fully accepting without nominated error bands or confidence levels).
Here is a plot of Etheridge’s data from 3 different cores. They superimpose very well, and tell the same story as Law Dome – steady till about 1850 and then rapid rise. It doesn’t look as steady, because of the narrower y-axis scale:
Nick, do you see the <b>global MWP</b> and the <b>global LIA</b> in the Antarctic ice record?
Well, I thought the LIA started 1300. But the point is that the variation, however caused, was less than 5 ppm. Now it has risen 140 ppm. That isn’t due to temperature.
It also proof of a global MWP and LIA
nee.
different methods give differing results….
Henry, not that I know for ice cores…
Mr.,
Etheridge et al (1996) shows a repeatability of multiple measurements at the same depth of their three Law Dome ice cores as a standard variation of 1.2 ppmv. The overlap (1958-1978) with the direct measurements at the South Pole is within that standard deviation.
The difference between different ice cores for the same average gas age in general seldom exceeds 5 ppmv. Exceptions are in parts of the ice where there is a transfer from gas bubbles into clathrates and the normal used grating technique may give less reliable results (up to 20 ppmv variability at the same depth). The newer (but more time consuming) sublimation technique should resolve this, as that effectively destroys all clathrates.
More in-depth overview by Renee Hannon at:
https://co2coalition.org/wp-content/uploads/2024/06/Measurement-of-CO2-Concentrations-Through-Time-2024-June.pdf
Plotting multiple ice cores can give you an idea of the CO2 range. The Antarctic datasets vary from 4 to 15 ppm over the Holocene. Instrumental errors on individual samples are very small, ~1ppm.
Note that CO2 rarely breaks 300 ppm. The two samples that do are using a wet extraction instead of dry or sublimation.
More recent technology, namely plant stomata proxies show higher CO2 concentrations than the ice cores.
“CO2 in bubbles preserved in ice cores” is a fantasy : bubbles are not preserved, they are destroyed in the extracting process, and CO2 diffuses between air, water and ice which results in a complete pseudo-scientific mess whatever guesswork is applied.
On ice cores unreliable results which give almost anything but actual air CO2 concentration :
https://www.researchgate.net/publication/223504148_Do_glaciers_tell_a_true_atmospheric_CO2_story
It’s not complicated, of course CO2 bubbles are destroyed in the extraction process. Now that we’ve established that obvious fact can we end the insanity of further time and money on what fraction of one degree of warming over the next 100 years is anthropogenic? How can thousands of bloggers maintain their fetish over such a non-issue?
Petit-Barde,
Old news from the late Dr. Jaworowski, who was a specialist on the radioactive fallout of Tsjermobyl, including in ice cores. Which may migrate (as ions) through the ice matrix, which CO2 and other gases can’t do at all.
Made his remarks in 1992, completely refuted by Etheridge et al in 1996.
Accused Neftel of “fraud” for an “arbitrary” shift in dates to match the ice core data overlap with the data of the South Pole.
But used the wrong column in Neftel’s table: that of the ice age, not the average gas age. Thus Jaworowski was wrong, not Neftel.
When I confronted him with that fact, he responded that there was no difference in age between ice and gas in the ice cores, because of frequent melt layers (which block further gas diffusion),
Neftel encountered just one melt layer at depth and adjusted the gas age accordingly.
See further:
http://www.ferdinand-engelbeen.be/klimaat/jaworowski.html
Let Dr. Jaworowsky rest in peace, together with his wrong ideas about ice core CO2…
BTW: the newest sublimation technique, used in all cases where isotopic composition need to be measured, sublimates all ice, condensing everything, including N2, O2, CO2,… over a cryogenic trap and recovering all gases one by one over a mass spectrometer.
No CO2 can hide anywhere in that case…
Jaworowsky did not right alone : Segalstad was a co-author. Your point is 1 with dubious explanation (I don’t buy it) against dozens.
Newest sublimation technique : if it works as described,
CO2 is all retained : thus the concentration will be of water before freezing, thus much higher than any physical, historical atmospheric concentration. It will need again a guesswork to be credible. The problem is the guesswork : no one knows how to guess except those with some bias in mind …
CO2 diffuses in ice way before any extraction. No one can estimate how much CO2 migrated to other depths or even returned to the atmosphere and what fraction has to be taken into account.
Petit-Barde,
I have had similar discussions with Segalstad some 20 years ago about the fate of CO2 in the atmosphere, but so be it,
You simply don’t know how CO2 is measured. Even at Mauna Loa, CO2 is measured after freezing out water vapor at -70°C after passing of a calibration gas and a few minutes passing of atmospheric air, so that any CO2 that would adhere at the surface layer from the sample already is adhered, even if that is a minuscule quantity.
In the sublimation technique all CO2 as gas is retained and after freezing out water and after that, O2, N2, noble gases,…
Here for the newest sublimation technique, making new progress in ice core measurements, even without freezing:
https://amt.copernicus.org/articles/16/355/2023/
And how thick is a water layer on ice at -40°C (Vostok ice core) to give way to some migration?
Moreover the -theoretical- migration of CO2 through the ice was calculated from the migration in the neighborhood of melt layers in the Siple Ice core:
https://catalogue.nla.gov.au/catalog/3773250
A broadening of the resolution at medium depth from 20 to 22 years and a doubling of the resolution at the bottom to about 40 years (about 90,000 years ago). That is all, still far from a real problem, even in the relative “warm” (-23°C) ice cores. In the much colder (-40°C) Vostok or Dome C ice core, simply not measurable. How long do you think a migration out of such ice core (where much higher CO2 levels are measured in the outside atmosphere!) or reverse would take?
Even the late Dr Salby did not repeat this allegation, after I showed that if there was severe migration over time, the CO2 levels during deglaciations must have been much higher and higher back in the past and the in between ice ages at lower and lower CO2 levels with migration with in the second ice age negative to give the observed values… Salby never repeated his allegations…
You, of all people, should understand that correlation does not demonstrate causation. One thing that is poorly known is the contribution of CO2 from respiration of both terrestrial and marine photosynthetic organisms. In the case of trees, there is respiration from leaves (and perhaps roots) from trees at night during the growing season. (Not my specialty.) In the case of the seasons when trees are dormant, most of the respiration is from the roots, and undoubtedly varies with the ground temperature when above freezing. From my reading, I think that the respiration-CO2 is poorly characterized in the various Carbon Cycles that have been published.
Furthermore, I’m concerned that most of the Carbon Cycle researchers, dealing with poorly known ocean emissions, are going to be tempted (even if only subconsciously) to be sure that the mass balance is zero when human emissions are excluded. That is, I suspect that the ocean emissions estimates are impacted by the better known fossil fuel emissions. And, as I demonstrated in my first submission to WUWT, the fossil fuel and Portland cement measurements are actually a lower-bound on total anthropogenic emissions.
Clyde, the contribution of CO2 from the whole biosphere (land + oceans) is known from the oxygen balance: Any process that converts organic carbon into CO2 needs oxygen in quantitative amounts and reverse by photosynthesis.
That was extensively followed in the period 1993-2002 and the result was 1.0 +/- 0.6 PgC/year more uptake than release:
https://tildesites.bowdoin.edu/~mbattle/papers_posters_and_talks/BenderGBC2005.pdf
Thus the whole biosphere is a net absorber of CO2, not a net emitter. The earth is greening…
The same for the ocean surface, where DIC (total inorganic carbon) also is increasing.
Thus nature and even both oceans and the biosphere are net absorbers for a part of our emissions (as mass, not only the original molecules) an have zero contribution to the increase over the last 60+ years.
Our annual emissions equate to no more than a couple of extra CO2 molecules per tree leaf on the planet. Then consider that every living thing on the planet on the land, in the sea and in the air is composed of carbon compounds that were once in the air as CO2. The claim that it is only our “emissions” that remain in the air and accumulate year on year, nature cannot cope with our contribution or that the carbon cycle was somehow magically in perfect equilibrium before we started to burn coal and oil is a complete fairy tale designed to fool the gullible. And here you are.
“Our annual emissions equate to no more than a couple of extra CO2 molecules per tree leaf on the planet.“
Just not true. We emit 10 Mtons C (37 Mtons CO2) per year. Total biomass leaves included, is about 500 Mtons C. Cumulatively, we have emitted more than total biomass.
Speaking of Friday Funnies, you are so good for a laugh Nick. Do you pull the numbers for your charts off your toilet paper after your morning constitutional? The problem with your peer reviewed papers is that is all they are good for.
OMG. This explains a lot. Nick you’re off by 3 orders of magnitude…Natural Biomass is on the order of 500 Gtons. Nature produces 100 Gtons C per YEAR. That 10 Mton is the proverbial ‘fart in the wind’. You climate doomers are so tiring…
I’ll start believing climate doomers when they give up all the benefits of hydrocarbons. I’m guessing that will last about a day….
I was consistently wrong. It was late. We emit 10 Gtons per year. So the argument stands.
We produce 10 GtC/year and absorb nothing (still more land clearing than reforestation)
Nature produces 210 GtC/year and absorbs 215 GtC/year.
Remaining in the atmosphere: 5 GtC/year by guess what cause?
With a bad guess: obliged to do free work for a week at a bookkeeper’s office.
CO2 levels are still geologically very low.
When they drop in the next glacial period as the oceans cool and more CO2 can dissolve in them there had better be enough CO2 in the air or the plants die and the animals die with them.
Human populations are geologically very high. And they need food.
“the carbon cycle was somehow magically in perfect equilibrium before we started to burn coal and oil is a complete fairy tale”
SHARK
The carbon cycle had been gradually removing CO2 from the atmosphere until manmade CO2 emissions became larger than nayure could absorb
Yes in the past unicorns played in the fields. It was a balmy 25 degrees C during the day everywhere, 20 at night, food, clothing and housing were plentiful. Nobody wanted for anything…I’ve read that Sci-Fi story too Richard…Nature has been removing, adding, and removing CO2 in cycles for…well ever…whether CO2 emissions from man made sources is the primary driver of the recent increase is open to debate…it may be but big deal anyway. The planet seems to be warming nicely, biomass is increasing, we have plenty of food and if haters, communists and dictators would get out of the way we might actually be able to address extreme poverty that still exists instead of wasting trillions of $ on a fantasy.
The output of the Sun over the past 100 years has been at its highest of any hundred year period in the last 400 years.
It has warmed the oceans, that can store heat for over 100 years, that warming has reduced the amount of CO2 that can dissolve in them and the extra is accumulating in the atmosphere.
https://lasp.colorado.edu/lisird/data/historical_tsi
“The output of the Sun over the past 100 years has been at its highest of any hundred year period in the last 400 years.”
scvblwxq
Total BS based on irrelevant sunspot counts. Based on accurate satellite measurements TOA TSI has declined slightly since the late 1970s. Sunspot counts grossly exaggerate the actual tiny changes in TOA TSI.
Seems to me we are running at the very highest point of the Modern Warm Period. The peak we are on compares with the Medieval period, the Roman period and the Minoan period.
https://breadonthewater.co.za/2021/03/04/the-1000-year-eddy-cycle/
Ron Clutz
note that they used 14C to determine the Eddy cycle, see table 4, here,
https://www.koreascience.or.kr/article/JAKO201401657870968.pdf
The current warming is a natural process and could end soon…..
Nick,
Between 1000-1800AD a significant portion of land was cleared for farming to feed a growing population. Your graph doesn’t seem to reflect the clearance of swathes of forested land.
Could you explain your thinking, please?
I followed the published dataset of Vaughan, which starts from near zero in 1850. What is your basis for saying a lot of land was cleared before that?
It doesn’t show up in ppm CO2.
I was thinking about the Hyde database
The Royal Navy practically denuded England of trees long before 1850, what’s your basis to assert that farming etc. didn’t do the same before that date?
Nick,
What is the known physical mechanism that selects about half of this anthropogenic CO2 for dissolution in the oceans, as you suggest?
Is there any Law like Henry’s Law is for partial pressure? Was there any prior knowledge about this effect before it was seen?
Geoff S
Geoff,
I have an extensive article on this here. CO2 clearly does dissolve in the ocean to some extent, and the constancy of the airborne fraction is not due to Henry’s Law (which doesn’t apply where the gas reacts) but to the exponential rise of emissions.
The near constancy of AF is a simple matter of observation. We know the emissions and we know the ppm CO2.
Nick wrote, “the constancy of the airborne fraction is… [due] to the exponential rise of emissions.”
That is correct. In other words, the constancy of the airborne fraction (AF) is coincidental. When our emissions diverge from that exponential trajectory, the AF will change.
Eventually, the AF will be negative.
The AF doesn’t represent anything physical. Many people think it is some sort of law of nature that a fixed fraction of our emissions “goes into” other carbon sinks, and a fixed “airborne fraction” of CO2 emissions remains in the atmosphere. You can even find that implied in the AR6 WG1 Report, as part of their discussion of TCRE, a/k/a homeopathic climatology, which is the basis for RCB, which is the justification for Net Zero:
https://www.ipcc.ch/report/ar6/wg1/downloads/report/IPCC_AR6_WGI_AnnexVII.pdf#page=9

It’s nonsense. There is no fixed fraction of CO2 emissions that go into each of the major carbon reservoirs. ALL our emissions go into the atmosphere.
The CO2 which flows into other sinks comes from the entire pool of rapidly mixing CO2 in the atmosphere, not from our emissions.
Our CO2 emission rate is currently about 2.5 ppmv/year more rapid that the current net natural removal rate. So if emissions were reduced to 2.5 ppmv/year, the removal “fraction” would be 100%, the AF would be zero, and the atmospheric CO2 level would plateau. If our emissions were cut by more than that, then the removal “fraction” would be more than 100%, the AF would be negative, and the CO2 level would be falling.
Yes, all true.
Nick,
Thank you for your reference. I do study all of the material that you recommend.
My problems go back earlier in the process than your starting point.
If you read this you will get a feel.
https://wattsupwiththat.com/2022/04/20/sorry-but-hard-science-is-not-done-this-way/
This was the first time I took a detailed look at the Mauna Loa methodology. I was surprised by the extent of the culling of analytical numbers. Culling will always have an effect. It boils down to whether it is acceptable. The example I gave is not acceptable. The ML people are claiming an uncertainty that is far better than these numbers show.
I guess I have to look at more recent numbers to see how they are flying. They might be better, even OK now.
But, I would not be doing the type of analysis that is on your blog while the ML numbers are this uncertain. The main uncertainty I found was with accuraccy, i.e. the set of numbers from one operator is displaced from the other. This leaves an error in one or both. How do you compensate for the error?
Geoff S
Geoff,
Your post is about very small discrepancies (of order 0.5), which are indeed relevant to the task of detecting a possible lockdown effect. There isn’t much point in fussing about missing Mauna Loa values, as we have stations in various parts of the world returning very similar results.
But my post is about the matching of the total ppm with total emissions. Variations of 0.5 are not important when talking about a 120 ppm rise.
Geoff,
Besides a small distinction in isotopes in general, the uptake by the oceans is directly proportional to the pressure difference between CO2 in the atmosphere and the local pCO2 of the ocean surface:
F = k•s•ΔpCO2
http://www.pmel.noaa.gov/pubs/outstand/feel2331/maps.shtm
Where k is the transfer coefficient, which is influenced by wind speed (that influences the speed of transfer, not the equilibrium), s the local solubility (composition) and ΔpCO2 the local partial pressure difference.
Thus with an increasing pCO2 in the atmosphere, the uptake by the oceans remains in ratio with the extra CO2 in the atmosphere, which for the current average ocean surface temperature should be around 295 ppmv per Henry’s law.
That the ratio is near constant is pure coincidence, because of the steady increasing emissions, the level in the atmosphere steady increases, leading to steady increasing uptake and thus a near constant airborne fraction. With a drop from 10 to 5 PgC/year human emissions, there wouldn’t be an increase of CO2 in the atmosphere and with zero emissions, levels above equilibrium would drop with an e-fold decay rate of around 50 years or a half life time of around 35 years.
Did you tag one specific CO2 molecule and track its movement? If not, seems like the equivalent of saying that because the polar bear population has increased since the 70’s, there must be some 60-year-old polar bears out there…
(AFAIK polar bears have an average lifespan of 30 years.)
Fentanyl kills more assuredly than CO2 Nick. You should lay off the drugs. Nowadays you can never know what they are laced with.
“In other words, observed CO2 data contradict the climate narrative that says anthropogenic fossil fuel burning is driving CO2 concentration changes.”
And when you add in the saturation effect of GHGs and negative feedbacks……….
Three gentle corrective responses.
A rising ERL violates Kirchhoff’s Law. Both radiation and absorption increase proportionally for well mixed gases. This keeps energy flow constant at increasing concentrations of CO2.
High altitude water vapor is a direct negative feedback to CO2 increases because of the declining RH with altitude. This is the only place it matters due to saturation low in the atmosphere.
“Gustav Robert Kirchhoff (1824–1887) stated in 1860 that “at thermal equilibrium, the power radiated by an object must be equal to the power absorbed.” This leads to the observation that if an object absorbs 100 percent of the radiation incident upon it, it must reradiate 100 percent. As already stated, this is the definition of a blackbody radiator.”
The atmosphere is NOT at thermal equilibrium.
The air above the ERL is cooler/thinner, and the air below is warmer/denser.
Therefore more thermal energy is impinging the ERL from below than from above
Hence LWIR is able to escape to space.
Thermal equilibrium is irrelevant. We’re talking long term averages.
The atmosphere above the average radiation altitude has always been “cooler/thinner” and below “warmer/denser”. LWIR has always escaped into space. Nothing has changed.
Did you have a point?
Yes – the one I stated.
That Kirchhoff’s Law is Not violated, as the atmosphere is not in thermal equilibrium.
And of course nothing has changed.
The GHE has always warmed the Earth, via the presence of GHG’s.
As without them H2O would condense out as snow/ice fields and the Earth would plunge into a ‘snowball’ (as has happened in long past.
There is now though more non-condensing (CO2, CH4) gases in the atmosphere than for several hundred thousand if not millions of years.
Learn the definition and the meaning of the things you ideologically spout.
There is no such thing as a “blackbody radiator”. According to you that means Kirchhoff’s Law doesn’t exist. Of course, it does exist and it applies to all energy domains to varying degrees. You live in denial of reality.
GHGs do help warm the Earth’s atmosphere. I never said they didn’t. What I said is a rising ERL isn’t possible. It requires increasing absorptivity without a corresponding increase in emissivity. That is not possible.
“According to you that means Kirchhoff’s Law doesn’t exist. “
FFS.
I quoted you Kirchoff’s Law …..
““Gustav Robert Kirchhoff (1824–1887) stated in 1860 that “at thermal equilibrium, the power radiated by an object must be equal to the power absorbed.” This leads to the observation that if an object absorbs 100 percent of the radiation incident upon it, it must reradiate 100 percent. As already stated, this is the definition of a blackbody radiator.””
That Law does not apply to the atmosphere because of the condition that the body (atmosphere) must be “at thermal equilibrium”.
It’s not.
End of.
Nowhere did I say or imply that “Kirchhoff’s Law doesn’t exist.”
No one cares about the 100% case. That was my point. 99.999% is good enough.
Face-palm
Wot on earth does that comment mean ??
Koutsoyiannis is a well respected hydrology researcher. Learned something new about RRR from this paper. And he has several solid past skeptical papers on the problems with station siting and homogenization.
However, I found his most recent previous paper on the stability of the d13/d12 ratio to be very unpersuasive for two reasons:
Other readily available googlefu carbon isotope ratio data from NOAA (e.g. Amundsen Scott), Keeling himself from Mauna Loa published in Nature in (IIRC) 1977, and Scripps Oceanographic (various locations around the world, expressed usually as simply d13C/total CO2 since 1970–former going slowly down while laytter goes more rapidly up) say his ‘mostly stable’ isotope ratio conclusion likely isn’t correct from a climate (30 year+) perspective.
Since his new natural mechanism paper follows from that philosophically, a large dose of salt is in order.
Especially since the seasonal variation component of the Mauna Loa curve, most strongly influenced by NH summer/winter land, also leads to the strong inference that the overall slow Keeling Curve rise is mostly anthropogenic rather than natural. If it were mostly natural, the peak to peak year on year seasonal component would barely rise at all. Yet it does—predictably corresponding to estimated FF consumption rates.
Plus, the d14C efold time is significantly longer than 4 years, strongly suggesting the anthropogenic d12C efold time must also be longer. Our own Willis Eschenbach posted on this math several times in the increasingly distant past while showing Murray Salby was just wrong on this anthropogenic versus natural CO2 question also—but for somewhat different reasons in each of his 3 faulty old video lectures. Couldn’t even keep his story straight—claimed the problem was just the U kept his notes when kicked out of Australia, where he fled after being accused of academic misconduct in the US. Longish Salby story short.
My own view is that saying the slow rise in CO2 is mostly natural is a losing, easily disproven several ways, proposition. The slow rise is mostly anthropogenic from fossil fuels. But that does NOT say it is a problem as the warmunist alarmists claim:
OTOH, the ‘solutions’ proposed by warmunist alarmists simply cannot work even if there were a problem. There is no solution for renewable intermittency except backup dispatchable fossil fuel generation (3g nuclear does not cycle well). Green hydrogen is a mirage. Grid scale storage is a mirage. No viable EV replacement for class 7/8 trucks or construction equipment or jet airplanes. And so on.
I forgot that I did my own Salby refutation here 5/13/2017, titled “Is Salby right?”. he wasn’t then, and Koutsoyiannis is not now.
Many thanks! Clarity at last, after a long series of confusing and often ill-tempered comments.
Rud,
Your input is usually very helpful and well referenced, but your comments on Koutsoyiannis’s previous paper on δ13C variations (or lack thereof) in incremental atmospheric CO2 are very strange. You criticize it on two grounds, both of which are incorrect.
First, you claim that he uses “less than a decade” of data. No, he uses the full time range of available atmospheric measurements which started in the late 1970s as he shows in his figure 6. According to my calculation, that would be up to four and a half decades (see also reference linked in the next paragraph below).
Second, you claim that he used “only two” sampling sites as data sources. As his figure 10 shows he actually used four sites, sufficient to give a good spread globally. All the Scripps CO2 Program sites with significant duration of δ13C measurements (10 shown here: https://www.scrippsco2.ucsd.edu/graphics_gallery/isotopic_data/all_global_stations_isotopic_c13_trends.html
show the same trends for both CO2 and for δ13C which would indicate the same trend for their Keeling plots, i.e. the same relationship as shown for the four sites in his figure 10. Perhaps you could show a site that does not support a similar linear relationship between 1/CO2 and δ13C.
A final comment/question: what do you mean by the d13/d12 ratio? Perhaps you mean the 13C/12C ratio, or maybe the d13C value, the latter of which provides a very useful mathematical proxy for the 13C/12C ratio (and is what is actually reported by the observatories).
Jim,
What Koutsoyiannis didn’t take into account is that human low-13C doesn’t remain in the atmosphere: it is spread over all reservoirs, thanks to the huge seasonal exchanges of about 25% per year. That also brings CO2 from these other reservoirs back and therefore we have the remarkable effect that already 10% of the atmosphere is of “fossil” origin (based on the 13C/12C drop) and 6% in the ocean surface, while only 5% in the total inputs.
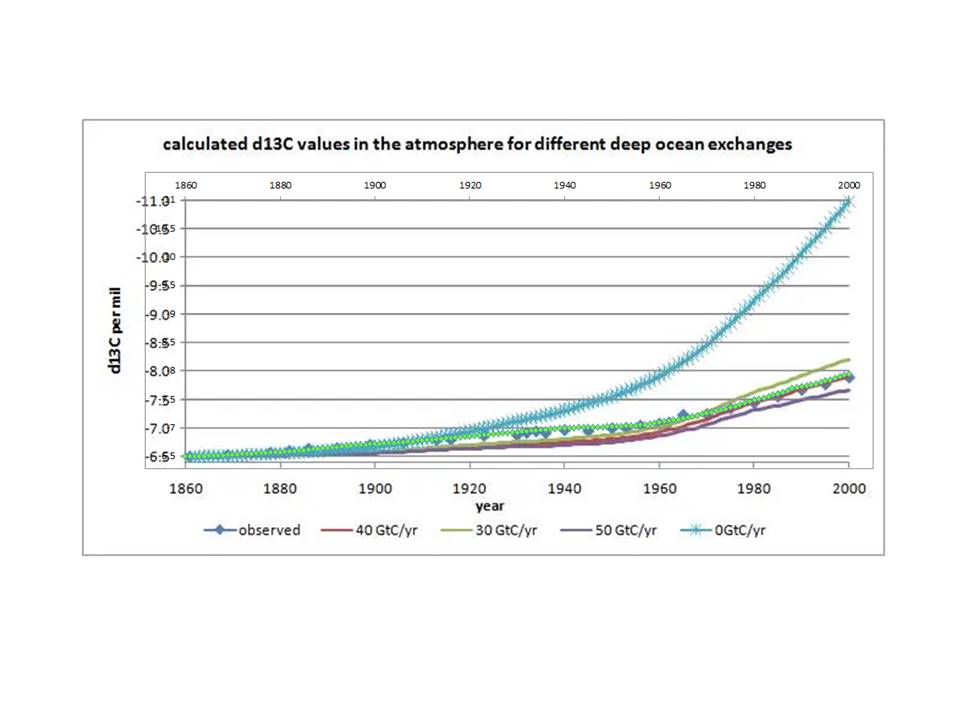
Then we have the deep ocean CO2 return, which still is from long before human emissions. In fact, we can calculate that flow by looking at the δ13C “thinning”:
Around 40 PgC/year deep-ocean – atmosphere circulation will do the job.
My comment was actually for Rud and I note that neither he nor you have responded regarding Rud’s two claims.
My original claim that the growth in atmospheric CO2 reflects a net δ13C of -13‰ which has been constant over time (beyond fluctuations due to ENSO and Pinatubo), and which has been validated by Koutsoyiannis’s previous paper, is further demonstrated (as you are aware) by the fact that applying this net value of -13‰ to the historic CO2 data provides far superior fit to the data compared to your model as shown here (my model is the small green diamonds which clearly overlay the observations):
Jim, there exists no constant source of -13 per mil δ13C. There is one certain source of -24 per mil δ13C: fossil emissions (for the latest coal/oil/gas mixture, but decreasing with the shift between these sources) and one uncertain source of average -24 per mil or sink at average +24 per mil δ13C. The latter problem of sink or source was resolved by looking at the oxygen balance: from 1990 on the biosphere is a net producer of O2, thus a net sink for CO2, thus increasing the δ13C level in the atmosphere and leaving human CO2 as sole cause…
The discrepancy in the years before 1990 was thought from slightly more decay than uptake by the biosphere:
https://www.science.org/doi/10.1126/science.287.5462.2467
Ferdinand,
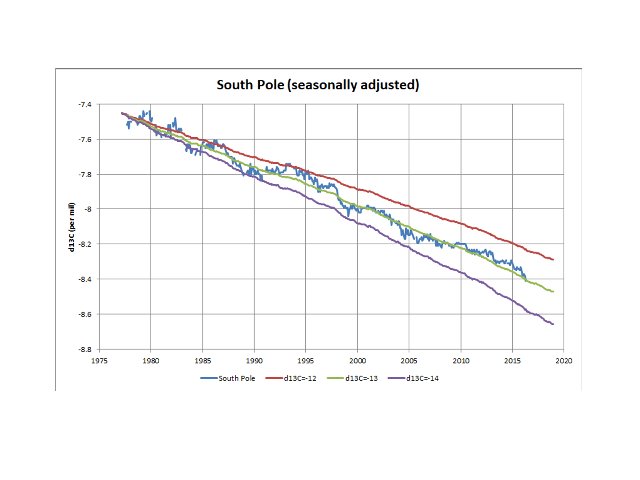
You say “there exists no constant source of -13 per mil δ13C”. I am well aware of that argument, which is why I find the measured parameter of particular interest. Plus, of course both 12C and 13C are stable isotopes and must respect mass balance principles. Perhaps you missed my comments that (a) it is a net effect (i.e. it incorporates all source/sink relationships that impinge on atmospheric CO2 content) and (b) it is an average over time periods beyond fluctuations due to ENSO and Pinatubo. Here is another plot which highlights the unambiguous evidence for the decline in atmospheric δ13C reflecting an average of -13‰ for the incremental CO2 (the three lines reflect atmospheric CO2 measurements with constant δ13C content of -12‰, -13‰ and -14‰, overlain on the actual δ13C observations with the very minor seasonal cycle removed).
So, on the one hand, the net trend reflects a source/sink combination that could in theory be a very complex mixture, while at the same time remains constant on average over the longer term, which would point to a relatively simple situation that varies between higher and lower δ13C content.
As we have discussed these data a number of times over the years, I will refrain from further comment but, instead, respond to your view that a paper published in 2000 somehow settled the science. I will do this by providing quotes from two more recent papers regarding both the mass balance and interannual variations of atmospheric δ13C.
First, the interannual variation in atmospheric δ13C has still not been explained by the ‘experts’. The most recent analysis of which I am aware is here: van der Velde, I. R., J. B. Miller, K. Schaefer, K. A. Masarie, S. Denning, J. W. C. White, P. P. Tans, M. C. Krol, and W. Peters (2013), Biosphere model simulations of interannual variability in terrestrial 13C/12C exchange, Global Biogeochem. Cycles, 27, 637–649, doi:10.1002/gbc.20048. A quote from the paper:
“Our new terrestrial bottom-up results cannot confirm the suggestion of a closed δ13C budget that allows low prescribed ocean net exchange variability. Because our model calculates low interannual variability in terrestrial disequilibrium flux, it suggests that other terms in the mass balance must accommodate the unaccounted variability.”
Second, the even more recent paper by Keeling et al in 2017 (access available via: https://www.ncbi.nlm.nih.gov/pmc/articles/PMC5625891/) was focussed on matching the general decline rate in atmospheric δ13C (rather than the interannual variations), having discovered that their “standard model run” failed to match actual observations following a data update. (Note that the assumption of a constant δ13C content of -13‰ did match the updated observations but the authors were seemingly unaware of this.) The paper proposed an increase in carbon isotopic discrimination of land photosynthesis in order to ‘correct’ the model decline rate. The authors highlight in the abstract that:
“Using updated records, we show that no plausible combination of sources and sinks of CO2 from fossil fuel, land, and oceans can explain the observed 13C-Suess effect unless an increase has occurred in the 13C/12C isotopic discrimination of land photosynthesis.”
Jim,
Sorry, I misinterpreted your reply…
My reaction on this item was because Koutsoyiannis uses the “fixed” δ13C record at -13‰ as “proof” that human emissions were not the cause of the δ13C decline, which of course is not right.
Then we have the deviations of the expected decline from fossil fuel emissions, which is also interesting to know what causes them.
Anyway, very interesting stuff and a lot to read again…
Ferdinand,
No problem but, to be clear, I did not take a position on Koutsoyiannis’s interpretation of the data. My interest has always been to focus on the data itself and use it to highlight information that might constrain potential hypotheses/models.
In the case under discussion here, many of the commenters are happy to rely heavily on the CO2 mass balance (actually it should be the 12CO2 mass balance, but that is close enough), while completely ignoring the fact that the 13CO2 must also satisfy mass balance principles. 13CO2 content is not insignificant at approximately 1.1% of the total. Not good science to ignore it (and I respect the fact that you are one of the very few individuals who do not ignore it).
In my view, it is especially important in this case where, as I have shown (and Koutsoyiannis has verified), the average net δ13C of the incremental atmospheric CO2 has been constant at -13‰ for a long time. Certainly since direct measurements started in the late 1970s and, if you accept the Law Dome data, since CO2 growth began in the mid-18th century. As shown by Figure 1 in Kőhler et al (2006), the Keeling plot for Law Dome data alone gives -13.1% with an r^2 of 0.96. Note that the Keeling plot does not require the estimated ice dates; it is simply based on the mass balance relationship between 1/CO2 and δ13C provided that each pair of values is measured on the same sample.
In conclusion, any hypothesis that invokes a significantly changing average net 13C/12C ratio (δ13C) in the CO2 being added to the atmospheric must be wrong. For your information, the estimate for the δ13C from fossil fuel emissions has dropped from your quoted figure of -24% to -28% now, reflecting the changing balance between sources as you noted it would. In addition, any model that fails to capture interannual variations must also be invalid.
Final point which made me smile. Tans (2020) in the paper “Reminiscing on the use and abuse of 14C and 13C in atmospheric CO2” states:
“Isotopic exchange is large enough sometimes to have the d(δ13C)/dt growth rate go in the “wrong” direction [i.e. to increase], whereas the dCa/dt growth rate is always positive” which he speculates could be due to a “contribution” from the oceans. Indeed, but don’t forget that we are looking at a net effect; the incremental CO2 (not just part of it) must have a net δ13C that is higher than the current atmospheric value. Might be worth investigating if these ‘wrong direction’ events could correlate with significant La Niña events (especially as major El Niño events appear to correlate with a lower net δ13C than average).
Sorry for a few typos slipping in and no edit facility still available. When referring to δ13C, all values are in per mil (‰), not per cent.
The idea that CO2 had extreme resident times in the atmosphere lacks commonsense. The role that CO2 plays in carbon based lifeforms means that all the sources and sinks are at the planets surface, most likely assisted by the fact it’s density is greater than air. It all comes down to supply and demand.
Water vapour on the other hand has a density lesser than air, so I imagine the molecules are often like ships passing in the night, one heading up and the other heading down.
Posting this article is exactly how to make the website into a science laughingstock.
Koutsoyiannis is the Greek scientist fool
Kenneth Richard is the hack writer fool
Two fools in one article!
BeNasty2000, the WUWT court jester, will be here soon to cheer this article and then we will have the WUWT Three Stooges of Climate Science.
The entire increase of CO2 since 1850 is manmade and is also good news for our planet.
Manmade CO2 emissions are roughly double the atmospheric CO2 increase, so nature MUST BE a net CO2 absorber.
That is no surprise, as nature has been absorbing atmospheric CO2 for billions of years.
The residence time, or turnover time, of a CO2 molecule is the average time that a carbon dioxide molecule spends in the atmosphere before it is absorbed by nature, become part of the annual carbon cycle.
Carbon dioxide does not have a specific lifetime because it is continuously cycled between the atmosphere, oceans and land biosphere and its net removal from the atmosphere involves a range of processes with different time scales.
What is the lifetime of CO2?
No single lifetime can be defined for CO2 because of the different rates of uptake by different removal processes.
Based on the rise of atmospheric CO2 in the past 50 years, the CO2 lifetime is over 50 years
RG shows yet again that he has zero comprehension of any actual science.
Totally incapable of arguing the actual scientific article.
A scientific NON-entity yapping behind a 6ft fence.
It is all just brain-washed AGW idiotology to him.
Try comprehending first before making dumb comments.. that way we will never hear from you again.
—–
Now where’s that empirical scientific evidence of warming by atmospheric CO2..
.. or haven’t you even bothered to try and find any. ? Just blind ignorant faith.
“The entire increase of CO2 since 1850 is manmade”
Which is of course complete BS…. but all RG has.
Poor ignorant little munchkin seems to think warming doesn’t create more NATURAL sources..
.. probably doesn’t even know that NATURAL sources totally dominate the CO2 flux.
“Posting this article is exactly how to make the website into a science laughingstock.”
So only articles YOU approve should be here? Widely diverse opinions in an UNSETTLED science should not be welcome? I sense an authoritarian personality- it’s your way or it’s a laughingstock.
RG is very much an out-of-the-closet totalitarian marxist.
Only his very limited and naïve comprehension of science is allowed.
“RG is very much an out-of-the-closet totalitarian marxist.” BeNasty
Does my blog in any way seem to be Marxist? Of course not. BeNasty is flapping his gums and lying like Kamaliar Harris. As usual.
The Honest Climate Science and Energy Blog: The August 31, 2024 Reading List
Everything you type on this blog is steeped in AGW cultism and self-aggrandising Iamrightism… a marxist trait.
Funny you don’t realise that.
I value truth while the author and other fools prefer the ridiculous myth that humans are only responsible for 4%, or about 17ppm, of the total 420ppm atmospheric CO2. The correct number is about 140 ppm, or 33% Not 17 ppm, or 4%
I can not change the frozen minds of fools like BeNasty but I can do the public service for conservatives of reminding people that BeNasty is a climate science fool.
Almost 100% of scientists since 1896 would have to be wrong for the 4% myth to be correct.
Those fools who look only at annual CO2 emissions deliberately ignore the fact that nature absorbs MORE CO2 than it emits every year. They make fellow conservatives appear to be science denying fools. Which is exactly what leftists love to hear. Leftists want no debate on the long term effects of manmade CO2 emissions. They WANT to hear the false claim that manmade emissions are not the cause of the +50% increase of atmospheric CO2 since 1850.
When asked for THEIR alternative explanation for how atmospheric CO2 increased 50%, the conservative fools start tap dancing and can’t answer. Some may cackle like Kamaliar Harris when asked a tough question.
“I value truth…”
Everybody values truth but nobody knows what it is, other than the supremely arrogant.
You’re probably right on this issue- but one never knows for sure, so hearing other ideas is what open minded people do.
“You’re probably right on this issue”
ZORZIN
Now you’re in trouble. The 4% mob will come after you with pitchforks and torches.
If anyone thinks manmade CO2 did not increase atmospheric CO2 +140 ppm, sinc 1850, then:
Where did all the manmade CO2 go?
and
What specific part of nature caused the +50% rise of CO2 since 1850?
I have asked these two questions for many years and not one 4% myth believer has even tried to provide any answers.
“The 4% mob will come after you with pitchforks and torches.”
I couldn’t care less. I’ve been a rebel all my life and don’t worry about what anyone thinks about what I think. 🙂
Don’t get so excited- there aren’t that many people in the “4% mob”. Don’t get a stroke over it.
Regardless, what really counts and what nobody knows is- what % of the supposed warming is due to ff. Some, like Tony Heller, doesn’t think there has been much of a change- and he also shows evidence that there are not more extreme weather incidents.
There is a theory, probably wrong, that a warming planet causes the increase. I don’t believe it, but I don’t go bonkers if somebody suggests it. I doubt that the purpose of WUWT is to provide “the truth, the whole truth, and nothing but the truth”.
“to provide “the truth, the whole truth, and nothing but the truth”.”
If it was, the very last person you would pay any attention to would be RG.
Joseph,
Not far from the truth:
Takahashi compiled near a million seawater samples for their increase in pCO2 with in/decreasing temperatures.
He did find that the in/decrease can be put in a universal formula:
(pCO2)seawater @ur momisugly Tnew = (pCO2)seawater @ur momisugly Told x EXP[0.0423 x (Tnew – Told)]
Independent of the seawater composition or the start temperature.
That means an about 4%/°C increase or about 16 ppmv/°C or some 13 ppmv extra since the LIA. That is all. All other increase is due to human emissions…
Nature circulates more than our annual contribution in a few days. What we add is background noise.
Nature absorbs more CO2 than it emits each year. Study that fact before your next comment.
It has varied greatly over geologic time. If what you say is true, there wouldn’t have been any prior to the rise of humans.
Joseph,
That nature now is more sink than source is because of the fact that the atmosphere is far beyond equilibrium with the sea surface temperature.
For the current average SST, the equilibrium CO2 level would be around 295 ppmv, not 425 ppmv. It is that difference that pushes more CO2 into oceans and vegetation.
Even over the past 800,000 years, the ratio was not more than 16 ppmv/°C
Such unsupported, dogmatic claims are easily shown for what they are. However, you aren’t worth my time to demolish them. They do, however, speak to your lack of understanding of how the Scientific Method is supposed to work. Speaking of being a laughing stock …
An astoundingly naive claim!
I provided science
You provided claptrap
No it is silly as this old article you never seen before explains:
Carbon Dioxide: The Houdini of Gases
LINK
Here is a compiled list of articles posted by Dr. Jeffrey Glassman PHD His first post is:
THE ACQUITTAL OF CARBON DIOXIDE
by Jeffrey A. Glassman, PhD
ABSTRACT
Carbon dioxide in the atmosphere is the product of oceanic respiration due to the well‑known but under‑appreciated solubility pump. Carbon dioxide rises out of warm ocean waters where it is added to the atmosphere. There it is mixed with residual and accidental CO2, and circulated, to be absorbed into the sink of the cold ocean waters. Next the thermohaline circulation carries the CO2‑rich sea water deep into the ocean. A millennium later it appears at the surface in warm waters, saturated by lower pressure and higher temperature, to be exhausted back into the atmosphere.
Throughout the past 420 millennia, comprising four interglacial periods, the Vostok record of atmospheric carbon dioxide concentration is imprinted with, and fully characterized by, the physics of the solubility of CO2 in water, along with the lag in the deep ocean circulation. Notwithstanding that carbon dioxide is a greenhouse gas, atmospheric carbon dioxide has neither caused nor amplified global temperature increases. Increased carbon dioxide has been an effect of global warming, not a cause. Technically, carbon dioxide is a lagging proxy for ocean temperatures. When global temperature, and along with it, ocean temperature rises, the physics of solubility causes atmospheric CO2 to increase. If increases in carbon dioxide, or any other greenhouse gas, could have in turn raised global temperatures, the positive feedback would have been catastrophic. While the conditions for such a catastrophe were present in the Vostok record from natural causes, the runaway event did not occur. Carbon dioxide does not accumulate in the atmosphere.
LINK
Sunsettommy,
Only true for 16 ppmv/°C over the past 420,000 years in the Vostok ice core, not true for the past 170 years…
Here for Vostok:

8 ppmv/°C for Antarctic temperatures, or about 16 ppmv/°C for global temperatures.
Not true for the 130 ppmv increase in the past 170 years with only 0.8°C temperature increase since the LIA…
With over 200 ppmv human emissions, it should be clear where the cause of the increase is to be found…
Utter bullshit.
Why do all those ranting and raving about “Man’s CO2” ignore Nature?
Whether I go to a farm and get manure or just buy some “miracle grow” fertilizer, the plants don’t care. They use it and grow.
Let Nature continue to “sequester” CO2 no matter it’s “source”.
Leftists rant and rave to frighten people, Then they claim more government power is the only solution for their fake boogeyman of CO2.
RG rants and raves because it is all he is capable of.
Mothe Nature injects and removes far more CO2 each year than does Man, as plants grow and die, then rotting. Residence time of Man-made CO2 is just a scare tactic, absurdly unscientific.
“Mother Nature injects and removes far more CO2 each year than does Man”
well said :-).. some 96% of total CO2 flux, actually.
Michael,
Have a fountain, where a pump induces 1,000 liter per minute from a basin under the fountain over the fountain, all dropping back in the basement of the fountain.
The maintenance guy opens a supply valve at 1 liter per minute to add some water to the basin.
The level in the basin increases, due to the 1 liter per minute from the extra supply, or from the 1,000 liter per minute pumping around?
Note that Koutsoyiannis concludes that natural CO2 increase is about 4 times human emissions
This coincides reasonably well with Ed Berry’s 20% of increase conclusion.
It is always nice when different scientists working in totally different ways, come up with somewhere near the same answer. 🙂
Can anyone explain to me exactly HOW CO2 lifetime is used in global climate models? Why should lifetime input values used by IPCC models be so different from actual measurements?
Among other things, it gives a realistic estimate on the quantitative uncertainty that is independent of the researcher’s samples.
Quite so bnice.
And the IPCC numbers roughly agree with you.
In the first IPCC assessment report(FAR) in 1991, total annual emissions, natural plus anthropogenic(N+A), were 197 GtC/yr. (FAR page 8)
In the sixth assessment report(AR6) in 2021, total annual emissions were 224.4 GtC/yr. (AR6 Chapter 5 p.700 )
So, over that time, total annual emissions (N+A) have increased by 28.4GtC/yr. Included in this increase is an increase in anthropogenic emissions of about 5 GtC/yr.
This means that between the FAR and the AR6, natural emissions have increased by 23.4 GtC/yr.
23.4 divided by 5 equals 4.68. So natural emissions are 4.7 times human emissions.
Oops. Should read, “natural emissions have increased by 4.7 times the increase in human emissions.”
John,
Except that human emissions were one-way increasing, while the natural (N+A) uptake increased with 2.5 GtC/year more than the (N) increase. Thus nature was an increasing absorber for CO2…
bnice,
In this case with the same wrong answer, which doesn’t make it right.
Other engineers and scientists: Peter Dietze (already in 1992), Richard Lindzen, Roy Spencer and our resident Willis Eschenbach (and myself) all come with an (observed!) around 50 years “adjustment” time.
Here for the discussion in 1997 of Peter Dietze’s calculation on the late John Daly’s blog:
http://www.john-daly.com/carbon.htm
The author is correct. The ipcc is using voodoo math. Residency is volume/flow. Consider a lake with a river in and out such that the residency time is 1 year. Now pee into the lake. The IPCC would have you believe that the residency time for the pee is thousands of years because the flow is so small. In fact the residency time for the pee is 1 year, because it is the total flow, not the individual flows that determine residency. The pee gets flushed out along with the river. Not independently. Residency time for CO2 is given by the combined flow of natural and human CO2. The residency is identical for both.
Ferdberple,
The residence time indeed is 4 years, and as far as I know, nobody disputes that, not even the IPCC.
In the case of your river, the “adjustment” time to remove some extra water supply is the same as the residence time.
In the case of the real world, the water is pumped uphill by a seasonal heat pump (called photosynthesis), independent of the river flow and thus the residence time is a mix of counter current flows and direct flows and doesn’t say anything about the real removal rate of some extra water supply in the river.
Let’s see what the real world shows:
Increase in the atmosphere = human emissions – human sinks + natural emissions – natural sinks.
For the past few years based on the amounts in the above Figure 9 and unknown natural emissions and sinks:
2.6 ppmv/year = 5.2 ppmv/year – 0 + X – Y
X – Y = – 2.6 ppmv/year
With 425 ppmv CO2 in the atmosphere:
If X = 10 ppmv/year then Y = 12.6 ppmv/year.
Residence time = 425 ppmv / 12.6 ppmv/year = 34 years
If X = 101.5 ppmv/year then Y = 104.1 ppmv/year (Figure 9.).
Residence time = 425 / 102.6 = 4.1 years
If X = 1000 ppmv/year then Y = 1002.6 ppmv/year.
Residence time = 425 / 1002.6 = 0.4 years
As can be seen: the residence time has zero effect on the fact that in all cases human emissions are the sole cause of the increase in CO2 in the atmosphere, no matter how large the natural influxes are: the natural outfluxes always must be 2.6 ppmv/year larger than the natural influxes to fulfill the carbon mass balance, thus can’t be the cause of the increase in the atmosphere…
APROXIMATE
Annual CO2 Flows
Emissions
Natural 96%
Manmade 4%
Absorption
Natural 98%
Manmade 0%
This simple example is too difficult for some conservative fools to figure out. Fools include Berry, Salby, Harde, Koutsoyiannis and BeNasty
These are the people who are science deniers doing their best to be ignorant and making fellow conservatives appear to be science deniers too.
They should not get any attention and Charles R. should know better than to post this claptrap.
WRONG. .. naïve, juvenile, simplistic and ignorant. As expect from RG.
Assumes natural levels of absorption and emission stay constant, with they most certainly do not.
He makes his fellow AGW-apologists look as stupid as he is, because he doesn’t realise that is him that is posting claptrap.
“Assumes natural levels of absorption and emission stay constant, with they most certainly do not.”
I agree completely. The IPCC do not take into account the fact that there must be an equilibrium relationship between CO2 in the oceans and in the atmosphere. When the world gets warmer, the atmospheric CO2 has to increase until the partial pressure of CO2 in the atmosphere matches the reduced solubility in the oceans. Humans are putting more CO2 into the atmosphere than is needed for this equilibtating process.
Per ice core estimates natural ocean temperature increases of 1 degrees C. caused slow outgassing of only 15 ppm to 20 ppm of CO2. The full ocean warming/outgassing and ocean cooling/ absorption cycle lasted about 100,000 years.
But with our relatively new manmade CO2 emissions, nature, including oceans, are absorbing CO2. Oceans are able to absorb about 15 ppm to 20 ppm less CO2 than they would have absorb in 1850 due to the +1 degree C. increase of average ocean temperature since 1850.
The actual CO2 increase of +140 ppm since 1850 is from manmade emissions, NOT from nature (oceans, land and plants)
AAAAha ha ha ha ha
Mike,
Any reference to a peer reviewed work that shows that ice core CO2 levels are unreliable (and no, the late Dr. Jaworowski is not a good reference)?
Still the ignorance that a warming climate creates far more CO2 sources, far out-weighing man’s tiny 4% contribution..
Sad to remain to dumb.
bnice
16 ppmv/°C, 13 ppmv since the LIA. That is all for the atmosphere in equilibrium with the oceans.
A greener earth, thanks to higher temperatures and more CO2, that gives minus 1.25 ppmv/year.
The other 110 ppmv CO2 increase comes from where?
And the 200 ppmv human emissions go to where?
AAAAAAAAAAha ha ha ha ha.
For your simple numbers to be correct human emission would have to be stable, in fact have grown in magnitude by vast amount. They are not, so your simple argument is not. There is way more going on than that, the earth spent 500 years in a cooling phase absorbing CO2 at a huge rate while at the same time sink were shrinking at a huge rate, when it entered its current warming phase these trends reversed. With CO2 concentrations changing at a percent or so each year to argue that it’s a natural function is reasonable, so is arguing that it is anthropogenic. We need to stop with the “I know the truth, you are an idiot” comments. Either way it’s not an issue because CO2 is not causing anything but gentle positive change.
We need to stop with the “I know the truth, you are an idiot” comments.
Yes, well said, its completely tedious. over and over again.
No one thoroughly understands climate change. Only recently Dark O2 was disovered being produced by metallic nodules on the floor of the Pacific over an area the size of India. Does Dark O2 play a role in climate? Are there more areas on the ocean floor that produce Dark O2? How many more unknowns are involved in climate change?
Mining dot com has a map of the Distribution-of-Polymetallic-Nodules
Cecilia Jamasmie, June 24, 2020
At least 18 locations, depending on how you count.
Indeed a strange finding, but something seems impossible:
Hey, surface level fossil emissions should mix at the same rate unless there some unproved isotopic process at work.Jet engine and kero rocket emissions at high altitude might take a while to blend in, but normal circulation flow would add at most a year or two to these gases. Unless there is some kind of un-discovered process producing a CO2 based molecule with Helium escape potential. That could hover up there for thousands of years, but its forcing effect would be negative. But if we need to invent a molecule for our political purposes, we will! And you will like it!
Wikipedia is dodgy on climate-related matters but is a popular source of factual information generally and describes WUWT as “a blog promoting climate change denial”, articles like this only reinforcing that false view.
Read the Koutsoyiannis paper behind the article. In particular, read the definitions of ‘residence time’. It’s not how long a CO2 molecule can stay in the atmosphere, and several different definitions are discussed. We can all dispute elements of the paper, but the findings do seem reasonable. It is surely extremely difficult to argue that the paper’s findings are out by a multiple of 1,000 or more.
Yes all papers you don’t agree with should be banned.
Post says:”…WUWT as “a blog promoting climate change denial”,…”
I prefer “a blog promoting a free exchange ideas”.
I am sure if you write an article it could be put up.
How can our government just stand by and allow the CAGW clowns to make such outrageous claims? They are liars and cheats.
Our government is composed of liars and cheats–kindred spirits.
That is why they are in government, that is where the most lying and cheating happens.
“We did it Joe” you sure did…’never allow your future to be compromised by what has been’ eh, history as we see from endless climate data ‘adjustments’ has yet to be written.
This result confirms a retention time value of 4 years for CO2 mentioned by Professor Ian Clark of the University of Ottawa. See the film “Global Warning (2019)” at time 1:06:39 on Bitchute:
https://www.bitchute.com/video/dxZCjesqSXp3
I really hope that this new paper gets the traction it deserves, to finally end this IPCC-driven net zero cabal.
This study confirms a residence time of 4 years for CO2 mentioned by Prof. Ian Clark of the University of Ottawa in the film “Global Warning (2019)” around the time 1:06:39. It was based on carbon isotope measurements. The film can be seen on bitchute:
link: http://www.bitchute.com/video/dxZCjesqSXp3
That the IPCC has two different residence times for the CO2 molecule depending on its origin (natural vs anthropogenic) is completely unscientific, but I suppose, the IPCC will continue to
maintain it’s mainly politically driven position as usual.
I asked the group earlier, but got no response: “How is CO2 residence time used in global climate models? Why would the IPCC use a value different from the scientific generally-accepted value?”
I looked at Ian Clark’s video, and he verifies that scientific instrumental measurements show about 4 years for a complete turn-over of atmospheric CO2.
But I still need to understand how and where in global climate models this parameter (CO2 Residence Time) is utilized? If Dr. Clark would know, could you provide an email address for him? Or anyone else who actually understands the inner workings of the models?
Only in a secondary way, climate forcing is calculated from CO2 using the Myhre formula. Historic CO2 is used using proxies and measurements since 1950. Future CO2 is a given from concentration scenarios. Emission pathways are converted to concentration scenarios using the Bern model, which underestimates future sink with reducing emissions.
It gets weirder still. Endersbee calculated that the CO2 ONLY DEPENDS ON SST…..
https://breadonthewater.co.za/2024/07/28/the-mystery-of-the-missing-human-generated-carbon-dioxide/
Rate of CO2 increase closely follows ocean atmospheric temperatures.
That is a good cross correlation. Is one of my legs too. So where is the man made CO2 going? It is being used nearest to where man is putting it up in the air. For more trees, lawns and crops. Deserts are getting greener. There are problems of rotting sea weed in the Caribbean. Whatever remains of man’s efforts not being used by nature just disappears in the deep cold ocean. Our moon is constantly shuffling it up and down like a gravitational stirrer. Amazing. How God made it all.
Going further in the SST – CO2 link, here is a Humlum’s paper which might be of interest. He also investigates any possible correlation between antrhopogenic CO2 emission and global CO2 measurements in 4 stations (among which Mauna Loa) :
https://www.researchgate.net/publication/257343053_The_phase_relation_between_atmospheric_carbon_dioxide_and_global_temperature
I understand that WUWT’s running a post doesn’t mean it endorses the post’s content. But to give readers context I would have thought that it would have included at least the Engelbeen series beginning here in the head post’s “related” list.
A little OT, but since the aim is to evaluate human activity effect on CO2 concentrations …
For those who trust the ice core proxy data which seem to show that CO2 was always under 290ppm during the last hundreds of thousands years :
In the 1992 paper below the authors explain why they think ice cores proxy data give unreliable results which represent almost anything but actual past atmospheric CO2 concentrations.
Very high uncertaincies, poor understanding of complexe physical and chimical reactions in the ice sheet, dubious methodologies with unfounded data discarding, unjustified air bubbles age adjustments with respect to the surrounding ice, and so on, all this makes it very difficult to give any credit to the ice cores data as a reliable atmospheric CO2 concentration proxy.
https://www.researchgate.net/publication/223504148_Do_glaciers_tell_a_true_atmospheric_CO2_story
1959
CO2 316ppm
measured
No need to rely on ice core estimates
The increase from 1959 to date being entirely due to the increase in SST:

You are very confused
CO2 emissions increase the greenhouse effect which impedes Earth’s surface cooling. It is CO2 emissions that raise ocean temperatures and land temperatures. You are confusing cause and effect.
Dear Richard, me thinks you don’t have a clue on how exactly the gh effect works. I have tried to explain things for people like you, here
https://breadonthewater.co.za/2022/12/15/an-evaluation-of-the-greenhouse-effect-by-carbon-dioxide/
Let me know what fault you find in my report. I would appreciate that.
WRONG as always. bass-ackwards.
CO2 DOES NOT impede cooling except in AGW-cultism.
Rate of CO2 increase FOLLOWS temperature. so cannot be the cause.
Not even RG is stupid enough to say that the pulse of CO2 from El Nino events is what causes those events… or is he that stupid. !!
You’re right, Richard.
It’s not as if quantification of the temperature dependence of Henry’s Law is mysterious.
That plot shows a 0.26°C rise in SST accompanying a 40 ppmv (12%) increase in atmospheric CO2 concentration.A 0.26°C increase in SST slows CO2 update by the oceans by about 1%. But the 12% increase in CO2 level accelerates CO2 uptake by the oceans by 12%.
12% > 1%, so ocean uptake of CO2 accelerated.
The people who think the CO2 increase is due to ocean outgassing are wrong.
https://sealevel.info/atmospheric_co2_increase_is_not_from_ocean_outgassing.html
Caveat: the “CO2 SOLUBILITY IN WATER” graph that I posted is for freshwater. It shows about a 3% decrease in solubility of CO2 per 1°C of water temperature increase. But Ferdinand has educated me, that Takahasi (2002) has data specifically for seawater, which shows a somewhat larger effect, of 4.3% per 1°C of warming:
If someone wants to dive deeper into this, here’s a new paper which should provide hours of enjoyment:
https://egusphere.copernicus.org/preprints/2024/egusphere-2024-626/egusphere-2024-626.pdf
The late Prof. Jaworowski’s complaints in that 32yo paper are unpersuasive to me.
E.g., he complained about ignoring the Beck data, which is highly inconsistent, and almost entirely from low quality measurement sites. But Dr. Jaworowski didn’t mention any of that.
https://www.ferdinand-engelbeen.be/klimaat/beck_data.html
He also complained, quite absurdly, about adjustments to the dates attributed to Siple Dome core air bubbles, to account for the well-known fact that air trapped in ice is younger than the ice, itself, due to mixing which occurs until there’s enough ice mass to seal the bubbles.
The bottom line is that the Antarctic ice core measurements are the best data we have for atmospheric CO2 levels prior to 1958, and they are quite good.
In fact, compared to almost all other paleoclimate data, they’re superb. (Of course, that’s a low bar.)
If I were a billionaire (or even a lowly hundred millionaire), I would immediately give Professor Koutsoyiannis a €5 million prize, so he could continue his work without financial constraint. Then I would allocate €1 million for debate events for any scientist who wanted to challenge his findings.
Write is off on your income tax as a dingbat donation
write off RG as a total anti-science non-entity.
Not really, RG is on the same page as Roy Spencer and Ferdinand Engelbeen.
Analysis of C14 isotope concentrations in atmospheric CO2 reveals the natural and FF contributions to total mass.
The specific activity of 14C in the atmosphere gets reduced by a dilution effect when fossil CO2, which is devoid of 14C, enters the atmosphere. We have used the results of this effect to quantify the two components: the anthropogenic fossil component and the non-fossil component. All results covering the period from 1750 through 2018 are listed in a table and plotted in figures.
These results negate claims that the increase in total atmospheric CO2 concentration C(t) since 1800 has been dominated by the increase of the anthropogenic fossil component. We determined that in 2018, atmospheric anthropogenic fossil CO2 represented 23% of the total emissions since 1750 with the remaining 77% in the exchange reservoirs. Our results show that the percentage of the total CO2 due to the use of fossil fuels from 1750 to 2018 increased from 0% in 1750 to 12% in 2018, much too low to be the cause of global warming.
https://rclutz.com/2022/07/07/by-the-numbers-co2-mostly-natural/
Ron
Fossil fuels from the past also have C14? Why wouldn’t they have that?
Because C14 has a half life of ~6,000 years so it’s all gone after a few hundred thousand years.
Clueless Klutz strikes again
100% of the atmospheric CO2 increase since 1850 is manmade.
Nature has been a net CO2 absorber for billions of years.
The isotope analysis is irrelevant
Humans are adding about 5 ppm CO2 every year and the atmospheric CO2 level rises about +2.5 ppm every year. A 12 year old child could figure out the math. But not you.
Poor RG.. Cannot produce any evidence of anything…
… just rants with its gormless idiotic non-comprehension of actual science.
Poor thing is stuck at the 12-year-old stage… even down to the childish ADHD effects which he has yet to get in control..
Henry,
Carbon-14 is a radioactive isotope of carbon having a half-life of 5,730 y. Carbon-14 atoms are produced in the atmosphere by interactions of cosmic rays, and they have reached an essentially constant steady state activity, i.e., disintegration rate, in the total world environment (Eisenbud and Gesell 1997). The age of fossil fuels is much longer than the 5,730 y half-life of the 14C radioactive isotope; consequently, fossil fuels are devoid of the 14C isotope. The units used in this paper are disintegrations per minute per gram of carbon abbreviated as dpm (gC)−1, the common units used in 14C dating.
Interesting. Thanks.
I am coming back to this later. Have to investigate. I vaguely remember something about this concerning the Eddy cycle.
Carbon 14 is generated by a nuclear electron capture reaction, where a proton of a 14N nucleus captures a high energy electron to form a neutron:
14N(7 protons+7neutrons) + e –> 14C(6 protons + 8 neutrons). This depends on cosmic ray intensity which is higher when the magnetic field of the sun is weaker (less shielding of the inner solar system).
5,730±40 years is the old half-life value. More recent work has reduced that slightly, to 5,700±30 years.
Kondev, F. G. et al (2021). The NUBASE2020 evaluation of nuclear properties. Chinese Physics C, strong>45(3), 030001-22. https://doi.org/10.1088/1674-1137/abddae
Doing the math. So take 3.5 years as the turnover time. Today’s level of nearly 420 ppm means that 120 ppm of inflow is required annually, or 120 +2 ppm if it is to increase as it has been. Where does 122 ppm of CO2 come from? Well, let’s say we can count on 6 ppm of FF CO2 (5%) and the other 116 being non-human emissions.
Ron, The 3-4 years residence time is only seasonal back-and-forth cycling of CO2 between the oceans and biosphere in spring-summer and back in fall-winter and doesn’t add or remove one gram of CO2 in or out the atmosphere as long as ins and outs are equal.
Any extra CO2 of whatever source needs much more time to get removed and that is about 50 years as is observed. Not 4 years and not 1000 years (as the IPCC assumes, but that is based on the Bern model…).
No Ferdinand. All of man’ s CO2 is taken away by nature to make earth more green and to give us greater crops. There is ample evidence for that. Ask me. There is even much more algae in the oceans. What is left is going into deep sea where the water is cold enough:
CO2 + 2H2O + cold = HCO3- + H3O+
Eventually more bicarbonate is going to more carbonate which precipitates as more CaCO3.
So next time when you swim in the ocean, you could just be walking on the fossil fuel that we all put in the air….
No Henry as usual you have your cause and effect reversed.
Simple bookkeeping proves you wrong.
“All of man’ s CO2 is taken away by nature to make earth more green and to give us greater crops”
So how come the air has over 420 ppm, vs 280 ppm preindustrial? Someone else’s CO2?
Ferdinand,
the adjustment time defined by the IPCC use the Bern model. According to their own definition, it is another name for its “lifetime” :
IPCC tar : “This lifetime has been defined as an “adjustment time” that takes into account the indirect effect of the gas on its own residence time.”
According to the IPCC this lifetime (thus “adjustment time”) varies from 5 to 200 years. This because : IPCC tar : “No single lifetime can be defined for CO2 because of the different rates of uptake by different removal processes.”
As I understand it, these CO2 lifetime values take into account the different CO2 sinks among which the oceans, thus are based on the Bern model.
https://archive.ipcc.ch/ipccreports/tar/wg1/016.htm
All their definitions are here (AR5) :
https://www.ipcc.ch/site/assets/uploads/2018/02/WG1AR5_AnnexIII_FINAL.pdf
Lifetime : general term, may be used as adustment time.
Turnover time (also named Global atmospheric lifetime) :
Reservoir mass M / Total rate of removal S.
4 years for the CO2.
Adjustment time :
it is the decay time of an instantaneous pulse input into a reservoir.
It equals the turnover time when the removal is proportional to the reservoir mass.
When there are several reservoirs or when the removal is not proportional to the total mass, the response time must be applied : This applies to CO2 according to the IPCC : its turnover time is 4 years, but most of the CO2 is returned to the atmosphere in a few years. Thus, the adjustment time of CO2 in the atmosphere is actually determined by the rate of removal of CO2 from the surface layer of the oceans into their deeper layers. Approximate value : 100 years.
Response time :
Time needed for the climate system to re-equilibrate to a new state. Due to their large heat capacity, oceans have a much longer response time from decades to millenia. See lifetime for another definition of response time pertinent to the rate of processes affecting the concentration of trace gases.
Those definitions are circular. CO2 lifetime –> see adjustment time –> see response time –> see lifetime.
The CO2 adjustment time of 100 years has no scientific basis :
The “in a few years” is dubious : what’s absorbed is absorbed, any further emission process is independent of this absorption and thus, can’t contribute to any lifetime increase.
The oceans surface layer story is dubious : for example, if there is too much CO2 wrt equilibrium with calcium, it precipitates : CO3²- + Ca²+ <-> CaCO3. Oceans surface can absorb almost any mass of atmospheric CO2 without needing any such lag as 100 years.
You can do yourself some easy experiements to see how fast water absorbs excess of CO2 from a previous equilibrium, when a candle is burnt under a bell jare placed in a plate filled with water for example.
The only pertinent “lifetime” is the overturn time which is 4 years for the CO2. The adjustment time and response time are also 4 years not 50, 100 nor 200 nor 1000, because physics and mass conservation apply to the CO2 fluxes instead of the Bern model or the IPCC oceans surface layer pseudo-science. In a world governed by physics, all those fake lifetimes are useless.
Petit Barde,
I know, different definitions are mangled which makes it not so easy to understand what really happens in the atmosphere…
The two main definitions in the case of CO2 are:
The residence time of a single CO2 molecule of whatever origin in the atmosphere, before being replaced by a CO2 molecule from another reservoir.
RT = mass / throughput
or for 2020 figures:
RT = 890 PgC / 215 PgC/year = 4.14 years
Where 1 PgC = 1 GtC = 2.13 ppmv CO2
The 215 PgC/year is mainly caused by the huge seasonal fluxes between oceans via the atmosphere into vegetation in spring/summer and reverse in fall/winter. At the end of the year, there is zero change of CO2 in the atmosphere, as long as the sum of all ins and outs are equal.
These processes are temperature/photosynthesis/biological and only partly influenced by the momentary CO2 pressure in the atmosphere.
Then we have the adjustment time:
If the removal of some extra constituent of a dynamic process in equilibrium is linear with the disturbance (Le Chatelier’s principle), then the formula to reduce an extra injection of that constituent to 1/e (~37%) of the original disturbance also is quite simple:
Tau = disturbance / effect
or again for 2020:
Tau = 120 ppmv / 2.25 ppmv/year = 53 years
Quite a difference with the residence time…
The 2.25 ppmv/year is the real, calculated, net removal rate of CO2 out of the atmosphere: observed increase in the atmosphere (Mauna Loa: ~2.25 ppmv/year) minus human emissions (calculated from fossil fuel sales and burning efficiency: ~5 ppmv/year).
That means that nature over the past 6 decades was near always a net sink for CO2 of up to 2.25 ppmv/year, not a source…
The difference with the Bern model of the IPCC:
The IPCC assumes that all reservoirs get saturated at a certain level of CO2 in the atmosphere. That is only true for the ocean surface for around 10% of the change in the atmosphere (the Revelle/buffer factor) but by far not for the biosphere, up to 1,000 ppmv and absolutely not for the deep oceans.
According to the Bern model, the deep oceans are completely isolated from the atmosphere by the “uniform” surface layer at average only 7 μatm below the atmosphere, while the real sinks near the poles that brings fresh oxygen and CO2 into the deep oceans have a pCO2 difference with the atmosphere up to 275 μatm…
See: https://www.pmel.noaa.gov/pubs/outstand/feel2331/maps.shtml and next section.
Thanks Ferdinand, but I understand all the circular, vague and bogus IPCC definitions, that’s why I don’t buy it :
1) 1850 base 285ppmv : based on what ? Ice cores guesswork ? This is in opposition with many actual measurements carried on at the time by actual scientists who knew what they are doing.
2) Response time : Net sink of 2.25ppmv : there is no actual direct measurement of the net natural emission, only dubious proxies and guesswork, all scientifically unconclusive. The 120 ppm as a perturbation is pure pseudo-science : why not include all the natural positive+human emissions since 1850 ? Because nature can discriminate natural and human CO2 and thus create a counter-action specific to the human CO2? It can’t. Or because this would imply that human emissions are irrelevant wrt natural emissions ? As said before, such response time has nothing to do with science nor reality.
3) SST -> CO2 : again, there are no actual direct oceans CO2 emission/absorption measurements, only dubious proxies and guesswork : again scientifically unconclusive.
Actually, the only strong and significant correlation is from SST towards global CO2 and not from human CO2 towards global CO2 which is too weak and even negative to allow any conclusion on human induced CO2 increase :
https://www.researchgate.net/publication/257343053_The_phase_relation_between_atmospheric_carbon_dioxide_and_global_temperature
Petit-Barde,
1) For the historical measurements: the methods were not that bad, but where was measured was bad. Totally unreliable: between 250 and 650 ppmv within a few hours at the same place near forests or in the middle of towns:
See: http://www.ferdinand-engelbeen.be/klimaat/beck_data.html
Or peer reviewed:
https://scienceofclimatechange.org/ferdinand-engelbeen-about-historical-co2-levels-discussion-of-direct-measurements/
2) You don’t need anything of the natural emissions or sinks, not one of these fluxes to know the exact response of nature: that is the increase in the atmosphere minus human emissions, for each year again. That is called the carbon mass balance that needs to be fulfilled every moment of time.
That is not a guess, just simple bookkeeping.
The 120 ppmv can be exactly calculated with the formula of Takahashi, at least for the past 65 years: even if we forget the changes before 1958, the temperature increase 1959 (at average 315 ppmv) to 2024 (at 425 ppmv) is about 0.6°C, which is good for an increase of some 10 ppmv in the atmosphere from warming oceans. The rest of the 110 ppmv increase over that period alone is from the over 200 ppmv human emissions over the same period, or what else?
Human emissions are one-way, natural emissions are almost all cycles and cycles only give a difference in remaining quantity if there is an non-equality between inputs and outputs, which in this case is more output than input…
3) What? There are currently millions of sea surface samples taken from marine surveys, plus 6 fixed stations and lots of commercial vessels equipped with fully automatic pCO2, pH, temperature,… sampling…
See Feely et al at:
https://www.pmel.noaa.gov/pubs/outstand/feel2331/exchange.shtml and following sections…
From these measurements one can calculate the CO2 transfer between the oceans and the atmosphere together with wind speed for the velocity.
The phase relation only shows that temperature is responsible for all the variability around the CO2 increase, it says nothing about the cause of the increase itself, which is almost all from human emissions:

Temperature has no slope in the derivatives but all the variability, human emissions have twice the slope and hardly any variability. Thus human emissions are the cause of the bulk of the increase in the atmosphere…
Ferdinand asserts an “adjustment” time an order of magnitude (or more) longer than “residence” time. And yet:
In the 2 years following the June 15, 1991 eruption of the Pinatubo volcano, the natural environment removed more CO2 than the entire increase in CO2 concentration due to all sources, human and natural, during the entire measured daily record of the Global Monitoring Laboratory of NOAA/Scripps Oceanographic Institute (MLO) May 17, 1974 to June 15, 1991. Then, in the 2 years after that, that CO2 was replaced plus an additional increment of CO2.
June 15, 1991 was the start of the major Pinatubo volcanic eruption and April 22, 1993 was the date of maximum deceleration in net global average atmospheric CO2 concentration after Pinatubo, as reported in the daily measurement record of MLO.
The maximum force of the environment to both absorb and emit CO2 could be much larger than 25 times net “human” emission, and it and could occur much faster. We do not know the environment’s maximum possible force or maximum possible specific impulse But it is very safe to infer from this result that human CO2 emissions are not an environmental crisis.
Ron,
In the of the Pinatubo eruption (1991), humans emitted about 3 ppmv. Nature removed some 2.5 ppmv, remaining 0.5 ppmv CO2 in the atmosphere, all caused by the 3 ppmv CO2 from human emissions.
Ron wrote:
Where on earth did you hear that? It is completely wrong.
The Mauna Loa (MLO) CO2 measurement record started in 1958, not 1974.
From 1974 to 1991 the CO2 level at MLO rose by 25.51 ppmv. (That’s based on annual averages.)
Here are the measured CO2 levels at Mauna Loa (annual averages):
https://sealevel.info/co2.html
For the relevant period:
year level
1990: 354.45
1991: 355.70
1992: 356.54
1993: 357.21
1994: 358.96
1995: 360.97
In the two years following the Mt. Pinatubo eruption, the CO2 level continued to rise, albeit not quite as fast as usual. There was no 25 ppmv drop in CO2 level.
RG carpet bombing the thread shows that we are over the target.
RG is correct.
Ron,
So looking at your graph, why were there virtually no “natural” emissions before about 1850? And why did they really accelerate after 1970?
If the current huge rise in ppm CO2 is due to natural emissions, what were those emissions doing during the previous millenium when ppm CO2 wasn’t rising at all?
Nick, read the legend on the graph. At year 1750 atm CO2 is 276, all of it natural. Afterwards natural sources add more to the base value of 276. And the total CO2 is shown rising from 276 to 396 in year 2018.
Yes, but “natural” emissions, you say, caused an increase of about 10 ppm in the 120 years from 1750 to 1870. Then another 70 ppm in the 140 years to 2010. Why would “natural” emissions, which seem otherwise fairly steady, accelerate so much, just coincidentally with industrialisation? Why no such rise in the preceding millenium?
Plus, of course, the mass balance issue. If our emissions well exceeded the actual rise, as your graph shows, and there was so much natural as well, then where did the rest of our CO2 go? Absorbed, presumably. But was that natural (what else)? Did you deduct it from natyral emissions?
Correction, the graph shows total CO2 at 406 in 2018 (276 + 130)
Nick, natural CO2 emissions are rising along with temperatures, thank goodness, since the end of the LIA.
As for the distribution, 14C analysis shows as of 2018 the fraction of FF CO2 remaining in the atmosphere is 47 ppm out of 205 ppm added by humans since 1750.
To summarize, despite an estimated 205 ppm of FF CO2 emitted since 1750, only 46.84 ppm (23%) of FF CO2 remains, while the other 77% is distributed into natural sinks/sources. As of 2018 atmospheric CO2 was 405, of which 12% (47 ppm) originated from FF. And the other 88% (358 ppm) came from natural sources: 276 prior to 1750, and 82 ppm since. Natural CO2 sources/sinks continue to drive rising atmospheric CO2, presently at a rate of 2 to 1 over FF CO2.
Only 16 ppm per degree Ron
Hans, you refer to a claim regarding only one source/sink, namely the ocean. This is a bigger picture with supporting data.
Ron only the oceans are bringing 16 ppmv°C extra in the atmosphere when they are warming, vegetation only grows harder (even in desserts…) with more CO2 (less water vapor loss by fewer stomata needed) and in general higher temperatures for most of the earth. The earth is greening, thus not the cause of the CO2 rise.
That’s wrong, Ron
The amount of 14C “radiocarbon” in the atmosphere was nearly doubled by atmospheric testing of H-bombs. When the Limited Test Ban Treaty went into effect in 1963, that “bomb spike” began falling, as exchanges with the oceans and other carbon reservoirs replaced atmospheric CO2 containing elevated radiocarbon with COt containing a “normal” (lower) fraction of 14C.
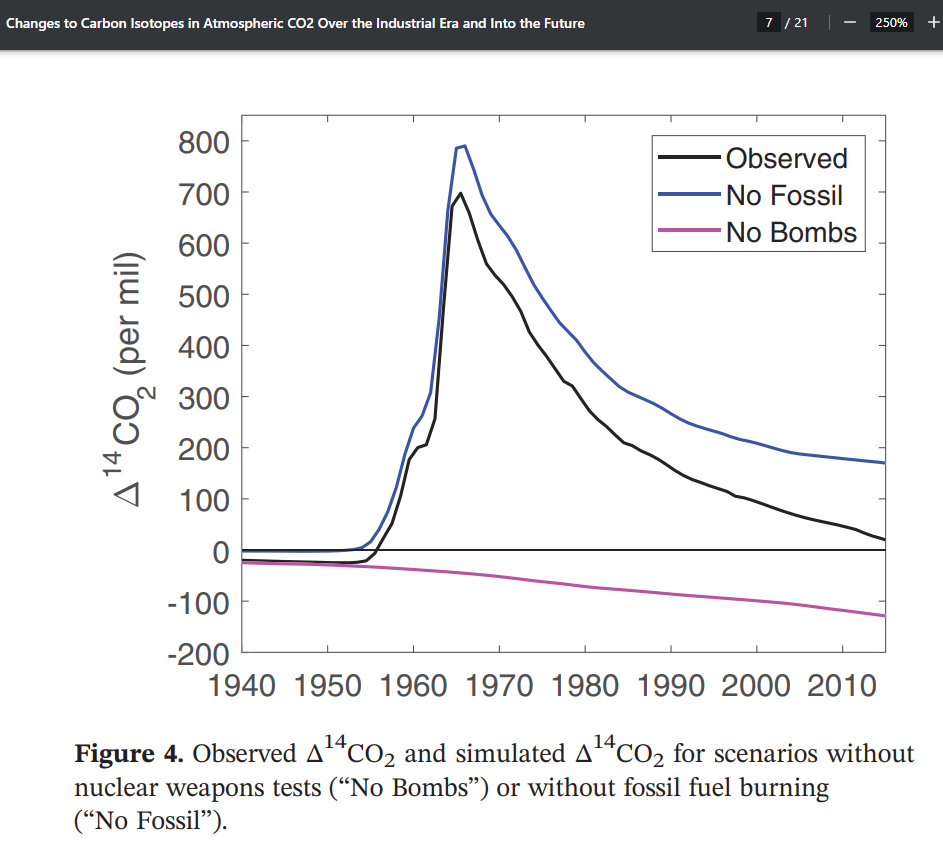
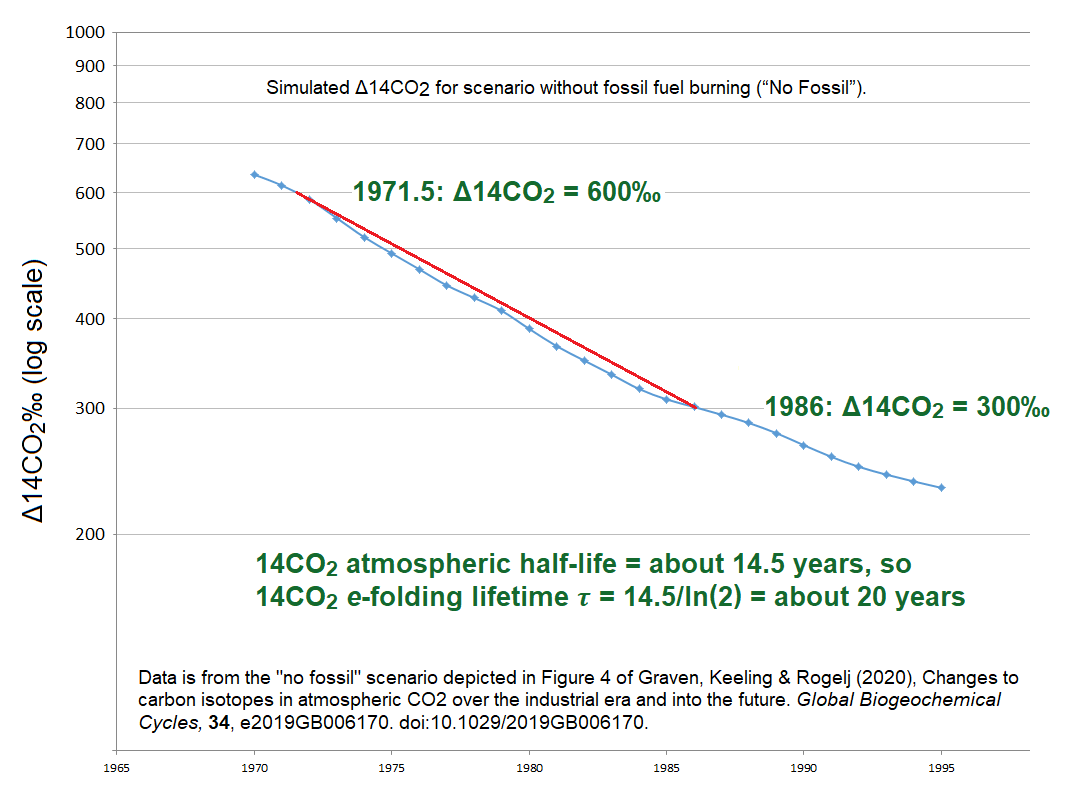
Additionally, the atmospheric CO2 level was by then rising by nearly 1 ppmv/year, due to human emissions, mostly from fossil fuels. The “fossil carbon” is depleted of 14C, so “Suess Effect” dilution also lowered Δ14C.
As a result of the combined effects of those two processes, the Δ14C bomb spike declined with a half-life of about 11 years. At first blush, that would appear to make the atmospheric lifetime 11/ln(2) = about 16 years.
However, increasing the amount of CO2 in the atmosphere (by burning fossil fuels) reduces Δ14C without actually removing 14C from the air, it only reduces the fraction of carbon which is in the form of 14C. To calculate the actual average atmospheric lifetime of 14C added to the atmosphere by the bomb spike, we need to consider, instead, what the Δ14C decay rate would have been, were it not for Suess Effect dilution from fossil fuel use. Graven (2020) conducted simulations with a simple carbon cycle model, and reported a striking difference between the calculated 14CO2 decay with and without fossil fuel CO2 supply, as shown in their Figure 4:
Dr. Graven graciously sent me their data, from which I constructed a log-linear plot:
However, that 14C atmospheric lifetime is much shorter than the “adjustment time,” which you can think of as the “effective residence time.” It’s the duration of the effect from adding CO2 to the atmosphere. The adjustment time is about 50 years.
The reason the adjustment time is longer than the bomb spike radiocarbon atmospheric lifetime is that most of the processes which reduce the amount of 14C in the atmosphere do so by exchanging it for other carbon, from other carbon reservoirs (mostly oceans and terrestrial biosphere & soils). That reduces Δ14C without reducing the total amount of carbon in the atmosphere. Those “exchange” processes contribute to the relatively short 20 year atmospheric lifetime of “bomb spike” radiocarbon, without contributing to the net removal of CO2 from the atmosphere.
That atmospheric lifespan of the CO2 we add to the atmosphere is determined by calculating the rate of natural CO2 removals and plotting it as a function of CO2 level. It turns out to be highly linear.
In fact, measurements show that the annual CO2 removal rate is about 2% of the elevation of CO2 above a baseline of about 295 ppmv. 1 / (0.02) = 50 years. That’s from this paper by Roy Spencer (and it is consistent with my own calculations, and those of Dick Lindzen, and many others):
https://www.opastpublishers.com/open-access-articles/enso-impact-on-the-declining-co2-sink-rate.pdf
Roy blogged about it here:
https://www.drroyspencer.com/2024/04/net-zero-co2-emissions-a-damaging-and-totally-unnecessary-goal/
A 50 year lifetime makes the half-life of added CO2 50×ln(2) = 35 years.
In other words, if humans suddenly stopped emitting CO2, then the CO2 level in the atmosphere would drop by a little over 60 ppmv (i.e., half of 423-295) in just 35 years.
Note: when I did plotted CO2 removal vs. CO2 level, ignoring ENSO effects, I found an x-intercept of 285 ppmv. Here’s the spreadsheet:
https://sealevel.info/Global_Carbon_Budget_2023v1.1_with_removal_rate.xlsx
(Note: the Y axis is in GtC (PgC). To convert to ppmv of CO2 divide by 2.1294.)
When Roy did a more refined analysis, taking into account ENSO, he found an x-intercept of 294 ppmv (see his paper). His earlier analysis, which he blogged about before writing his paper, found 295 ppmv.