From Dr. Roy Spencer’s Global Warming Blog
August 1st, 2024 by Roy W. Spencer, Ph. D.
The Version 6 global average lower tropospheric temperature (LT) anomaly for July, 2024 was +0.85 deg. C departure from the 1991-2020 mean, up from the June, 2024 anomaly of +0.80 deg. C.

The linear warming trend since January, 1979 now stands at +0.15 C/decade (+0.13 C/decade over the global-averaged oceans, and +0.21 C/decade over global-averaged land).
The following table lists various regional LT departures from the 30-year (1991-2020) average for the last 19 months (record highs are in red):
| YEAR | MO | GLOBE | NHEM. | SHEM. | TROPIC | USA48 | ARCTIC | AUST |
| 2023 | Jan | -0.04 | +0.05 | -0.13 | -0.38 | +0.12 | -0.12 | -0.50 |
| 2023 | Feb | +0.09 | +0.17 | +0.00 | -0.10 | +0.68 | -0.24 | -0.11 |
| 2023 | Mar | +0.20 | +0.24 | +0.17 | -0.13 | -1.43 | +0.17 | +0.40 |
| 2023 | Apr | +0.18 | +0.11 | +0.26 | -0.03 | -0.37 | +0.53 | +0.21 |
| 2023 | May | +0.37 | +0.30 | +0.44 | +0.40 | +0.57 | +0.66 | -0.09 |
| 2023 | June | +0.38 | +0.47 | +0.29 | +0.55 | -0.35 | +0.45 | +0.07 |
| 2023 | July | +0.64 | +0.73 | +0.56 | +0.88 | +0.53 | +0.91 | +1.44 |
| 2023 | Aug | +0.70 | +0.88 | +0.51 | +0.86 | +0.94 | +1.54 | +1.25 |
| 2023 | Sep | +0.90 | +0.94 | +0.86 | +0.93 | +0.40 | +1.13 | +1.17 |
| 2023 | Oct | +0.93 | +1.02 | +0.83 | +1.00 | +0.99 | +0.92 | +0.63 |
| 2023 | Nov | +0.91 | +1.01 | +0.82 | +1.03 | +0.65 | +1.16 | +0.42 |
| 2023 | Dec | +0.83 | +0.93 | +0.73 | +1.08 | +1.26 | +0.26 | +0.85 |
| 2024 | Jan | +0.86 | +1.06 | +0.66 | +1.27 | -0.05 | +0.40 | +1.18 |
| 2024 | Feb | +0.93 | +1.03 | +0.83 | +1.24 | +1.36 | +0.88 | +1.07 |
| 2024 | Mar | +0.95 | +1.02 | +0.88 | +1.35 | +0.23 | +1.10 | +1.29 |
| 2024 | Apr | +1.05 | +1.25 | +0.85 | +1.26 | +1.02 | +0.98 | +0.48 |
| 2024 | May | +0.90 | +0.98 | +0.83 | +1.31 | +0.38 | +0.38 | +0.45 |
| 2024 | June | +0.80 | +0.96 | +0.64 | +0.93 | +1.65 | +0.79 | +0.87 |
| 2024 | July | +0.85 | +1.02 | +0.68 | +1.06 | +0.77 | +0.67 | +0.01 |
The full UAH Global Temperature Report, along with the LT global gridpoint anomaly image for July, 2024, and a more detailed analysis by John Christy, should be available within the next several days here.
The monthly anomalies for various regions for the four deep layers we monitor from satellites will be available in the next several days:
Lower Troposphere:
http://vortex.nsstc.uah.edu/data/msu/v6.0/tlt/uahncdc_lt_6.0.txt
Mid-Troposphere:
http://vortex.nsstc.uah.edu/data/msu/v6.0/tmt/uahncdc_mt_6.0.txt
Tropopause:
http://vortex.nsstc.uah.edu/data/msu/v6.0/ttp/uahncdc_tp_6.0.txt
Lower Stratosphere:
http://vortex.nsstc.uah.edu/data/msu/v6.0/tls/uahncdc_ls_6.0.txt
Beating the previous record warmest July, which was last year’s.
When is the obvious going to sink in, guys?
Do you mean that this is obviously a very strong and protracted El Nino event?
Or the fact that you obviously have absolutely zero evidence of any human causation?
But El Nino has been over since May, my barky friend.
What do you think is causing the continued warming that is in line with scientific predictions based on CO2 concentrations?
Oh, the El Nino that’s already over.
Right.
Wrong as always… . the effect of the El Nino is still very much lingering
And as usual.. absolutely zero evidence from you of any human causation.
Another complete FAIL !
Well done demonstrating how much warmer the earth is now, then it was 8 years ago. A weaker El Niño has caused higher temperatures over a longer period, than the record breaking one in 2016.
Even to the mentally blind, it is obvious that the current El Nino effect is far stronger and longer lasting than the 2015/16 El Nino
Please don’t pretend that humans or human CO2 caused that.. You would make yourself look like a compete moron.
Still waiting for evidence of human causation.
Still just seeing mindless yapping.
Oh, and thanks for confirming my comment that this has been a strong El Nino event for energy into the atmosphere.
At least you aren’t DENYING the El Nino event.
Started earlier in the year
Atmospheric temps climbed quicker and further.
And are hanging about much longer.
Human or CO2 causation.. absolutely zero evidence of that.
As you and your AGW-zealot comrades keep showing everyone.
Nothing to do with CO2.
We are witnessing the improvement in technology.
The Stephenson Screen wasn’t invented until nearly 1900. It took at least 50 years until a sparse global network was available.
Satellites launched in the 70’s had their own problems.
And 70% of the planet is covered in water and there’s not a single Stephenson screen bobbing about on them.
And here you are, Catastrophizing over 1°C.
We don’t actually have any reliable way of estimating (roughly calculate or judge the value, number, quantity, or extent of) global temperature for any period of Earth’s history including the last 100 years.
It’s been a bit warmer for just over 100years, or so we think, but only warmer than we think it was in the centuries before. How much warmer we don’t really know on a global scale. We can’t even use proxies to compare today with a 100 years ago.
But we do know with absolute certainty the CO2 will kill us by 2030.
John McEnroe applies.
Again, this is based on a metric that fails to show *what* exactly is going up. We don’t know if maximum temps are going up, minimum temps are going up, or if a combination of the two is happening.
As Freeman Dyson always pointed out about climate science – it is not holistic at all. You can’t tell *anything* using the metrics climate science uses. Once you start averaging and averaging averages and then calculating anomalies from averages multiple layers away from reality then you have exactly zero knowledge of reality.
I’m not exactly sure where to drop this question, so your comment looked like as good a place as any. Not being a statistician, I’m not sure which term, confidence interval, margin of error, or whatever is appropriate for satallite data, but what is the appropriate confidence interval for the UAH data? For example, the post says, “July, 2024 was +0.85 deg. C.” But +0.85 deg. C +/- what?
The correct term is measurement uncertainty, which should be an estimate of the limits of knowledge for any measurement result. Uncertainty is expressed as an interval (such as T ± U), where the true value (which is unknowable) can be anywhere in the interval; the interval is a limit to what can be known about the result.
The UAH is a transformation of microwave radiance that the satellites measure into temperature. No formal analysis has been done that quantifies the uncertainty of this process, which would include all aspects of the satellite measurements, as well as the transformation to an “anomaly” (which is a fancy delta-T that uses many different averaging steps). Quoting these results to the second digit after the decimal cannot be justified.
Also, the UAH is not reported as absolute temperature, only anomalies. It is really just a proxy.
Microwave radiance is *very* dependent on the intervening media between the source and the receiver – as anyone who has ever designed a microwave radio system can ascertain. This means that clouds and water vapor become an important factor. If clouds and water vapor in the atmosphere are less in a UAH pass then the prior one then it will appear that the temperature has gone up. UAH has no way of quantifying this effect for each measurement, they just “assume” an adjustment factor. That assumption generates even *more* measurement uncertainty into the total, not less.
That the UAH and RSS calculate different numbers from the same data should be a clue.
What would the UAH plots and graphs look like if the numbers were rounded to 1-degree?
UAH and RSS use different data. That’s why RSS gives a higher reading.
The margin of error for UAH data is +/- 0.1C or +/- 0.2C, depending on who you listen to.
UAH data and Weather Balloon data correlate very well.
RSS doesn’t use the NOAA satellites? Which satellites do they use?
Margin of error is not measurement uncertainty.
Roy Spencer determined at one time that one of the microwave transponders he was using was not operating properly, according to Dr. Spencer, so UAH stopped using this particular sensor.
RSS still uses the questionable sensor, or at least, they did at the time. I believe the other data collectors like NOAA and NASA also used the data from this questionable sensor. I don’t know if they are still doing so.
This was only one satellite from among the 20-odd that have flown since 1978. The point is that, right or wrong, RSS has a different translation from radiance to temperature.
Thanks for the response. I think this is important but often gets overlooked or neglected, or just misunderstood. I wish the few here who copy and paste graphs and claim the apocalypse is just around the corner because this July might be a few hundredths of a (modeled) degree warmer than last July (or whatever).
Climate science in general has very little understanding or appreciation for the subject, to the point of confusing error and uncertainty. Error is defined as the difference between a measurement and its true value, but because the true value is unknowable, error is of little use.
They also have no appreciation for the magnitude of uncertainty typical for temperature measurements, so they can’t see that reporting “error bars” as small as 10-20mK is absurd.
The human CO2 warming story causing El Nino events, is your fantasy.
You are the one that has to present evidence. (and continue to fail completely)
Models are not evidence of anything.
If you knew even the remotest bit of science, you would know that.
Noe one is saying humans are causing El Nino, we are saying humans are causing the underlying warming trend that is causing El Ninos to get warmer and warmer and warmer over time.
You are arguing that the oceans are getting warmer because there is increasing CO2 in the atmosphere, which does not warm the atmosphere until the warmer oceans release the heat into the atmosphere during El Nino events. The absurdity of that argument is off the charts.
The oceans cannot be warmed by a warming atmosphere if the atmosphere is not warming. Clearly, something other than increasing atmospheric CO2 is warming the oceans. The increased seismic activity, particularly along the ocean riffs over the last 30 years, is the most likely culprit, and would explain why the atmosphere is primarily warming only during El Nino events.
Manmade CO2 emissions don’t explain any weather observations, other than the more temperate readings that come with the observed ‘greening’ of many arid areas.
Also, the Solar Output has been the highest in the last 100 years of any 100 year period during the last 400 year and the oceans can store up heat for 100+ years..
https://lasp.colorado.edu/lisird/data/historical_tsi
You are chronically mal-informed as always.
There is no underlying warming trend.
When you remove the effect of the major El Nino transients and step change…
… there is basically no warming at all.
Oceanic COOLING. When this is over – and it may be some time, the ”GAT” will drop like a stone. There can be no doubt about this because such a steep rise can in no way be attributed to co2. What will you say then?
“What do you think is causing the continued warming that is in line with scientific predictions based on CO2 concentrations?”
The atmosphere doesn’t heat the oceans, the oceans heat the atmosphere, and right now geothermal is heating the oceans more than usual from beneath. And the CO2 levels are mostly based on ocean water temperatures. Somehow you have it backwards.
The funny thing is, people that have it backwards have no reverse gear, so they can only go in one direction.
@barky friend’? Do I detect a desperate insult because you are wrong? I think so.
It need not have much relationship to the latest EL Nino in order to be something other than CO2. The best evidence says higher temperatures have existed various times during the Holocene without any CO2 increases. There could be another 100 years or more of warming still coming that humans cannot influence in any large scale way.
You can cool your house with adequate power. Local, perhaps regional cooling can be induced with proper landscape changes but global is likely well outside human control, either raising or lowering. It has happened many times before.
Don’t forget that we don’t know *what* higher temps are causing the mid-range temps to go up. If it is higher minimum temps then that is a GOOD THING. Longer growing seasons, more food, fewer deaths, etc.
The UAH metric tells us nothing about what is happening in reality. It is just a metric that is itself an average. Once you start averaging you lose information.
Global temperature is utterly meaningless. When is THAT going to sink in??
As for record heat, it’s been unseasonably cool in my neck of the woods. This average is bogus.
So why this post? WUWT posts Roy’s UAH global every month/
Good question Nick.
I reckon it provides a forum for all the “global average temperature” afficionados to argue about poofteenths of claimed changes in a numeric construct / conjecture whose probity and provenance of inputs is inarguably so corrupted as to be risible.
Shall we have a back ‘n forth about this reality?
I think Roy’s maps are quite interesting,
You can clearly see the El Nino starting to form in May 2023, then the energy released spreading quickly around the tropics and out from the tropics.
Always seems to be a warm pool over central South America, but other places seem to be in flux, probably from the jet stream wobbles.
As the “Tropics” in Roy’s data is some 34% of the globe, this has a large effect on the global calculation.
Over April, May, June, 2024 the darker orange has disappeared over the ENSO region. Is that a sign the effect of the El Nino is fading ??
Will be interesting to see what the July map looks like.
Keep in mind that the NOAA satellites do not sample the global uniformly, not even close. They cannot detect daily min-max Ts, except for the polar regions; no data is reported higher that 85° latitude because the satellite spots overlap. At 30°, it can be as many as three days between samplings of any given grid location. Using a fixed latitude-longitude in degrees means there is an order-of-magnitude difference in the area of the grid squares between the equator and the poles.
These little details never show up in the fancy color maps.
The also backfill the data between the satellite readings which are a mere stripe compared to 25 km.
Given simple spherical geometry there is no way a sensor array of a few centimeters or even a few meters can measure the electromagnetic energy radiated from a 25 km square.
The satellite is no where near 25 km is length or width even if the solar arrays were included.
“higher that 85° latitude”
Actually the area not capture above 85ºN and below 85ºS is only about 0.4% of the global area.
True, but it is a result of the nonuniform sampling.
A fair question.
I wonder what the 30 year moving average looks like.
You don’t have to wonder. Just download he UAH data and work it out for yourself.
This isn’t hard.
Not very interesting, but here you go.
Gotta use those El Ninos for all you are worth
They are all you have. !
Evidence of human causation of those El Ninos.
Still totally lacking.
What do El Niños have to do with a 30 year average? Do you really think that the heat released by an El Niño just hangs around on the surface, rather than disappearing into space?
Thanks for highlighting your ignorance of El Ninos.
We expect nothing more.
Bod Tisdale shows that they cause a step up in ocean surface temperatures, which of course drive atmospheric temperatures.
Try not to let your ignorance confuse you.
Now.. where is your evidence of human causation of those El Ninos.
Running around like a headless chook isn’t evidence.
El Ninos occur on average every 5 to 8 years. They obviously raise atmospheric temperatures over large areas of the globe. This seems to be reasonably explained by the moving water releasing the Pacific Warm Pool accumulated heat over a large area of the ocean, heat which then vents into the atmosphere.
Having the atmosphere temperature remain warmer for so many years after the event seems a bit more difficult to explain. How is that heat being retained, by what mechanism such that there is a slow but steady atmospheric warming over enough of the planet for the calculated average to keep going up (as UAH has). If the warm pool heat is being distributed, as evidence seems to conclude, why has that energy not radiated away to space well before the next El Nino?
“slow but steady atmospheric warming”
Except there isn’t. Not remotely “steady”.
Just transient and step at major El Nino events
There is basically no warming at all between major El Nino events.
In fact, you can see that the 2015/16 event and 2023/24 event started at basically the same atmospheric temperature.
Why the current one is hanging around so long, we can only speculate.
No evidence of anything humans have done, that is for sure.
You are missing the point. Whether you want to call it steady based on the trend from beginning of data to today or step wise with each El Nino, while there has always been a somewhat large drop after each event – before the current one – there is always a rebound to a somewhat higher average temperature than before the El Nino. The temperature keeps going up over time.
Maybe that increase is due to the El Nino, but if 5 or more years pass until the next El Nino, why doesn’t the temperature drop all the way to the original baseline during that interval so there is no long term increase?
Either something other El Nino events is raising the temperature or something is preventing a complete temperature drop after each El Nino event.
The earth itself is a huge heat sink. Both water AND land. It takes a long time for those heat sinks to gradually lose heat into the atmosphere where it can be radiated away. ENSO is just a peak in the temp of the heat sinks.
Growing seasons are expanding over much of the earth, indicating that minimum soil temps are higher than they used to be thus causing earlier last frost and later first frost dates. That’s an indication that the heat sink represented by land is still in a transition period of losing heat.
“Either something other El Nino events is raising the temperature or something is preventing a complete temperature drop after each El Nino event.”
This is the *big* question that climate science studiously avoids trying to answer. Ask yourself why?
El Ninos are not the only thing that influences temperature. Orbital mechanics, for example, tilt of the planet is not a constant nor is the speed of global rotation. While these all are dismissed as trivial, they might just add up. The science is not settled.
Everybody seems to say that the Hunga Tonga eruption has little if any effect on global warming (this may not be a completely accurate assertion), but it seems to have been such a unique and uniquely large event that it wouldn’t surprise me if the overall effects are not understood as well as some would like to think, yet many are Jumping to the conclusion that the effects are minimal and dismissing it out of hand. That’s convenient for the warmists in the short-term but I think it might eventually be shown that the effects were much larger than thought.
NASA says it does. The duration of the effects will be 5 years from the eruption, perhaps longer, but with effects diminishing with time.
Not everything transfers as fast as EM energy (speed of light).
Some things are slower, like 60 mph wind at the surface during a storm and everything has a unique specific heat, heat capacity, and heat latency.
Water in the Pacific takes a while to move to other regions. Water is a huge “heat sink.” Thermal energy in the oceans have an estimate latency (life) in decades.
Wonder what it looks like for the period before this? Just curious question. I’m not going to do it and not asking you to do it. Just wonder if it looks like a similar continuation.
A moving average of a meaningless average is still meaningless.
You’re welcome to your opinion. Jeff. The scientific community laughs at you, but you carry on.
You wouldn’t have a clue what the science community does or thinks.
Science works on evidence.
We are still waiting for you evidence of human causation.
Empty, empty empty is all we get.
The community of compassionate, caring people weeps at you.
Global heat deaths may go up a tick, global cold deaths should go down substantially, and you think fewer deaths is the “final nail in the coffin”?
What kind of ghoul are you?
Also giving tacit support to the CLIMATE SCAM and AGENDA that is trying to destroy western civilisation, that I assume it is part of.
Disgusting really !
So tell us more on intrinsic qualities. 😉
Or intensive…
ToeFungalNail lacks the intellect to understand the fundamental difference between extensive and intensive variables.
Actually the scientific community agrees. It is the highly politicized, agenda driven, climate syndicate that disagrees.
Unfortunately most scientists how have a rational world view are silenced by the syndicate through various means, such as grant denial, black listing, publication denial, and ad hominem attacks.
Don’t feed the troll!
For lurkers: this user primarily just thread-bombs and provokes other participants, without contributing anything meaningful to the discussion.
Replies are mainly attempts to highlight how misinformed TFN is and to demonstrate that engaging with him/her is a waste of time.
Indeed. And perpetuated by a steady stream of responders who continue to feel the need to post comments on his posts, knowing full well that it feeds back and aggrevates the issue. Do those responders really think their ego is more important than the general public hoping for an informed range of views? It seems so. I get fed up just scrolling past the comments to get to the more interesting bits. Those commenters are just part of the problem as far as i am concerned..
What is important is for readers to see just how wrong-minded fungal’s comments are.
Sorry that you feel their inherent wrongness shouldn’t be corrected
What about rest of the trendology clown show? Fungal is hardly a lone wolf.
The difference is that TFN posts primarily to provoke. It’s a good idea to start disengaging, no?
Typically I just push the red button and scroll, he’s not worth the effort.
How rude!
I think it is quite meaningful to point out that the world just had its warmest July (warmest month, indeed) in the UAH record and that this immediately followed on from the previous July, which set the previous record.
This site is supposed to be about climate, right?
“How rude!”
But totally true.
“this user primarily just thread-bombs and provokes other participants, without contributing anything meaningful to the discussion.”
A totally correct description of your small-minded comments.
You are not talking about “climate , you are making pitiful comments about natural weather events, and are too dumb to know the difference.
Now, where’s that evidence of human causation??
What exactly does “warmest month” mean? Highest maximum temps? Highest minimum temps?
UAH is just an average and therefore has lost information crucial to establish exactly what is happening.
It could very well be an indicator that climate is IMPROVING, not getting worse!
“I think it is quite meaningful to point out that the world just had its warmest July (warmest month, indeed) in the UAH record and that this immediately followed on from the previous July, which set the previous record.”
Perhaps some places have, and others haven’t. That doesn’t make a global average meaningful. It gives the false impression of homogeneity.
“It gives the false impression of homogeneity.”
100%.
Far too many climate scientists think that temperatures at two locations are correlated because temperature is an extensive property. It’s a spurious correlation at best. The correlation is actually to the tilt of the earth (i.e. seaons) and the rotation of the earth.
Climate science thinks that since temps get warmer on the east side of the Rockies as well as on the west side that the temps are correlated because there is some homogeneity of temperature between them. The connection is *not* related to temperature.
Even the anomalies won’t be correlated since the absolute temps aren’t.
Thank you. I usually post that, but forgot. Don’t feed the trolls.
We do not want or need flame wars in our discussions.
The obvious already has sunk in…..long ago. You are an oaf.
Obviously that spike last NH summer had nothing to do with man made CO2. Earth cooled for more than seven years under steadily rising plant food in the air from 2/2016.
Just as average T went sideways from 1998 to 2015, and fell alarmingly from 1945-77, all with essential trace gas increase.
‘When is the obvious going to sink in, guys?’
How closely correlated are the rise in temperature and the cuts in CO2 emissions by Britain?
How closely correlated are the rise in temperature and the increase in solar and wind power by Britain?
It is like all these Net Zero actions by Western countries have had absolutely no effect whatever!
Which, of course, is not what the science says…
1.
Humans are a Tropical animal, that’s why we don’t have fur to keep us warm.
Warmest during a long-term 2+million-year ice age named the Quaternary(glaciation) isn’t saying very much.
90 percent of the fresh water is locked away in glaciers and ice caps.
Outside of the Tropics everybody that can lives and works in heated buildings, uses heated transportation and own warm clothes.
The real-time temperature of the of the Earth on the WUWT page on the right is 58 F / 14.5 C.
That’s too cold for humans in few clothes to live in for very long, they will die of hypothermia in a few days.
Humans are a Tropical animal, that’s why we don’t have fur to keep us warm.
2.
The cost is astronomical, Bloomberg estimates $US200 trillion to stop warming by 2050. There are about 2 billion households in the world and 90 percent of them can’t afford anything extra. So that is $1 million per household.
That’s ridiculous. Almost all those households would prefer a million in the bank and a degree or two of warming.
3.
The Solar Irradiance the Earth has received has been the highest over the last 100 years of any hundred years for the last 400 years. https://lasp.colorado.edu/lisird/data/nrl2_tsi_P1Y
This extra heat gets stored in the oceans and has been added to continuously for the past 100 years. When the oceans warm less CO2 can dissolve in them, like beer.
That makes the oceans unable to absorb as much CO2 and makes the oceans release some of its dissolved CO2 into the atmosphere. increasing the CO2 in the atmosphere.
When human reduced their output of CO2 by 5.4 percent in 2020 due to the COVID-19 pandemic the increases in CO2 didn’t change a bit.
‘Emission Reductions From Pandemic Had Unexpected Effects on Atmosphere’
https://www.jpl.nasa.gov/news/emission-reductions-from-pandemic-had-unexpected-effects-on-atmosphere
‘Temporary reduction in daily global CO2 emissions during the COVID-19 forced confinement’
https://www.nature.com/articles/s41558-020-0797-x
‘Trends in CO2, CH4, N2O, SF6’
https://www.co2.earth/monthly-co2
The models the IPCC uses don’t include the Sun’s variability, the clouds which reflect up to 30 percent of the sunlight, or the oceans heat storage.
Some excellent points.
That there is no associated crisis?
This sank in already thanks! 🙂
Well, the warming is evident.
Whether it is natural, I strongly doubt.
It is anthropogenic for sure.
The central question is – what is the mechanism.
Certainly, it is not CO2. Don’t be silly.
But what?
Urbanisation, agriculture, wind farms – anything can be the cause, and there is no research whatsoever.
This is what makes me scary: the total lack of climate science (other than the plain propaganda).
You hit the nail on the head! If climate science was TRULY interested in climate they would change from using averages of averages of temperatures and start using enthalpy or even degree-days as agriculture science does. Temperature is a poor, poor proxy for climate, especially when it is used to generate mid-range temps for use in calculating more averages. Mid-range temps can’t tell you ANYTHING about climate. They can’t tell you that the climate in Las Vega is different than climate in Miami or in Ramona, CA.
Or Las Vegas NV versus Las Vegas NM.
Humans obviously have an impact on the planet. Population, roads, parking lots, buildings, deforestation, agriculture, pollution (real pollution), and a whole long list of things. Some affect ecology, some affect weather. Certainly production of electricity injects thermal energy into the system. Not as much as the sun, obviously, but it is also non-trivial.
We are in a warming cycle and those cycles are natural. Humans have added a touch to that.
The real point is, this whole science should not and never be about temperature. It is an energy system. Until it is addressed that way, we will never get the right level of understanding. Of course that is a difficult quest given the complexities and dynamics and the nature of this chaotic system.
None of these will have any significant effect on the “global” climate.
July was cold where I am – if it’s ‘global’ warming shouldn’t my bit of the globe have been ‘warmest’ too?
No. “Global warming” is in reference to the increase in the global average temperature; not the homogeneity of the temperature.
A meaningless quantity that tells nothing about “the climate”.
If it’s not global…
Throw up graph, play Chicken-Little. You seem to think it means something when it absolutely doesn’t.
When will it sink in? When the predicted disasters happen once the 1.5C “limit” is breached: the collapse of the ice caps, massive flooding of coastal cities, tens of millions of climate refugees, the end of snow, etc.
I’m still waiting, but I’m not standing on one leg.
50 years and counting. A long time to stand on one leg.
You obviously do not know. We are currently under the effects of the greatest solar storm in 20 years while at a grand solar maximum all of which adds to the lingering effects of El Nino and Tunga (and other volcanic activity).
So, CO2 is the “control knob?” Tell me another fairy tale, daddy.
If I’m not mistaken this is the average of Tmax &Tmin. Tmax is the important measure of warmest.
It’s almost as if it were mid-summer in the Northern Hemisphere, eh Rusty?
Yet more global temperature nonsense.
As an intrinsic property there is no “distribution of temperatures” that generate statistical descriptors that are useful.
The temperature in Berryton, KS doesn’t “cause” the temperature in Holton, KS (less than 100 miles apart) or vice versa. There is no guarantee that you can even find an “average” temperature at some location between them since one is on the south side of the Kansas River valley and the other is on the north side of the valley. Temperature is a *result* of lots of inputs, including pressure, humidity, wind, terrain, geography, etc. There is nothing that says those inputs are the same even 10 miles apart on the surface of the earth.
If the “average” of the temps in Berryton and Holton is meaningless then just how useful is an average temperature of Berryton, Holton, and Pikes Peak or someplace in Brazil?
Climate science likes to play the “numbers is numbers” game. Therefore you can average any kind of numbers. But they can’t tell you what the numbers mean for those of us living in reality land.
“There is nothing that says those inputs are the same even 10 miles apart on the surface of the earth.”
Indeed. I’ve seen a temp difference of as much as 27F between two locations only 13 miles apart.
Yet another record month, beating previous record 2023 July by 0.2C.
Where you surprised by this, Nick?
I was expecting it to fall back a bit,
Yes, so did I, but I think UAH is noisy.
It seems likely that a change of +/- 0.05C is beyond actual measurement ability
Of course it is. The MEASUREMENT uncertainty is in at least the units digit. But climate science always assumes that measurement uncertainty is random, Gaussian, and cancels. They then use the sampling error for the measurement error and you can reduce sampling error by increasing the number of observations in the sample. It’s all smoke and mirrors.
Scientific precision is not an Excel number.
1 x 1 = 1, not 1.0
1.0 x 1.0 = 1.0, not 1.00.
Learned this in middle school. One has to be worried about what they teach today.
Yes previously it’s dropped and could still do so in the coming months. Any evidence the planet is worse off for the warming though? There are many metrics that continue to improve.
The effect of the EL Nino seems to want to just keep on hanging in there, doesn’t it. !
Please don’t try to pretend it was caused by humans or by CO2
That would be incredibly stupid, even for you.
Do you have any insight to answer my question, posted a little above here, about the fairly steady long term raise in UAH? No hand waving, please.
Solar energy seems the logical culprit.
30 year running average remains high and absorbed solar energy has continued to increase.
Mainstream science explains the decrease in albedo due to anthropogenic factors using models. However, this can never be validated or falsified with direct evidence because the initial decrease in long-wave radiation apparently occurred over a century ago.
It’s a form of ideology: they don’t want to study any natural alternatives. To truly understand any possible human-caused climate change, you need to grasp natural climate change first.
The correlation with UAH looks pretty solid. Any chance you could put them on the same graph?
Don’t have the actual data, but someone did it with HadCrut.
But of course you have to adjust the scales so you can really only compare the pattern.
That is a not unreasonable hypothesis. Gathering enough accurate data to be able to declare it unequivocally is the sticking point.
Hard to do with averages of averages and estimates.
Why? I thought it was ”obvious”
No, there is always a surge during El Nino, especially in the lower troposphere data.
But El Nino is over; lower temps would be expected.
No, the effect of the El Nino IS NOT OVER.
Clearly evident in the atmospheric data.
Still DENYING the El Nino event. (usually you used a pretty finger painting to show it)
Its all you have.
And you all know that.
You KNOW you have zero evidence of human causation.
Here is the stacked graph, showing the continuation of record months:
Thanks you Nick..
Day wouldn’t be complete without one of your juvenile finger paintings. 🙂
But thanks for showing just how strong the effect of the El Nino has been. !
Doing well 🙂
Oh and thanks for backing me up with the “no evidence of human causation” thing.
By not posting any evidence.
Very helpful that even the grate Nick cannot find any. 🙂
Does this have anything to do with Britain cutting back on CO2 emissions? Are we Brits to blame? Should we be using more CO2 as our cutbacks seem to be making things much, much worse.
No, absolutely nothing the Brits have done would have had any measurable effect on global CO2 emissions.
Their CO2 contribution is too insignificant to matter.
But they still want to destroy their own country. !
Yes. The cutbacks are making things much, much worse.
Thanks for that helpful illustration Nick, though it’s a pity that it seems to be beyond the comprehension of the same person each month. Although I’m getting the idea it’s only an experimental bot designed to increase site traffic, with only 2 algorithms –
Nobody cares.
The HTe is now having an increased warming effect. I base this on the 146 hPa water vapor data. Especially in the Southern Hemisphere.
This particular altitude is at a critical point for the greenhouse effect.
The graph shows that H2O increased by maybe 1 ppm at 150 mb. Do you think 1 ppm of H2O caused 0.6 C of warming?
Homey, when you see -1 PPM on a graph (WTF), that means it is a relative guess. Get a flask up there and take measurements and calibrate before you pound the table on a proxy.
Do you think the QBO graph Richard M is wrong? If so do you know by how much the graph is wrong?
No monkey, that comes from the strong solar powered El Nino.
Probably slows the rate of energy outflow though.
At this altitude that is a lot of extra water vapor.
You think 1 ppm of H2O at 150mb is a lot?
You think 1 ppm of H2O is enough to cause 0.6 C of warming?
It’s about 100% increase.
Relatively speaking 1ppm is about 100% above the normal so a significant change.
The graph includes the annual cycle which has a range of about 2 ppm. The normal value in the stratosphere is about 5-10 ppm which means 1 ppm is 10-20% above normal. In terms of the whole atmosphere the normal value is about 2500 ppm which means 1 ppm would be 0.04%. That’s not say that water vapor in the stratosphere doesn’t have a bigger effect than that in the troposphere.
A quick summary. This is the 13th month in a row to be a monthly record. This July is 0.21°C warmer than July 2023, which itself was record breaking. As July is the warmest month globally, this also means this has been the warmest month recorded by UAH.
Here’s a graph showing just the July anomalies.
For nostalgia, here’s how Dr Spencer reported July 2023
…
https://www.drroyspencer.com/2023/08/uah-global-temperature-update-for-july-2023-0-64-deg-c/
Here’s even better nostalgia:
Why Blaming Recent Warming on Humans is Largely a Matter of Faith
“ALL temperature change in any system is due to an imbalance between the rates of energy gain and energy lost. In the case of the climate system, it is believed the Earth each year absorbs a global average of about 240 Watts per sq. meter of solar energy, and emits about the same amount of infrared energy back to outer space.
If we are to believe the last ~15 years of Argo float measurements of the ocean (to 2000 m depth), there has been a slight warming equivalent to an imbalance of 1 Watt per sq. meter, suggesting a very slight imbalance in those energy flows.
One watt per sq. meter.
That tiny imbalance can be compared to the 5 to 10 Watt per sq. meter uncertainty in the ~240 Watt per sq. meter average flows in and out of the climate system. We do not know those flows that accurately. Our satellite measurement systems do not have that level of absolute accuracy.
Global energy balance diagrams you have seen have the numbers massaged based upon the assumption all of the imbalance is due to humans.
I repeat: NONE of the natural, global-average energy flows in the climate system are known to better than about 5-10 Watts per sq. meter…compared to the ocean warming-based imbalance of 1 Watt per sq. meter.
What this means is that recent warming could be mostly natural…and we would never know it.
But, climate scientists simply assume that the climate system has been in perfect, long-term harmonious balance, if not for humans. This is a pervasive, quasi-religious assumption of the Earth science community for as long as I can remember.
But this position is largely an anthropocentric statement of faith.”
That doesn’t make it wrong. It’s just…uncertain.
Unfortunately, that uncertainty is never conveyed to the public or to policymakers.”
Climate “Science” is unique in that the purported effects are smaller in magnitude than the experimental errors.
Climate science just assumes that all experimental errors are random, Gaussian, and cancel. Of course they *NEVER* offer any justification for that assumption. They just say “it’s just how it works”.
I wish I could upding you a lot more. I think the uncertainty thing is extremely important and is the one thing that gets conveniently ignored by the “the Squad” (we know who they are). as Graemethecat ponts out, the supposed apocalyptic (my embelishment) effects are smaller in magnitude than measurement errors.
The earth system is never in equilibrium.
An opinion comment.
Again, with absolutely no evidence of human causation.
Well yes,it’s Dr Spencer expressing his opinion, on his own website.
So not evidence of anything.. Ok
You seem to be very short of any sort of evidence of anything , don’t you, little muppet
Oh, don’t you know that if allowed to be published it must be completely truthful and 100% accurate, otherwise it can’t be published.
SMH
On, and /s
Me quoting Dr Spencer in no way constitutes an endorsement of his views.
I quoting Dr Spencer on July 2023
It’s evidence about what he thought a year ago.
It has nothing to do with your demands that everything be about evidence about CO2’s role in global warming.
Admitting yet again you have zero evidence of human causation.
Look at you running around like a headless chook.
So funny !
Just keep lying.
Yes. But we have to remember that we only have global average temperatures ( whatever that means) since satellites were intriduced in the late 1970s. Interestingly enough after the 40 year mainly flat curve. So we know temperatures have gone up since the satellites were introduced and standards were streamlined. The Spencer graph is very useful and nothing anybody in his right mind would propose as alarming. Unless that is yr endgoal.
It does in any case not reflect the role of Co2 at all. That is just an attachment some people seem to have. But even IF introduced it clearly shows decoupling, not causation w a role for El Ninos.
The data says you cannot eliminate either CO2 or ENSO as contributing factors.
That is your curve-fitting exercise, not science.
I tested the hypothesis…a model incorporating CO2 or ENSO has no correlation with UAH TLT anomalies. The result of the test is that the hypothesis is false as can be shown with model I present above. Hypothesis testing is one of the core tenants of science.
BTW…don’t hear what I didn’t say. I didn’t the say model I present above is the be-all-end-all that explains all UAH TLT changes. I didn’t say the model proves CO2 or ENSO is the cause of warming. I didn’t say the model is perfect. I didn’t say it is the best model. There are a lot of things I didn’t say here that some may try to pin on me anyway. Like I always say…for those who want to make up strawman arguments just understand that you and you alone own them and I have no obligation or intent to defend them especially when they are absurd.
A totally irrelevant and mindless model, absolutely unrepresentative of anything but your ignorance and stupidiity.
roflmao.. a baseless conjecture driven child’s model ignoring all the real drivers of climate
A TOTAL JOKE !!
I’m surprised that temperatures are still so high in the Troposphere. Given the early start to the rise in temperatures compared with the El Niño cycle, I had thought they might cool down sooner.
I am still tending to agree with Prof Mann that this is probably just an El Niño on top of the steady warming trend, but we’ll have to see how much it cools down as we head into the next La Niña.
It will be interesting to see what surface data looks like this month.
Agreeing with Mickey Mann… not a good look… make you look like a charlatan.
Surface data is to contaminated by urban, airports and bad sites to have any meaning.
But you know that already.
“Prof Mann” … heheheheheheh
Yet you keep agreeing with Mann that this spike is all down to the El Niño.
As is all warming in the satellite record.
You keep showing that.
El Ninos.. no human causation.
You continue to keep proving that there is no “A” in
AGWSo easily triggered.
Mr 2000: it’s all the El Niño – why you deny that?
Me: I’m inclined to agree with Mann that this is all to do with the El Niño.
Mr 2000: Oh so now you agree with Mann that it’s connected to the El Niño – you am an idiot.
And after several totally empty comments from the bellboy.
Still no evidence of any human causation.
Michael Mann is a fraud. I would laugh so hard if he gets a life sentence for his crimes.
“A disgrace to the profession…”
For new readers bnice2000’s entire Spiel is to demand everyone provides him with evidence that CO2 causes warming. He then insists that he’s never seen any evidence, which is not surprising as he is determined to reject any and all evidence.
He has never seen evidence. All he has been given is statistical curve-fitting.
Statistics are evidence.
His claim is all the warming is caused by El Niños, but the only evidence he provides is “it’s obvious just look at the graph”. Statistical curve fitting shows it’s possible to explain his step changes using nothing but temperatures rising in line with increasing CO2 modified by temporary ENSO effects. No need for inexplicable step changes each time there’s an El Niño.
Statistics are *NOT* evidence. Statistical descriptors are tools used in understanding the evidence. You may as well say a ruler is evidence. It isn’t. You may as well say a voltmeter is evidence. It isn’t. They are tools used to understand the real world.
Curve fitting is meaningless by itself. It does *NOT* explain step changes at all.
“ Statistical curve fitting shows it’s possible to explain his step changes using nothing but temperatures rising in line with increasing CO2″
You are back to claiming correlation is causation even though you adamantly deny you believe that. It’s like you adamantly denying that you believe all measurement uncertainty is random, Gaussian, and cancels. The problem is that you continually display both memes in everything you say.
“You are back to claiming correlation is causation even though you adamantly deny you believe that. “
Just keep on lying. It just demonstrates you can’t make an arguments without resorting to ad hominems.
“Statistical descriptors are tools used in understanding the evidence.”
Word games. Say in this case your “evidence” is a set of temperature data. Just drawing random lines on it and saying it looks Iike the Niños are causing step changes, is very weak evidence unless you can demonstrate that this couldn’t just happen by chance.
“Curve fitting is meaningless by itself. It does *NOT* explain step changes at all.”
I’m not trying to explain the step changes. I don’t believe they are real. I’m asking for an explanation as to how an El Niño spike could actually make the world permanently warmer, and how you would determine that your own curve fitting exercise is a better fit than mine.
in the mean time I’m just pointing out how continuous warming from CO2 and temporary spikes and troughs from ENSO can give the illusion of step changes. None of this proves that there is continuous warming let alone if it comes from CO2. Correlation does not necessarily imply causation. It’s just a hint.
“ust keep on lying. It just demonstrates you can’t make an arguments without resorting to ad hominems.”
The truth is no an ad hominem. You continue to refuse to admit that correlation between A and B works both ways. Does A cause B or B cause A? You continue to post about CO2 and temperature being correlated and imply that CO2 causes temperature.
“Say in this case your “evidence” is a set of temperature data. Just drawing random lines on it and saying it looks Iike the Niños are causing step changes, is very weak evidence unless you can demonstrate that this couldn’t just happen by chance.”
In this case you are at least comparing apples and apples, not apples and oranges. First off step changes are not very common in nature. Even a square wave generator doesn’t actually generate a step change, that’s just not the way it works. So, if you take away the El Nino’s then what *does* cause step changes in the temperature? Those step changes seem to happen pretty regularly and so do the El Nino’s so “chance” isn’t a very good explanation for the correlation.
“I don’t believe they are real. I’m asking for an explanation as to how an El Niño spike could actually make the world permanently warmer,”
What is your definition of “permanently warmer”. The “average” temp going up is a statistical descriptor. What is it a statistical descriptor *OF*? Minimum temps going up? Maximum temps going up? Both going up? How does the ocean maximum temp go up with step changes since it seems to have a physical limit on max temp?
“It’s just a hint.”
It’s not even a hint! Again, you can’t tell if A causes B or B causes A. You keep denying that you believe correlation is causation but then you *always* come back to implying that CO2 causes temperature because of the correlation.
It’s exactly like you denying that you believe measurement uncertainty is random, Gaussian, and cancels. Except you *always* wind up invoking that meme in every assertion you make. This cancellation meme and the CO2 causes temp rise meme are so embedded in you psyche that you can’t get away from them let alone recognize when you are invoking them.
“The truth is no an ad hominem. “
Wrong. Something can be true and also an ad hom. It’s just in your case it’s a lie. I’m fact a straw man as well as an ad hom.
“You continue to refuse to admit that correlation between A and B works both ways.”
One reason why correlation does not imply causation is because the causation might be the reverse, correct. Why keep lying that I refuse to admit it? It’s something that has to be considered in the case of the correlation between CO2 and temperatures, especially considering that changing temperatures are expected to change CO2 levels.
But having considered it, I think it’s very unlikely that this is the main thing seen in recent years. I think there are multiple reasons why it is unlikely that rising temperatures are the main reason why CO2 has increased.
“You continue to post about CO2 and temperature being correlated and imply that CO2 causes temperature.”
I don’t just imply it. I’ll state it clearly that in my opinion it’s most likely that rising CO2 levels are responsible for most if not all of the rising temperatures. But I do not say that based on a simple correlation.
“First off step changes are not very common in nature.”
Which is why you would need strong evidence that they have happened multiple times over the last 40 years.
“Those step changes seem to happen pretty regularly “
Seem.
““chance” isn’t a very good explanation for the correlation.”
First demonstrate that there is a correlation. Then show that it’s significant, I e. Unlikely to have happened by chance. Then we can consider if this correlation implies causation.
“What is your definition of “permanently warmer”. ”
I’m using “permanent”in a lose sense. The pint is your theory requires all the warming caused by EL Niños to be additive. Each one has added to the global temperature. A necessary requirement for this to happen would be that any increased heat does not noticeably decline before the next El Niño.
“Minimum temps going up? Maximum temps going up? “
It’s your model. You tell me what you would expect to happen?
Given that your claim is the heat produced by each El Niño just hangs around, I would have expected to warm both equally.
“It’s not even a hint! Again, you can’t tell if A causes B or B causes A.”
That’s your problem, you can never take a hint. Any competent person would try to understand what the correlation was hinting at.
“You keep denying that you believe correlation is causation “
Which is another hint you can never get.
“It’s exactly like you denying that you believe measurement uncertainty is random, Gaussian, and cancels”
Could you try to stick to one lie at a time.
“It’s your model. You tell me what you would expect to happen?”
In other words you have no idea of what is going on. So it’s all just being pulled out of your behind!
Typical for you.
“That’s your problem, you can never take a hint. Any competent person would try to understand what the correlation was hinting at.”
If you don’t know cause-effect then NO ONE can claim to know what the correlation means. Other than you, that is. You seem to have a cloudy crystal ball that tells you all things.
“But having considered it, I think it’s very unlikely that this is the main thing seen in recent years. I think there are multiple reasons why it is unlikely that rising temperatures are the main reason why CO2 has increased.”
Multiple reasons? Then why didn’t you list some?
Rising temps increase decay of leaves both on the surface and mixed in the soil. Yet this is not included in any climate model that I can identify. Rising temps in the oceans cause CO2 outgassing. Yet this seems to be considered as “negligible” by climate science – but I can’t find any real reason for this assumption – it’s on par with the assumption that all measurement uncertainty is random, Gaussian, and cancels.
CO2 was higher in the distant past when wildlife was larger and more abundant – meaning more plant food was available. There weren’t any dinosaurs that I know of that were driving gasoline cars or using plastic utensils.
“I don’t just imply it. I’ll state it clearly that in my opinion it’s most likely that rising CO2 levels are responsible for most if not all of the rising temperatures. But I do not say that based on a simple correlation.”
You don’t support that opinion wit ANYTHING! Anything other than correlation that is!
“Which is why you would need strong evidence that they have happened multiple times over the last 40 years.”
Perhaps I wasn’t clear. One time step changes are no common in nature. Repeated step changes are – and are typically natural, e.g. seasons!
“Seem.”
Like usual, you have nothing to support your denial that they are regular in nature.
“First demonstrate that there is a correlation. Then show that it’s significant, I e. Unlikely to have happened by chance. Then we can consider if this correlation implies causation.”
Bullcrap! There are all kinds of spurious correlations that are significant! If you don’t know cause-effect then how can you judge if they are by chance or not? For you it’s all subjective opinion.
“Multiple reasons? Then why didn’t you list some?”
We’ve gone over this numerous times. You won’t accept any reason, but you’re happy to demand we go over it all again to distract from the point, which is that there is no need to employ implausible step changes caused by EL Niños, to explain the observed warming.
“Rising temps increase decay of leaves both on the surface and mixed in the soil. “
You really are clueless. Decay of leaves can have little effect on the total O2 in the atmosphere, because all the carbon they release has already been pulled from the
atmosphere.
“Rising temps in the oceans cause CO2 outgassing. Yet this seems to be considered as “negligible” by climate science…”
It isn’t negligible. But the main effect at the moment is because there is so much more CO2 in the atmosphere, oceans are actually holding more CO2 despite being warmer. They have gone from being a net source to a net sink.
“Repeated step changes are – and are typically natural, e.g. seasons!”
Seasons are not step changes. Nor ate they permanent. This year’s summer heat is not added to last year’s summer temperature.
“Like usual, you have nothing to support your denial that they are regular in nature.”
Correlation does not imply causation. Even if you could identify regular statistically significant step changes, you have not demonstrated that they are caused by El Niños. Or even that the step changes cause El Niños.
“Bullcrap! “
You say that, then agree with what I just said.
“We’ve gone over this numerous times. You won’t accept any reason, but you’re happy to demand we go over it all again to distract from the point, which is that there is no need to employ implausible step changes caused by EL Niños, to explain the observed warming.”
To paraphrase you: “I don’t know any actual reasons but I have faith in my religious dogma that claims there are reasons”.
“You really are clueless. Decay of leaves can have little effect on the total O2 in the atmosphere, because all the carbon they release has already been pulled from the
atmosphere.”
Really? Decay of the leaves produce CO2 along with other gases. CO2 is *extracted* from the atmosphere through various processes. Decay *replaces” that. It is a matter of sinks and sources. If more leaves are produced then more decay happens and the sources put forth *more* CO2 than otherwise.
You really don’t believe that a greening of the earth doesn’t produce more CO2 than less greening?
“But the main effect at the moment is because there is so much more CO2 in the atmosphere, oceans are actually holding more CO2 despite being warmer. They have gone from being a net source to a net sink.”
Anthropogenic CO2 is just as negligible as ocean outgassing. You seem to be saying one is worse than the other.
NOAA disagrees with you by the way. They say that warming oceans have become LESS of a sink meaning more CO2 being held in the atmosphere. go here: https://globalocean.noaa.gov/latest-ocean-carbon-data-atlas-shows-a-significant-decline-in-ocean-co2-measurements/
“Seasons are not step changes”
Really? Neither is ENSO or El Nino. They build and reduce. And the global average temp is *NOT* a step change either.
“Correlation does not imply causation. Even if you could identify regular statistically significant step changes, you have not demonstrated that they are caused by El Niños. Or even that the step changes cause El Niños.”
Judas H. Priest! You just repeated back what I’ve been telling you! The exact same logic applies to temperature and CO2!
Statistics are a tool to analyze a distribution of multiple measurements, preferably of the same or similar things. Statistics can provide NO information about single measurements since there is no distribution to analyze. Therefore, statistics are not evidence.
From JCGM 104:2009
He doesn’t care.
Yep. He has his religious dogma and faith.
You do love to lecture the rest of the world, including statasticans, as to what “statistics” means.
In the real world statistics are used for all sorts of analysis not just for determining the accuracy of measurements.
In this case we are talking about looking at a time series of 45 years of data, each year made up of thousands of individual measurements.
Nothing in your tedious quotations address that.
Statistics are *still* nothing more than descriptors of reality, they are not reality themselves. It is the *measurements* that are reality.
And the sad part is that climate science doesn’t even make use of the full panoply of applicable descriptors. They never provide variance, kurtosis, skewness, or even the 5-number statistical descriptors for the data. It’s always just the average value.
You can’t understand reality using just averages – unless you are a climate scientist or an CAGW supporter.
“Statistics are *still* nothing more than descriptors of reality”
Well that’s progress. You do now accept that statistics describe reality.
That’s what I’ve ALWAYS said. But they are *NOT* reality themselves. And the average by itself is not even a complete descriptor – unless you are a climate scientist or CAGW supporter, which you apparently are.
Your sophestry is immeserable. Measurements of any sort are a description of reality. You use the measurements as evidence, not the thing you are measuring.
Judas H. Priest. You just repeated back what I’ve been telling you about correlation and now you are doing it for measurements – and it’s obvious that you don’t understand either one!
Length as a noun is not a measurand. You can’t measure “length”. Length as a avalue, however, is a property of a measurand. You can measure the length of a board. You can’t MEASURE an average! There is nothing there to measure!
Dude, statistics are not used to make measurements of a measurand, measurement devices are. Statistics are used to evaluate a best estimate of a measurand from measurements and to characterize the uncertainty of the estimated value.
In fact, one doesn’t even need to use statistics to evaluate the best estimate nor uncertainty. NOAA provides the resolution and uncertainty values that can be used as a Type B uncertainty.
It is why statistics cannot add resolution or precision to measurements beyond what was actually measured. Statistics are not a measurement device.
The “thing” you are measuring is a measurand. The measurement is the value you measure.
“The “thing” you are measuring is a measurand.”
Sigh, we are not going to have to go through all this again are we? “thing” is ambiguous. The measurand, as defined in all current standards is the attribute that is being measured.
But regardless – my point is that the measurement of the quantity can be evidence. If you want evidence that Everest is the tallest mountain, will you want to put it alongside all other mountains, or will you accept a measurement of it’s height as evidence?
The evidence is that there is something to measure. The attribute is what is being measured. It exists.
Now, can you define a measurand to be a random variable such as a monthly average of daily temperatures. Of course. But, when you do that, you must treat the individual measurements as iterations of measuring similar things, under reproducibility conditions and not repeatable conditions. The conclusion from that is that the standard deviation is the appropriate uncertainty value.
https://sisu.ut.ee/measurement/33-standard-deviation-mean/
When the professor makes this assertion:
He is indicating the SD of a number of individual pipetting measurements that are considered “non-ideal repeatibility”, i.e., reproducibility conditions.
You could save yourself a lot of confusion if you just quoted the start of that passage
Cherry picking again without studying the entire package. You didn’t take the opportunity to go through the course did you? Why do you think I put the last statement in my response.
The phrase you have picked expresses the conclusion of the lesson when one measures a single sample of mass multiple times. That is defined as using repeatability conditions. The phrase that goes with this is:
When one uses pipetting which provides several independent measurements of different things each time (like temperatures), one uses the standard deviation of the distribution of single measurements. The phrase that goes with this is:
Another way to say this is (with my edits) is:
See this link for using single values from multiple pipette experiments.
3.2. Mean, standard deviation and standard uncertainty – Estimation of measurement uncertainty in chemical analysis (ut.ee)
More specifically, from:
4.1. Quantifying uncertainty components – Estimation of measurement uncertainty in chemical analysis (ut.ee)
More fundamentally for temperature, this course would use the figure that NOAA designates as the single measurement uncertainty. For ASOS that is ±1.8°F.
You have such a weird idea of what cherry picking means. You present me with a lengthy quote from a random internet page. I look at it and note that before your quote is a much clearer quote that explains the point I’m trying to make to you.
You keep quoting long passages with word highlighted that never mean what you think they mean.
“You didn’t take the opportunity to go through the course did you?”
You really are obsessed with online quizzes. Just for you, I’ve just gone through all the self-assessment questions on that page – scored 8 out of 8.
“When one uses pipetting which provides several independent measurements of different things each time (like temperatures), one uses the standard deviation of the distribution of single measurements.”
Again, you need to write to NIST and explain why you think they are wrong in TN1900 to use the uncertainty of the mean to estimate the uncertainty of the mean.
The standard deviation of daily temperatures will only tell you how much uncertainty there is in any given daily temperature.
“when the measured value reported or used in subsequent calculations is a single value (determined from a distribution of single values), then we use standard deviation of the single value (distribution)“
Exactly – a single value. Not the mean of multiple values.
“Again, you need to write to NIST and explain why you think they are wrong in TN1900 to use the uncertainty of the mean to estimate the uncertainty of the mean.”
Can you READ ANYTHING for meaning? You’ve never actually read TN1900, EX 2 for meaning. It’s why I keep asking you to list out the assumptions Possolo makes in the faint hope that some day you will actually understand them!
Possol’s assumptions are those needed to pretend you are measuring the same thing multiple times using the same device. EXACTLY what the course you say you took says. from the course: “When we weigh a certain amount of a material then we can weigh it repeatedly.”
As usual, you just refuse to learn the difference between repeatability and reproducability. Possolo used assumptions that allow using the measurements of Tmax in an environment of repeatabiity – multiple measurements of the same thing using the same device. He says this in almost those very words!
“This so-called measurement error model (Freedman et al., 2007)may be specialized further by assuming that ε1, …, εm are modeled independent random m variables with the same Gaussian distribution with mean 0 and standard deviation (. In these circumstances, the {ti} will be like a sample from a Gaussian distribution with mean r and standard deviation ( (both unknown).”
You will only get a Gaussian distribution for ε if you have multiple measurements of the same thing using the same device.
“The standard deviation of daily temperatures will only tell you how much uncertainty there is in any given daily temperature.”
No, since you are making one measurement of each different thing each time the uncertainty of any given daily temperature will be the measurement uncertainty of the measuring device used for that single measurement.
What in Pete’s name do you think the “standard deviation of the single value” actually is?
It’s a single value from a distribution of values.
How do you have a distribution of values from a “single value”?
You really cannot be this clueless. You just have to be a troll.
You have multiple values. You calculate the standard deviation from these values. That standard deviation is the uncertainty of a single value.
All of this is explained in the site Jim is promoting. If you disagree take it up with the University of Tartu.
Who in hell taught you how to interpret statistical descriptors?
The standard deviation of a data set consisting of random variables is *NOT* the uncertainty of a single value! The standard deviation of each random variable is the uncertainty of that random variable!
This is nothing more than your “numbers is numbers” meme and the “all measurement uncertainty is random, Gaussian, and cancels” meme. You deny those memes have an unbreakable hold on your psyche but they just come shining through in everything you post!
When you have a collection of single measurements of different things, each individua measurement will have its own measurement uncertainty. If the single measurements are made using different instruments then each individual measurement uncertainty can be very different. It’s why the data is given as “stated value +/- measurement uncertainty”.
“Who in hell taught you how to interpret statistical descriptors?”
That’s a difficult question, which would have far too long an answer. Let’s just say it’s a skill that has developed throughout my life.
“The standard deviation of a data set consisting of random variables is *NOT* the uncertainty of a single value! The standard deviation of each random variable is the uncertainty of that random variable!”
What do you mean by the uncertainty of the single value. What I mean is it’s an indication of the range of values the next single value is likely to have. It’s an indication of how well any individual value will approximate the mean. And if you are measuring the same thing with he same instrument, it’s what is called the measurement uncertainty of that instrument, indicating how much uncertainty there is in a single measurement from that instrument.
Rest of your lies and ad hominems ignored.
“What do you mean by the uncertainty of the single value.”
You’ll never understand uncertainty. It’s why you post the inanities that you do.
Nothing more needs to be said.
“The measurand, as defined in all current standards is the attribute that is being measured.”
You have a blackboard statisticians view of precision in language.
You probably say “the length is” – which leads you to believe that length is a measurand, something that stands by itself.
A physical scientist or engineer will say “the length of *that* board is”. It is the board that is the measurand. The length of that board is a property, an attribute, of *that* board. The length isn’t a standalone “thing” that exists without the measurand it is associated with.
And *that* is how all current standards treat what are measurands and what are atributes.
Every think you can think of, e.g. length, speed, volume, density, temperature, weight, electrical charge, etc; are *attributes* of some THING. None of these exist as standalone entities that can be measured. They are all attributes *OF* some thing.
It’s the same thing with you as with “standard uncertainty of the mean”. It is a blackboard statisticians lack of precision in what uncertainty is being spoken of. It’s why you adamantly refuse to be precise in your language as to whether you are speaking of sampling uncertainty of the mean or measurement uncertainty of the mean.
Sampling uncertainty of the mean is an additive factor of uncertainty to measurement uncertainty of the mean. You refuse to admit it but you *always* try to get around that with your meme of “all measurement uncertainty is random, Gaussian, and cancels”.
I’ll leave you with an example to ponder on. Statisticians *always* assume a six-side die will end up with a single face up. Thus the assumption of a uniform distribution for each side appearing. Yet I have seen, in my experience as a D&D player, a six-sided die wind up balanced on an edge with essentially two sides up. Admittedly it doesn’t happen very often but it is *NOT* an impossibility. But it means that a uniform distribution is *not* a perfect statistical descriptor for rolls of a six-sided dice.
Yet I have never seen in a statistics textbook where this has been treated as a possibility in reality. I’ve never even seen it treated for flips of a coin where the coin *can* balance on edge every so often. Same with measurement uncertainty – never treated in statistics textbooks – always considered to be zero and only stated values exist, even of measurements.
You are a perfect example of someone that has been trained to ignore reality and always just assume 1. numbers is numbers and, 2. all measurement uncertainty is random, Gaussian, and cancels.
Thus the standard error of the mean is *always* the only uncertainty of the mean.
“A physical scientist or engineer will say “the length of *that* board is”. ”
What do you think I mean by attribute? Of course you are measuring a specific attribute of a specific object. You really must stop violently agreeing with what I say.
“The length isn’t a standalone “thing” that exists without the measurand it is associated with.”
You still can’t accept the standard definition given in the GUM VIM etc. The length of the thing is the measurand. If you want to reject the GUM, then say so. But don’t pretend your definition is the one used in metrology.
“Statisticians *always* assume a six-side die will end up with a single face up. Thus the assumption of a uniform distribution for each side appearing.”
Pathetic nonsense. You really need to understand the difference between assuming something for a simplified example and believing it to be absolutely certain. Nobody thinks that any real world dies will have an exactly uniform distribution. Nobody thinks it’s impossible to have a cracked die. Nobody thinks it’s impossible for a coin to land on it’s edge. You can;t rule anything out in statistics, nothing has a probability of 0. The die could fall through a dimensional portal, or spontaneously combust for all you know.
It doesn’t mean that there is much point to including these possibilities when describing the probability distribution. If you have a cracked die just re-roll it. That’s what you would do in any role playing game. Happens all the time.
You really need to understand the wisdom of saying all models are wrong, but some are useful.
“What do you think I mean by attribute? Of course you are measuring a specific attribute of a specific object. You really must stop violently agreeing with what I say.”
That does *NOT* make the attribute into a measurand. It is a MEASUREMENT of an attribute. Two different things.
“You still can’t accept the standard definition given in the GUM VIM etc. The length of the thing is the measurand. If you want to reject the GUM, then say so. But don’t pretend your definition is the one used in metrology.”
The GUM does *NOT* say this. This is a result of your reading comprehension disability.
STOP CHERRY PICKING stuff you think agrees with your distorted views.
From the GUM:
B.2.11
result of a measurement
value attributed to a measurand, obtained by measurement
A measurement is *NOT* the measurand. A measurement is a value attributed to a measurand.
An average is *NOT* a measurand or even a value that can be attributed to a measurand. It is a statistical descriptor – that is *all* that it is. It is a tool to help understand a distribution of a set of data. But it is *NOT* an element in the set of data.
“You really need to understand the difference between assuming something for a simplified example and believing it to be absolutely certain.”
This from YOU! You, who won’t admit that TN1900, EX2 is a simplified example – a teaching example – and doesn’t actually apply in the real world?
“You can;t rule anything out in statistics, nothing has a probability of 0.”
You do it! You do it every time you assume all measurement uncertainty is random, Gaussian, and cancels!
“ou really need to understand the wisdom of saying all models are wrong, but some are useful.”
You missed the word “some”. Climate models are *NOT* useful in their current format.
“That does *NOT* make the attribute into a measurand. It is a MEASUREMENT of an attribute. Two different things.”
It’s like arguing with an unusually thick piece of wood. If you can measure the attribute, then by definition the attribute is a measurand.
“A measurement is *NOT* the measurand.”
Well done.
“An average is *NOT* a measurand or even a value that can be attributed to a measurand.”
Then stop asking for it’s measurement uncertainty, and stop banging on about how everyone has to accept TN1900. And try to understand that I don’t care if you call an average a measurement or a statistical parameter. That’s your pedantic hang up.
“But it is *NOT* an element in the set of data.”
It doesn’t have to be. Again that’s your hang up. Not mine, not anybody who understands how this works. You do not need to believe in 0.58 boys in order to understand what the average family size means.
“This from YOU!”
Correct.
“This from YOU! You, who won’t admit that TN1900, EX2 is a simplified example ”
When have I ever suggested it isn’t a simplified example? I’ve not been the one insisting that from now on everyone has to use Ex 2 as a model for all temperature uncertainty. I’ve not been the one saying that anyone who doesn’t follow it to the letter is disagreeing with the mighty NIST. I’ve spelled out several times the problems with the example, and the ambiguity of what they mean by the uncertainty of that particular mean.
“You do it!”
When. You keep confusing me with those voices in your head – the ones that keep saying everything is Gaussian. If you spent half as much time trying to read what I actually say, as you do hurling insults and making up lies, these arguments would be a lot shorter and more pleasant.
“You do it every time you assume all measurement uncertainty is random, Gaussian, and cancels!”
Do these voices also tell you to burn things down?
“You missed the word “some””
Read it again –
“E.5.1 The focus of this Guide is on the measurement result and its evaluated uncertainty rather than on the unknowable quantities “true” value and error (see Annex D). By taking the operational views that the result of a measurement is simply the value attributed to the measurand and that the uncertainty of that result is a measure of the dispersion of the values that could reasonably be attributed to the measurand, this Guide in effect uncouples the often confusing connection between uncertainty and the unknowable quantities “true” value and error.” (bolding mine, tpg)
The GUM differentiates between “measurement” and “measurand”. If you would ever actually study documents instead of just cherry picking from them you *might* understand this.
“D.5.2 Uncertainty of measurement is thus an expression of the fact that, for a given measurand and a given result of measurement of it,”
The GUM differentiates between “measurement” and “measurand”. If you would ever actually study documents instead of just cherry picking from them you *might* understand this.
“B.2.11
result of a measurement
value attributed to a measurand, obtained by measurement”
The GUM differentiates between “measurement” and “measurand”. If you would ever actually study documents instead of just cherry picking from them you *might* understand this.
“If you spent half as much time trying to read what I actually say,”
Now, all that’s left for you do to is to come back and tell me that this is what you’ve been trying to tell us all along. That a “measurement” is not a “measurand”.
“The GUM differentiates between “measurement” and “measurand”.”
As they should, given they are two different things.
If you are trying to imply that I think hey are the same, you are just engaging in your usual muddle-headed straw men arguments.
*YOU* are the one that keeps suggesting the measurement *is* the measurand!
Are you now going to deny that?
You can just keep lying, or you can provide an actual quote where I said measurement and measurand are the same thing.
I’m sure there must have been some point where I made that mistake, and that’s stuck in your brain, or possibly you are just making it up, and hope that if you repeat the lie often enough people will start to believe it.
Statistics are certainly used for other things than measurement uncertainty, however that is off topic.
The analysis of measurements by statistics MUST take into account the uncertainty of the data. If statistics does not acknowledge that each piece of the data is uncertain, then the end result will be meaningless.
Doing time series analysis requires more than simple linear regressions of a value against time. One must be able to evaluate the multitude of factors that result in the values.
Don’t try to overwhelm someone who has spent a career analyzing time series of revenue, volumes, expenses, and employees. Unless you can show how your values are derived and their uncertainty, you have no business in extrapolating the values beyond what time period you have already experienced.
Why do you think climate science uses the term projection instead of prediction?
Are you 95% sure that your linear regressions can be extrapolated into the distant future? Why not? There should be several reasons.
“Doing time series analysis requires more than simple linear regressions of a value against time. “
Why can you never accept that I am not doing that?
When the x-axis is time, you are doing a time series analysis. Most of your regressions use anomalies.
You have never posted any graphs where you’ve analyzed any of these criteria. Why is that?
bnice has tried to show you what happens when you remove random events like ENSO that are not caused by human emissions. That is doing time series analysis.
“When the x-axis is time, you are doing a time series analysis”
If you could only try to understand, I wouldn’t have to keep repeating this. Time is not a variable in this model. I draw a graph with time as the x-axis to make it easier to see what is happening. But the predicted value depends only on CO2, ENSO, the AMO and optical depth values.
I can just as easily show the predicted value as the x-axis. No time appears on the graph.
“Are anomalies seasonal?”
Anomalies remove most of the seasonal variance – but it’s irrelevant as I’m using annual averages.
“Have you broken anomalies into Tmax and Tmin to isolate monthly and seasonal differences?”
Huh? What do max and min have to do with seasonal differences. And no, I’m using mean temperatures.
“Do anomalies have a changing variance by month or season?”
Again, I’m using annual averages. If it’s sop important to you, why don’t you look at the data yourself.
“You have never posted any graphs where you’ve analyzed any of these criteria. Why is that?”
Because I don’t care. It’s irrelevant to the point I’m making. The same reason Monckton does none of those things when he presents his little pauses. If it matters to you, you can do the work.
“bnice has tried to show you what happens when you remove random events like ENSO that are not caused by human emissions.”
You are so gullible. And again, why don’t you demand he analysis it for seasonal variations, and distinguishes between max and min.
“That is doing time series analysis.”
His analysis is to draw some arbitrary straight lines and claim this proves all the warming was caused by El Niños. Yet for some reason you keep calling me a monkey with a ruler, and pretend I’m claiming correlation implies causation.
Tell me, does winter have higher anomalies at a station than summer? Any other time related differences hidden by your annual anomaly?
Annual anomalies DO NOT remove seasonal variance. Annual anomalies HIDE seasonal variance,
Time is a variable! The values you plot on the y-axis are time-dependent. Show a resource that supports your assertion.
The predicted value IS DEPENDENT on the values of each casual variable at a given point of time in your model.
Don’t try to snow someone who has done for their business. How do you think an expense or revenue time series is done?
From:
https://towardsdatascience.com/multivariate-time-series-forecasting-456ace675971
“Time is a variable! The values you plot on the y-axis are time-dependent”
Just what point do you think you are making here? Why this obsession with claiming time is an independent variable in my model? Apart from the obvious, that you have to throw any distraction rather than accepting it is possible to explain all pauses and step changes purely through the interaction of CO2 and ENSO.
“The predicted value IS DEPENDENT on the values of each casual variable at a given point of time in your model.”
To the extent that it’s impossible to find values that exit outside of time, yes, that will always be the case. But nothing in the model depends on the time. The same ENSO conditions will have the same effect on the prediction whether they happen in 1979 or 2023. If CO2 levels drop to 1900 levels, the predicted temperature will drop to 1900 levels. This is a limitation of the model, it assumes instantaneous responses. It’s a simple model, which is still sufficient for the point I’m making.
Bellman believes averages exist in reality. You can go out and find an “average” in your backyard if you just look hard enough. He believes statistical descriptors are actual measurements of reality.
Bellman has already told you he doesn’t care about the philosophical niceties about maths. “Existing in reality” or not is irrelevant. What matters is they are useful and work.
But if your argument is that things only exist if you can find them in your backyard, then the set of things you have to believe don’t exist must be vast. Do you think Australia exists? Or inflation? Or human intelligence? Can you find any of them in your back yard?
“But if your argument is that things only exist if you can find them in your backyard,”
No, my argument is that statistical descriptors are tools to understand reality but they are not reality in and of themselves. I can measure a physical thing but I *can’t* measure an average. Therefore an average can’t be a measurand.
I can measure Australia, therefore it is a measurand. Inflation is a statistical descriptor, it has no physical reality therefore it can’t be a measurand. Intelligence has a physical reality, therefore I can measure it, so it is a measurand.
“What matters is they are useful and work.”
I’ve never argued that they are not useful or that they don’t work. But they are statistical descriptors of reality and are *not* reality itself.
What do you use to measure the number 1?
“No”
then stop using all these folksy, you can’t find it in your back yard nonsense.
“Therefore an average can’t be a measurand.”
take it up with the authors of TN1900 then. And stop saying you can have a measurement uncertainty of an average.
“I can measure Australia, therefore it is a measurand.”
Then what number is it?
“Inflation is a statistical descriptor, it has no physical reality therefore it can’t be a measurand. “
Yet somehow prices keep going up.
“Intelligence has a physical reality”
Can you find it in your fridge or on your book case?
“therefore I can measure it”
You really can’t. You might be able to create an index that approximates some aspects of intelligence, but not intelligence as a concept.
“I’ve never argued that they are not useful or that they don’t work.”
Damn, should have used irony as an example.
“take it up with the authors of TN1900 then. And stop saying you can have a measurement uncertainty of an average.”
You *still* haven’t internalized what the GUM, TN1900, and all the rest are telling you. When the GUM speaks of a “quantity” it is speaking of something you can measure, a MEASURAND. A lump of steel, a barrel, the speed of light, the length of a board. It is *NOT* speaking of something you can’t measure, e.g. a soul, an average, a standard deviation.
And the statistical descriptor known as the average *can* have a measurement uncertainty. The average is derived from a collection of components that have measurement uncertainty and therefore it inherits the measurement uncertainty of the collection of components. The typical metric for uncertainty of an average is the variance. If the components are measurements with measurement uncertainty then the variance is conditioned by the measurement uncertainty as well as by the spread of the stated values. The measurement uncertainty of the average has NOTHING to do with the sampling uncertainty, it is a separate thing.
The very fact that you think an average can’t have a measurement uncertainty is quite telling. It is proof that you have no actual experience in the world of metrology at all. The measurement uncertainty of an average is a piece of information valuable to others when judging the accuracy of both your results and their duplicate results. The sampling uncertainty of the mean simply cannot do that. The sampling uncertainty tells you NOTHING about the accuracy of the mean, it is the measurement uncertainty that accomplishes that.
“Yet somehow prices keep going up.”
So what? It still isn’t a measurand, it is a statistical descriptor of a set of data.
“Can you find it in your fridge or on your book case?”
Actually I can. I can find the writing of people in my bookcase which are a measure of their intelligence. Same for the food they cook. And I can judge your intelligence by the assertions you make that have no relationship to reality.
“You might be able to create an index that approximates some aspects of intelligence, but not intelligence as a concept.”
MENSA will disagree with you completely on this.
A ruler marked in inches is an index useful in measuring the lengths of a board. A frequency counter uses an index known as cycles/sec to measure the wavelength of an EM wave. Those are both measurements of something physical. The same thing applies to intelligence.
You keep trying to rationalize to yourself that statistical descriptors are physical things that can be measured. They aren’t. They never will be.
I don’t believe he even exists. I think it’s just a bot to increase site traffic, programmed with a few schoolyard insults, and a repetition of “it’s the el Nino wot done it”,
The answer is quite simple. The HTe was in 1/22. However, there were both cooling gases (SO2) and warming gases (H2O) driven into the stratosphere. They balanced out at first. It took about a year for the SO2 to start losing its effect and, as a result, the warming started at that time. It wasn’t real obvious at first due to the ongoing La Nina. However, as that faded and El Nino kicked in the temperature soared.
Just for grins I took the average of the USA48, Arctic, and Aus.
July 2024 –> 0.39
July 2023 –> 0.90
That is a big drop. Doesn’t seem to corelate at all to CO2. One must be able to explain how CO2 has such a large disparity amongst various areas.
I haven’t had a chance to look at other combinations. I will continue. I suspect I will find a large disparity between ocean and land. If so, it will make a global computation pretty useless when looking at where humans actually live. Until humans begin to live on the ocean, ocean temperatures are a small concern of how humans handle ocean temperatures. Marine biologists may have a different opinion, but it is up to them to show that CO2 causes ocean temperatures to rise.
The NOAA grid points are not well-defined, with lots of overlap between land and sea. At low latitudes it is quite possible for the satellite to sample only ocean on one pass, and only land on the next.
“That is a big drop. Doesn’t seem to corelate at all to CO2. One must be able to explain how CO2 has such a large disparity amongst various areas.”
This seems just a bizarrely ignorant statement if you’re the slightest bit cognizant of meteorology.
And of course you are – which begs the question …..
Where I live and for the majority of the world away from the tropics and poles, Each year brings a different “flavour” of weather. It is evident in the data FFS (that you are befuddled by), re temp, rainfall, surface pressure, wind direction.
In short a different series of weather systems present themselves during the course of the year.
What that means is that averages of temperature for any day/week/month/year will be different from the previous day/week/month/year (annual basis).
Hence your incredulity that “Doesn’t seem to correlate at all to CO2” is gob-smacking.
Of course it has no correlation to CO2.
It is correlated to the weather.
Weather is the “noise” in the signal, especially when zoomed in to a small time/space.
Air masses dominant over the period involved (where the dominant air-stream originated).
Where CO2 comes in, is the average over the globe over the long term.
That is not caused by fluctuating air-masses, as, well, air masses are inherent in the whole.
“Where CO2 comes in, is the average over the globe over the long term.”
Scientifically unsupportable rubbish.
And the previous year will be different than the year before the previous year, and so on.
What you are basically refuting is anyone, including you, that says such and such year (or month) is hotter than another year (or month) due to CO2! Your screed simply points out that the differences are only due to weather.
Congratulations, you just became a sceptic!
“Your screed simply points out that the differences are only due to weather.”
Try comprehending all I wrote ….
”Weather is the “noise” in the signal, especially when zoomed in to a small time/space.
Air masses dominant over the period involved (where the dominant air-stream originated).
Where CO2 comes in, is the average over the globe over the long term.”
Notice the word long-term now?
Weather causes short-term fluctuations in homogeneity in the signal (always supposing that you notice that weather changes from one day/week/month/year to the next) but over the long term average the underlying signal can be seen.
This is all blindingly obvious to anyone with any scientific nouse and can only be that cognitive dissonance is in play in rejection of the obvious.
CO2 does not cause local fluctuations of temperature at short time scales >>> Weather does.
CO2 causes long term changes over global temperature on long time-scales.
Cant say it any simpler than that, but I am certain you’ll not hear what I’m saying.
“CO2 causes long term changes over global temperature on long time-scales.”
So what? So does almost everything! Water, sulfur, methane, continental drift, volcanic activity, land use, population, the sun, solar system orbital mechanics, and on and on and on.
The *biggest* issue is exactly *what* long term changes are you talking about for CO2? Longer growing seasons, higher minimum temps, fewer cold deaths, greening of the earth, more food availability?
Or are you talking about shorter growing seasons, higher maximum temps, increased desertification, NYC and Miami being underwater, more tornadoes and hurricane deaths, less food availability?
Weather IS the signal! From National Geographic:
If you claim that year over year comparisons are invalid, you have ruled out trending as a way to see what is occurring.
So you believe that temperature is well enough known to the milli-kelvin that you can make accurate, scientific predictions with little uncertainty.
I’m glad that you can take monthly averages with an uncertainty in the range of ±2°C (a 95% range of 4°C) and a precision of 0.1°C and average non-repeatable temperatures and achieve an uncertainty/precision of ±0.001.
As an engineer for a car owner, would you approve telling him that the car could handle a g force of 1.8 ±0.001 g’s based on the standard error of the mean while knowing the 1 SD of the non-repeatable tests was ±0.2 g’s?
The whole process of uncertainty analysis in climate science is a joke.
Really? Then all the radiation charts being displayed are in error because “back radiation” doesn’t occur in immediate fashion?
The only other choice you have is that natural variation can reduce temperature increases. However that implicitly admits that natural variation can also cause increases above what CO2 does.
Again that removes the ability to compare year over year changes being attributed to CO2. The uncertainty in what CO2 actually causes is very high.
Of course you can always posit that natural variation has ceased during the last century.
“Really? Then all the radiation charts being displayed are in error because “back radiation” doesn’t occur in immediate fashion?“
Where did that come from FFS?
Goal-posts migrating aside ….
Yes, really.
You must be being deliberately obtuse – no one can be that thick.
Even in the simplest possible terms you still can’t grok it.
Not surprised of course – I read your interactions with others and the same is evident.
Now let’s put your bonkers thinking into practise.
So you expect CO2 (any GHG?) to give the entire atmosphere a homegeneity such that it will produce the same deltaT over the entire surface at any given time scale?
That is what you are effectively saying.
Err, then there would be no weather.
Mr Roy’s UAH V6 TLT maps would show the whole planet having the same deltaT for the given month.
So why doesn’t it?
Because weather happens and there is a variability in local climate over that short time scale.
If that still isn’t groking then my time talking with an idiot is done.
Go look in the mirror.
And where is the “climate emergency” — nowhere.
How many articles in even peer reviewed studies from all over the globe do you want to see where it is claimed that global warming is the cause for a detrimental change?
Your arguments only make the use of a Global Change In Temperature more meaningless. If CO2 is well mixed, one would expect a similar “back radiation” and temperature effect. Your argument is that natural variation has a great effect. That works both ways. If natural variation can lower the CO2 temperature at a location, it can also add to the CO2 temperature at a location.
Why don’t you show us what the ± natural variation part of a Global Anomaly actually is if any. A recent study that is peer reviewed would be excellent since that is all you believe is worthwhile.
Here is an older one I found in Google Scholar. https://doi.org/10.1029/2004GL021563
UAH does include a Global Anomaly. It is the third column in the table shown in the essay. Also at the home page. Here is a copy from Dr. Spencer’s website.
https://ibb.co/9hbRxCR
I can get others from NASA and MET.
If a global ΔT is of no use at individual locations due to weather, why is it used so often to describe local changes?
“And of course you are – which begs the question …..”
No, it raises the question. “Begging the question” is a logical fallacy, and very often mis-used as you did.
“Just for grins I took the average of the USA48, Arctic, and Aus.”
for extra grins why not take the average over the whole globe?
“One must be able to explain how CO2 has such a large disparity amongst various areas.”
You keep asking this, but never accept the obvious answer, weather.
“ I suspect I will find a large disparity between ocean and land. “
it’s a real shame that Spencer is so quick to publish the headline figure long before the full details are published
“Until humans begin to live on the ocean, ocean temperatures are a small concern of how humans handle ocean temperatures.”
But as you must realise by now, land temperatures are warming faster than the oceans. You need to demand that Spencer only publishes the rate if warming for land.
For June the anomaly for land was +1.02°C, compared with the headline global anomaly of 0.80°C. And the warming rate since 1979 is +0.2°C / decade.
Because CO2 can not warm the ocean. That means the greatest effect of CO2 “back radiation” is on land areas. Therefore, the largest increases should occur over land.
If natural variation is the excuse for a decrease in temps not following CO2 increases, then one must also admit that increases in temps could also arise from natural variation.
Climate science is sorely lacking in research that provides any attribution other than CO2.
More distractions. First you insist we should ignore ocean warming as people live on the land. Then when it’s pointed out that land is warming faster, you switch to nonsense about CO2 not warming the oceans.
The obvious reason why oceans warm slower is because of their greater heat capacity. But it may also be due to different lapse rates.
You asked:
I replied:
You asked:
You’ll need to show where I mentioned anything about land warming slower or faster or where you asked a question about land warming faster.
My main point was about attribution of natural variation. If one implies natural variation applies only when cooling of the anomalies occur, then one must also allow for natural variation adding to warming anomalies. In other words, CO2 effect is smaller than the anomalies show.
“You’ll need to show where I mentioned anything about land warming slower or faster or where you asked a question about land warming faster.”
What you said was
“If one implies natural variation applies only when cooling of the anomalies occur,”
Who implies such a thing?
“In other words, CO2 effect is smaller than the anomalies show.”
eh?
I’ll repeat what you showed I said.
And here is what I asked you to confirm.
You failed to show where I said anything about the land warming faster or slower.
Your attempts to distract from the pont by focusing on meaningless straw men is pretty obvious.
““You’ll need to show where I mentioned anything about land warming slower or faster or where you asked a question about land warming faster”
You did not mention the different rates of warming. I did not claim you did. Nor did I ask you a question about the different rates, I told you what they were.
What you implied was you wanted to look at land, because that’s where most people live, and that you expected to see a big disparity between land and ocean. I agreed with you and pointed out that land shows more warming than oceans.
Tonga
IF there actually is a global warming trend (we simply don’t know, since we only go by “global average”) i say it’s a good thing. Would we want to be as cold, or colder, than the LIA? Really?
No one cares about your tiresome summaries. We are more interested in what is causing this oceanic expulsion of heat when we all know it cannot be an enhanced greenhouse effect.
You will never get any evidence of human causation from the bellboy, or any of his monkey friends.
They don’t even try any more, having failed utterly and completely in the past.
Just yabber on mindlessly about totally natural events.
And applying rulers to shotgun plots.
Somebody asked for the 30 rolling year average, I provided it along with the linear trend for comparison. That’s the extent of my use of linear regression.
You don’t complain about Dr Spencer giving the linearrate of warming on this article. You never complained about all those cherry picked linear trends Monkton gave every month.
Why are you so obsed with me?
Still totally incapable of providing evidence of human causation.
It is so funny to watch your pathetic antics. !
So now we are back to “correlation proves causation”. It never ends.
Its a three-ring circus.
How times have changed. I remember when it used to be a “tree-ring” circus.
What are you on now? I have never suggested that correlation implies causation, let alone “proves” it. But more to the point, where on my comment did I say anything about correlation or causation?
Still totally incapable of providing evidence of human causation.
Just yap, yap ,yap..
You really are making a total mockery of yourself.
You care enough to tell me how little you care. Bnice cares enough to pollute every comment thread with mindless insults.
If nobody cares it should be eady enough for everyone to just ignore my summaries.
And bellboy doesn’t care enough produce any evidence of human causation.
An empty-minded twit yapping about totally natural temperature variability.
I know this is hard for you to understand, but I have no interest in speculating in this comment section why temperatures are as high as they are. I am simply pointing out what the data is showing.
I’ve told you before that nobody at this stage knows for sure why it’s been so unusually warm this last year. Maybe it’s the just an unusual El Niño acting on an already heated world. Maybe that volcano played a part. There are lots of other possibilities.
Today we are being bombarded by a solar storm that is the largest in the past 20 years. Combine that with a peaking grand solar maximum and the lingering effects of Tonga and El Nino and it is not surprising it is a tad warmer right now. Energy is coming into the planet faster than the planet can shed the excess.
Temperatures are not a good proxy for energy and energy is what this is all about. A dynamic, chaotic, non-deterministic energy system that is trying to achieve equilibrium and has never gotten there is 5 billion years.
So now you are finally admitting you have no evidence of human causation.
Just a mindless yap, yap, yap.
There goes those El Nino events causing warming again.
Thanks for continuing to point that out , bellboy !
Bod Tisdale marks them at 1988, 1998, 2010, 2016… Just like on your chart. (now 2023)
With basically no warming between.
How do humans cause these El Ninos ??
Oh look, another monkey with a ruler.
Still no evidence that those El Niños caused that escalator. Just arbitrary lines showing what you desperately want to believe.
And you crawl back into your mindless DENIAL of El Nino warming, despite all the data you have produced showing that is where the warming has come from.
Despite the data right in front of your eyes.
Do you actually DENY that there were El Nino events in the years stated above, a fact that can be easily checked by anyone.
That would be deliberate ignorance.. which is about what we have come to expect from you and your comrades.
And you still have no evidence of any human causation…
… just more headless chook routine.
I’m not denying anything. I’m asking you for an explanation as to how an El Niño could cause permanent surface warming. If you could provide an explanation then we could compare the two hypothesis and see which one fitted the data better.
Until then all we have is you and your ruler claiming flat lines over short periods of highly variable data.
Is it permanent? The jury is still out on that. Some of the energy transfers are in femto seconds while others are in decades.
Well, bnice requires it to last 40 years at least.
Yes you are , you are deep in DENIAL that the El Ninos are the cause of the warming.
You have already admitted that there is no human causation.
You have yet to show any human caused atmospheric warming, ever.
Just the continual yapping.
“You have already admitted that there is no human causation.”
And he’s back to lying again. All he has left.
He’s so lame he can’t even generate original insults.
So telling that karlomonte cares about the quality of our insults.
“Bod Tisdale”
I see why you are confused.
Oh dearie me.. best the bellboy can do is pick up a minor typo.
Pathetic to the max. !!
Nothing to do with the typo.
Yet in many places it is NOT warmer than in previous years. How does a “global average” give us any meaningful information??
Totally bizarre treatment of statistics. You cannot use the experimental standard deviation of the mean as the uncertainty when using different measurand’s (stations). Different stations will not meet repeatable conditions. You also must propagate uncertainty through each calculation.
Because it is taken over a long time period.
Have you not noticed that an increase in any sample size decreases random error.?
So to does a period of around 30 years average out natural variability to give the underlying trend.
That’s how a “global average” becomes meaningful.
As in UAH V6 TLT showing the long-term warming trend – whilst the great snake-oil salesman Monckton kept posting a short-term trend that has now, as previous ones, been erased.
To have “errors” one must also know what the correct value truly is. This can only possibly occur if you are measuring the same thing under repeatable conditions. Even then, there is uncertainty introduced because each measurement used to determine the “random error” has its own error.
NOAA temperature measurements are NEVER of the same measurand. To do that would require multiply thermometers in the same housing. Only CRN thermometers have that! Do you wonder why that is needed for a resolution of 0.1°C and an uncertainty of ±0.3°C? Using different stations ARE NOT measurement of the same measurand.
This is why the entire international scientific community has agreed to use the GUM and ISO to move measurements to a stated value plus an uncertainty. Basically an interval within which a measurement may lay.
Get with the program!
“Have you not noticed that an increase in any sample size decreases random error.?”
It does *NOT* reduce systematic bias in measurements using different measurement devices.
Nor does it reduce random error when you are taking single measurements of different things using different measurement devices with varying resolutions.
You cannot increase resolution by averaging. You cannot reduce measurement uncertainty by averaging. Since many temperatures at many measurement devices are only recorded in the units digit, you can’t reduce the resolution any further than the units digit. The same applies to accuracy.
Unless you are a “climate scientist” that is.
Sample size only affects SAMPLING UNCERTAINTY. It can only locate the mean of a population more precisely. It can’t tell you if that population mean is accurate or if it is wildly inaccurate.
If you average a bunch of inaccurate measurements it is almost a certainty that you will wind up with an average that is inaccurate as well.
This is pure bullshit, but typical trendology.
Yep. And those that believe this are totally surprised when their bridge design winds up being a foot short of the piling on the far end!
But the beams averaged the correct length ±0.1 inch (standard uncertainty of the mean)
I keep asking if you could give an example of how someone would use an average to build a bridge and how it could result in the bridge beung too short.
I can do that. My wife and I have built over 250 stick homes. I’ll guarantee you that when you buy 2×4’s they won’t all be the same length. Why? Many are bowed. Stick a bowed 2×4 between two straight one, and what do you think will occur.
I’ll bet you didn’t know that dimensional lumber is cut to size before drying did you? What can happen during drying? Changes in size for all three dimensions. Yet if you take a shipment of 1000 2x4x8, and use the standard uncertainty of the mean as how much the boards vary, you’ll have a lot of boards that are unusable because they are too short. Or you can shim the short ones (which won’t pass inspection if they catch you).
Then to answer your question. A couple of decades ago a local bridge over a small creek was being replaced by building a new one next to it. It ended up that the support beams were too short. Know why? The surveyors and concrete construction guys screwed up the location of the pilings by 18″. Do you think they might have overlooked the uncertainties in what they were doing? Took an extra year to fix that mistake.
Cool story, but nothing to do with your claims.
What I’m asking for us an example of how you are using the average to determine the total length of, say, a bridge, and how this would not be improved by increasing sample size.
“Yet if you take a shipment of 1000 2x4x8, and use the standard uncertainty of the mean as how much the boards vary, you’ll have a lot of boards that are unusable because they are too short.”
Once again all you are saying is, if you use the wrong statistic you will get the wrong answer. The uncertainty of the mean is telling you how uncertain the mean is. There’s a clue in the words used.
If you want to know what proportion of boards are too shot you need to look at that statistic. Take a random sample and see what percentage fail. Extrapolate from that to figure out how many unusable boards ther will be in the 1000 boards. Do you think your estimate will be better or worse, if you use a larger sample?
You’ve never once done any real world construction have you?
How many carpenters do you think are going to buy extra material just so they can have *some* of the boards be the right length?
What are they going to do with the boards that are too short? Put’em in the scrap pile to be burned? Would *YOU*, as the customer paying the bill, be willing to pay for all that extra material?
You are a manufacturer building mower decks for riding lawnmowers and need spindle bearings for the deck. Are you going to order a multiplicity of bearings based on the average diameter just so you can get some that meet tolerance specs? Or are you going to want to know what the range of diameters will be so you can know if they will meet allowable tolerances? You have a decision to make – do you pay more for higher quality bearings with tighter specs or do you waste money (and time) for cheaper bearings that have a higher discard rate?
In neither case, for either the carpenter or the manufacturer, does the “average” help you. In neither case does the sampling uncertainty help you. What *does* help you is knowing the measurement uncertainty associated with the product.
“How many carpenters do you think are going to buy extra material just so they can have *some* of the boards be the right length?”
I was responding to Jim saying
I’m still waiting for either of you to describe a scenario where using a sampling results in the bridge being too short.
“In neither case, for either the carpenter or the manufacturer, does the “average” help you. “
Then don’t use it. Again, using the wrong statistic for the wrong job does not mean the statistic is wrong for all jobs.
I don’t really care who you were responding to.
And I gave you an example. The problem isn’t the example, it’s YOU.
“Then don’t use it”
A subtle agreement that the average isn’t useful. And no one has said the average isn’t useful for all jobs. It is *not* useful for jobs which depend on measurements and their measurement uncertainty to be successfully completed.
“How many carpenters do you think are going to buy extra material just so they can have *some* of the boards be the right length?”
I would hope that anyone managing the construction of a bridge would expect proper risk assessment. In most cases I would expect it’s better to order more material than the absolute minimum on the grounds that it’s going to be a lot more expensive to delay the project by a few months, than have a bit of extra materials left over at the end.
You allow for breakage. You don’t allow for extra material “just in case”. You’d never win a bid on a project with that kind of estimating.
For something critical you put tight tolerances on the material from the manufacturer with penalties for not meeting the tolerances.
We’ve plowed this ground before. Like with most things you haven’t learned a solitary thing.
Who pays in either case? The taxpayer.
As a builder, if a lumber company gave me wrong statistics, guess how much business they would get in the future, not only from me, but other builders I talk to.
You are trying to justify making the user of a product the person who must make up any failure. I now know for sure you’ve never owned a business, nor have you ever learned quality management. Right the first time! Read and study W. Edwards Deming’s writing on quality. I received my training from Western Electric. Where did you receive yours?
And again with the ad Homs. It shows the lack of confidence in your own argument. I’ve never owned a business, therefore I can’t be right about statistics. Not a smart argument.
All this comes from your statement:
and me pointing out that you are using the wrong statistic. But as always you two fail to address that simple point, and try to turn it into an argument about business practices.
No ad hominem. I notice you did not reject the conclusion that you’ve never owned a business that had to rely on the quality of products it purchases. You originally asked about building bridges. I was honest, I have never designed nor project managed a bridge construction project. I did learn about structural design because an EE degree required calculus based study of Statics and Dynamics. I do have experience in several areas of business where measurements are fundamentally applicable. I have tried to relate those as examples.
Here is another example. If you’ve ever spent time in Home Depot or Lowe’s have you noticed the construction people pulling boards out and examining their straightness? Now you know why. That way, they don’t have to absorb the breakage, the lumber company does. That is an example of single measurements of different measurands. The standard deviation is the important statistical parameter rather than a simple sample statistic of standard deviation of the mean.
I have no doubt that you are well trained in statistics. However, you have the same bias as many statisticians. Data are created for the purpose of using statistics. As a person trained in physical science, the measurement data is created to use in a physical environment. Statistics is only used as a tool to understand the limits of measurement data. Statistics is not the reason for obtaining the data.
Wrong statistic huh? Tell us how you justify using the uncertainty of the mean (divide by √n) to determine the uncertainty of temperature measurement averages of different things. That is no different than one purchasing a load of boards and wanting to know what breakage can be expected.
Why should I have to do the sampling of a product I have already purchased to see if it meets my needs? The seller should tell me exactly what to expect when I purchase a product. This is just another example of your lack of experience in using measurements.
Let’s say you are in charge of determining the capacity of an oil field. Are you going to drill 30 test wells and tell your CEO the average along with the standard deviation of the mean or the average and the standard deviation? Remember, a lot of investment and borrowing of capital is going to rely on your report. What is going to happen if the field is only good for a minus one standard deviation rather than “one SD / √30”?
Measurements and their uncertainty do have a real world effect. Why do you reckon standard deviations are the preferred indicator of uncertainty?
“Tell us how you justify using the uncertainty of the mean (divide by √n) to determine the uncertainty of temperature measurement averages of different things.”
Stop throwing random words around as if you understand them. The uncertainty of the mean is not there to determine the uncertainty of individual temperature mesurements. It’s there to determine the uncertainty of the mean. That’s why it’s called the uncertainty if the mean.
“Why should I have to do the sampling of a product I have already purchased to see if it meets my needs? “
I’m trying to help you reach some kind of conclusion. You want to use the analogy of building a bridge by taking the average of a sample to show that this will result in the bridge being too short. I’m trying to get you to give me a hypothetical example where sampling is used.
If you trust your suppliers figures then you don’t need to run your own tests. But you would hope that any figure your supplier gave was based on some actual statistical testing.
“Are you going to drill 30 test wells and tell your CEO the average along with the standard deviation of the mean or the average and the standard deviation?”
How many more times does it have to be explained that you use the right statist for the right job. If you need to know the average capacity then you need to know the uncertainty of that average. If you need to know the uncertainty of a given well you need to know the uncertainty of a single well, that is the standard deviation.
“The uncertainty of the mean is not there to determine the uncertainty of individual temperature mesurements. It’s there to determine the uncertainty of the mean. That’s why it’s called the uncertainty if the mean.”
You are back to using Equivocation. What you are calling the uncertainty of the mean is the SAMPLING UNCERTAINTY of the mean. It is an ADDITIVE uncertainty to the MEASUREMENT UNCERTAINTY.
The sampling uncertainty tells you how precisely you have located the mean of the population. The measurement uncertainty tells you the ACCURACY of the mean of the population. The sampling uncertainty conditions the measurement uncertainty.
The fact that you can’t discern the difference between sampling uncertainty and measurement uncertainty only shows how little you have learned over the past two years of being taught abut metrology.
If you could actually get round to describing the exact scenario you are talking about, that leads to the bridge being too short because if averaging, you wouldn’t neef all these hysterical out bursts.
I’ve given you the scenario’s. The fact that you can’t relate to them is telling.
I’ll give you just one, real world, example.
A number of years ago I was a Boy Scout leader at a Klondike Derby. One of the tasks we had to complete was building a bridge across a gully to get our sled across. So the boys “measured” how wide the gully was and headed out to get beams and runners to build the bridge from material selected from a pile the organizers had provided. Well guess what? One of the selected beams was too short to span the width. The other one was too short to find a good base in the soil along the gully, the dirt kept falling out from under it. BOTH BEAMS WERE TOO SHORT. They had to go back to the pile to find others that were long enough. The runners? Some were too short and some were too long. The ones that were too long worked fine, the bridge would be wide enough to carry the sled. The ones that were too short? What do you suppose they had to do?
No statistical analysis of the piles of sticks would guarantee that you would get sticks of the length needed. It’s what probability *should* tell anyone with real world experience. I know its a lesson the boys learned but which you seem to be adamant about not learning. You can get a run of 1’s from a six sided die just as easily as you can get a run of 6’s. But you don’t seem to believe that.
If you had *ever* had any real world experience you would understand this.
You go to the construction yard and grab four 10′ I-beams to span a distance of 20′ with two rails. Two of the I-beams are too short and two are too long. By chance you pair up the two short ones and the two long ones.
What in Pete’s name do you do when one rail is 2″ too long and the other is 2″ too short? They’ve already been welded together and lifted into place.
Exactly what sample do you think you are going to increase the size of that’s going to help anytiing?
Still can’t come up with a single example to justify your claims. I’ll repeat:
An example of how someone would use an average to build a bridge and how it could result in the bridge being too short.
The constant resorting to ad hominem arguments makes it clear you can’t justify your claim.
I just gave you an example. If all the beams you use in one span are on the short side of the average you’ll fall short of reaching the piling on the far end. A SIX YEAR OLD COULD FIGURE THIS ONE OUT. Yet for some reason *you* can’t. Or won’t. I’m guessing “won’t”.
Not an example of what you are claiming. You are just saying the average might be wrong, not explaining why increasing sample size will make the problem worse.
Where did your incorrect average come from? If it’s from the manufacturer, and every beam was smaller than the advertised average, you can sue the manufacture for making false claims.
If you determined it yourself from a random sample, it’s difficult to see how every beam could be below average, but the obvious point is that the larger your sample the less likely it is to be seriously wrong.
If you are just falling back on “systematic measurement errors”, then yes that’s a problem. But it’s a problem regardless of how you are calculating the number of beams needed.
“ou are just saying the average might be wrong, not explaining why increasing sample size will make the problem worse.”
You have no actual understanding of what a distribution of values really is, do you?
I am *NOT* saying that the average might be wrong! I am saying that not all elements will be of average length. I am saying that not every sample pulled from a population will be Gaussian. It’s the very definition of sampling error!
Increasing the sample size will *NOT* make the average more accurate if the elements in the distribution are inaccurate! How many times does that have to be explained to you? Increasing the sample size only allows narrowing down where the mean of the distribution lies, it does *NOT* increase the accuracy of that smaller and smaller interval.
If the data elements in the population are inaccurate then the population mean is going to be inaccurate as well. And it does not matter how precisely you can locate that inaccurate mean. The estimate of the population mean from larger samples will *still* be inaccurate!
Again, how many times must this be explained to you?
You can’t eve seem to grasp the concept that the samples will consist of data elements of the form “stated value +/- measurement uncertainty”. When you find the mean of that sample it will *also* be of the form “stated value +/- measurement uncertainty”. If you take multiple samples and then find the means of those samples for use in forming a new distribution, each of the elements in that new distribution will be of the form “stated value +/- measurement uncertainty”.
Now, when you find the mean of those sample means that mean should also be of the form “stated value +/- measurement uncertainty”. The measurement uncertainty will be the propagated measurement uncertainty from the elements of the data set.
Sampling uncertainty, your “standard error of the mean”, should be *added* to the propagated measurement uncertainty.
But as usual, YOU (along with climate science) just want to ignore that measurement uncertainty that goes along with every single entry in each level of the data sets. You always claim you don’t assume that measurement uncertainty is random, Gaussian, and cancels but you use that meme every single time you drop the measurement uncertainties when calculating the measurement uncertainty of the mean.
Sampling doesn’t eliminate measurement uncertainty, it doesn’t even minimize it. Averaging doesn’t eliminate or minimize measurement uncertainty. Two truisms that you adamantly refuse to internalize.
“If you determined it yourself from a random sample, it’s difficult to see how every beam could be below average, “
Not *every one* has to be below average. I used that to emphasize what could happen. All that has to happen is that more have to be too short then too long so they don’t cancel. You seem to believe that *every* sample will turn out to be a Gaussian distribution – it won’t. That’s not what the CLT says. The CLT says the means of multiple samples will tend to Gaussian, not that each sample will be Gaussian. In fact, if your population is skewed your samples better reflect that. And it doesn’t matter why the population might be skewed, it could be that your population was from different manufacturing runs or even from different manufacturers. If you pull just ONE sample then exactly how is the average of that sample going to help you judge what is going to happen?
“If you are just falling back on “systematic measurement errors”, then yes that’s a problem. “
It’s not a matter of systematic measurement errors although that can be a factor as well! It’s a matter that you simply don’t understand what statistical descriptors are actually telling you about reality. It’s obvious that you’ve never had to apply statistical descriptors to reality where all kinds of liabilities attach to the result. It’s only blackboard geniuses that refuse to distinguish between sampling uncertainty and measurement uncertainty – that’s you to a T.
Sampling theory is really a red herring used to prompt off-topic discussion. It really boils down to declaring the measurand and the measurement model.
Let’s look at NIST TN 1900 Ex. 2. It gives this explanation:
This assumes that the measurand is:
In other words, a random variable t with 22 data points obtained from observations.
Don’t misunderstand, I don’t necessarily agree with the assumption of repeatability conditions. I would say reproducibility conditions which uses the standard deviation, but so be it.
Statisticians would like to define these as samples, but they are not, they are INDIVIDUAL MEASUREMENTS of the same thing, Tmax_monthly_avg. They are fundamentally a population. It like choosing all people between 73.001 and 73.365 years old.
If these were samples, the CLT would guarantee a normal distribution. Yet the GUM and many other metrology documents show probability distributions of uniform, triangular, and normal.
One can simply not forget that this discussion of uncertainty is based upon measuring the same thing. One condition is repeatability and one is reproducibility.
“Statisticians would like to define these as samples, but they are not, they are INDIVIDUAL MEASUREMENTS of the same thing, Tmax_monthly_avg. They are fundamentally a population.”
That’s what I’ve been pointing out all this time. You can do what TN1900 does and treat the mean of the month as the mean of a probability distribution, and that’s how you treat any sample. But in this simple case you can argue that you are really interested int he actual mean for that month. In which case there would be no uncertainty beyond that of the actual measurements.
“If these were samples, the CLT would guarantee a normal distribution.”
You still haven’t bothered to find out what the CLT actually says. If you have a sufficiently large sample the the sampling distribution tends to normal. In this case the sampling distribution is the sample mean.
Dude, I know very well what the CLT says. The CLT requires MULTPLE SAMPLES with individual sampleS consisting of a given number of selections. The average of each sample will be a data point in a Sample Means distribution. The CLT predicts that the distribution of the Sample Means will be normal IF THE SIZE OF EACH SAMPLE IS LARGE ENOUGH.
To be honest, the number of Tmax or Tmin temperatures in a month is fixed and discussing sampling is off topic.. 31 days in a month is not so large that sampling theory is even needed. You have the full population and don’t need an estimate of either the mean nor the standard deviation.
The reason for dividing σ² by the √n is to obtain a statistic describing an interval where the mean, e.g., the “true value” may lay. However this assumes, one, measuring the same thing under repeatable conditions, and two, the distribution of the measurements is normal. Neither of these apply to temperature measurements.
“I know very well what the CLT says. The CLT requires MULTPLE SAMPLES with individual sampleS consisting of a given number of selections.”
Your second sentence contradicts your first.
I’ve tried to explain this to you numerous times, but it won;t penetrate someone who thinks they know it very well.
The CLT says that the mean (or sum) of a random sample will come from a probability distribution that will tend to normal with increasing sample size. It does not require multiple samples. Your problem is you just don’t get that even though frequentist probability is defined in terms of an infinite number of trials, that does not mean you require an infinite number of trials to make use of the probability.
“The CLT predicts that the distribution of the Sample Means will be normal IF THE SIZE OF EACH SAMPLE IS LARGE ENOUGH”
Tends to, not will be.
“31 days in a month is not so large that sampling theory is even needed. You have the full population and don’t need an estimate of either the mean nor the standard deviation.”
Again – this is what I’ve been arguing about TN1900 since you raised it. But it just comes down to what your model is. TN1900 treat the individual days as coming from a probability distribution and the measurand is the mean of that distribution. On that basis their uncertainty is fine, just the SEM of a sample of the recorded days. But of you want to know the actual mean, and if you have all the days of the month, then there is no uncertainty, apart from that arising from the measurements.
“The reason for dividing σ² by the √n is to obtain a statistic describing an interval where the mean”
You keep demonstrating you don’t know the CLT very well. I’d say it was just a typing error but you do it all the time. You divide σ² by n to get the variance of the sampling distribution. You divide σ by √n to get the standard deviation, or standard error of the mean.
“an interval where the mean, e.g., the “true value” may lay.”
An interval derived from the SEM does not tell you where the true value may lay – it’s a probability distribution. The true mean may lie within the interval or it may lie outside it. And what the confidence interval is really telling you is what range of possible values would have had a reasonable probability of producing the observed result.
“However this assumes, one, measuring the same thing under repeatable conditions”
No it does not. You keep insisting that statistics are not measurements and then trying to use the language of metrology in order to treat them as measurements. The sample is a random selection of different things, taken from the same probability distribution. It makes no sense to take an average of the same thing, nor is there any requirement that all things are measured with the same instrument by the same observer.
“two, the distribution of the measurements is normal.”
You really like to demonstrate how wrong you are to claim you understand the CLT very well. No, there is no requirement that the probability distribution is normal. That’s the point of the CLT. It tells you that with sufficient sample size the sampling distribution will approach a normal distribution regardless of the shape of the population distribution.
If your population is normal the CLT isn’t necessary as the sum of normal distributions is always normal.
“The CLT says that the mean (or sum) of a random sample will come from a probability distribution that will tend to normal with increasing sample size.”
Stop trying to lecture us on statistics. This statement just proves you have no idea what you are talking about.
The CLT says that the means of multiple samples, even from a highly skewed parent distribution, will tend to a Gaussian distribution. The samples themselves will (or should) mirror the distribution of the parent distribution, if the parent distribution is highly skewed then each sample distribution should be the same. The larger the sample size the more accurately each sample will reproduce the parent distribution. But the means of those samples that are highly skewed will tend to a Gaussian distribution.
If the means of the samples did *NOT* tend to a Gaussian distribution then the standard deviation of the sample means would be meaningless.
Give it a rest. You don’t understand what statistical descriptors tell you. You don’t understand measurement uncertainty at all. Now you’ve shown that you don’t even understand what the CLT tells you.
From Scribbr: “The central limit theorem states that if you take sufficiently large samples from a population, the samples’ means will be normally distributed, even if the population isn’t normally distributed.”
from investopedia: “As a general rule, sample sizes of 30 are typically deemed sufficient for the CLT to hold, meaning that the distribution of the sample means is fairly normally distributed. Therefore, the more samples one takes, the more the graphed results take the shape of a normal distribution.” (bolding mine, tpg)
Please note carefully the use of the words “samples'”, “means”, “more samples”.
I’m done wasting my time with you. I have jewelry and apparel to make.
“Stop trying to lecture us on statistics”
I wouldn’t need to keep lecturing you, if you made the slightest effort to learn or understand what I’m saying.
“The CLT says that the means of multiple samples, even from a highly skewed parent distribution, will tend to a Gaussian distribution.”
Compare that with my statement that you said showed I had no idea what I was talking about.
These two statements are saying the same thing. The only difference is that you describe the sampling distribution in terms of the distribution of the means of multiple samples, whereas I describe it in terms of the probability distribution. The probability distribution describes what will happen if you take the mean of multiple samples. They are both describing the same thing in different terms. It’s just you keep assuming that describing the distribution in terms of multiple samples, means you actually have to take multiple samples for the CLT to work. It “requires” multiple samples is the phrase I was objecting to.
You seem to think that you have to take multiple samples in order to determine the shape of the sampling distribution. I keep telling you that’s missing the point. You have the CLT in order to tell you what distribution your single sample mean came from. There would be no point having the CLT if you had to take multiple samples, and there is no point taking lots of different samples, when you can just combine them into a much bigger single sample.
“The samples themselves will (or should) mirror the distribution of the parent distribution, if the parent distribution is highly skewed then each sample distribution should be the same.”
Which is what I was telling you a few comments ago.
“If the means of the samples did *NOT* tend to a Gaussian distribution then the standard deviation of the sample means would be meaningless.”
It wouldn’t be so useful, but it would not be meaningless.
“Please note carefully the use of the words “samples’”, “means”, “more samples”.”
You still don’t get the difference between saying that the CLT means that if you take multiple samples the means would follow a particular distribution, and knowing that your single sample comes from that probability distribution. And for some strange reason you keep insisting that this means that when people use the CLT, they actually take hundreds of samples, just to find out what the CLT should already be telling them.
If I tell you the probability of throwing a 12 with a pair of dice is 1/36, it means (using the frequentist notion of probability) that if you throe the dice many times, the frequency of 12s will tend to 1/36. But that does not mean in order to use the fact that the probability is 1/36, you must roll the dice thousands of times. The probability is 1/36 even if you only throw the dice once.
Look at the Scribbr article you quoted:
Or Investopedia
“ The only difference is that you describe the sampling distribution in terms of the distribution of the means of multiple samples, whereas I describe it in terms of the probability distribution. “
Your typical meme that everything is Gaussian is showing again.
If the parent distribution is skewed a large sample will also show the same skewness. In the face of skewness the average is almost useless. The *mode* tells you what the most likely value is and the mean will tell you what the middle of the distribution is.
That makes trying to find a standard deviation around an average just as useless.
I pointed this out to you and you just blew it off like so much of the stuff you cherry pick from.
“There would be no point having the CLT if you had to take multiple samples”
Bullshit! The CLT DEPENDS on having multiple samples. Taking just one sample means you have to *assume* the standard deviation of the parent distribution is the same as the standard deviation of the sample in order to calculate how precisely you have located the mean. THERE IS NO GUARANTEE THAT WILL BE THE CASE, not even for a Gaussian parent distribution!
The rest of your post is just you trying to rationalize to yourself your lack of understanding of how the CLT works. You *can’t* combine the data elements from multiple samples into one big sample and expect the CLT to work. That’s no different than just taking one big sample to begin with. You’ll just have one sample to work with! You’ll have to assume that it’s standard deviation is the same as the parent standard deviation – and that is a piss poor way to statistically analyze something in the real world.
With multiple samples you don’t *need* to assume anything. You find the means of each sample and those means becomes your data set. And the standard deviation of that data set is your sampling error interval! Also known as the standard deviation of the sample means – which far too many statisticians mischaracterize as “the standard error of the mean”.
If you would actually STUDY Taylor instead of just cherry picking from his tome, you would understand all of this.
I won’t reply in this thread again. I am going to unsubscribe from it. You refuse to learn and all you can do is post garbage. I’m tired of picking up your garbage and attempting to sanitize it.
“If you would actually STUDY Taylor instead of just cherry picking from his tome, you would understand all of this.”
So typical – tries to use Taylor as an authority – despite the fact the Central Limit Theorem isn’t mentioned in his book. But it doesn’t matter how much anyone quotes Taylor to show Tim is wrong, that’s just cherry-picking. Tim is the only one allowed to interpret Taylor becasue he’s “STUDIED” Taylor in the correct way. Only Tim’s interpretation is correct – and guess what, Tim’s unique way of interpreting Taylor means that Taylor always agrees with Tim, even if he actually says the opposite.
Tim doesn’t need to actually point to the part where Taylor actually says you need to take multiple samples to use “SDOM”, nor would care if I listed numerous points where he actually demonstrates how to use
SEM, sorry SDOM with just a single sample. No that’s just cherry picking – the true devotee looks for the inner meaning.But for the record:
4.5. Example of rectangle.
From these 10 values the mean of the length breadth are calculated with the uncertainties being their SDOMs – that is the respective standard deviations divided by √10. At no point does he say that you actually have to repeat the 10 measurements many times to work out the SDOM.
Exercise 4.19 involves calculating the mean and uncertainty from a sample of 20 measurements of cosmic rays over 2 second periods. The uncertainty is that given by SDOM.
Exercise 5.33 involves a sample of eight times. It asks for the best estimate of the mean of t, and the uncertainty of the mean of t based on the standard deviation of the eight results divided by √N.
“Your typical meme that everything is Gaussian is showing again.”
Just deranged.
“If the parent distribution is skewed a large sample will also show the same skewness.”
That’s what I said. The distribution of a sample will tend to the distribution of the population as sample size increases.
“The CLT DEPENDS on having multiple samples.”
And as always, Tim ignores all my explanations for why that is not true, and just yells that he’s right about everything.
“Taking just one sample means you have to *assume* the standard deviation of the parent distribution is the same as the standard deviation of the sample…”
You don’t. What you assume with justification is that the sample standard deviation will be the best estimate of the population standard deviation. The larger the sample size the better that estimate.
“You *can’t* combine the data elements from multiple samples into one big sample and expect the CLT to work.”
The CLT works – it’s a theorem. It works with a large sample size. It tells you the larger the sample size the better.
“That’s no different than just taking one big sample to begin with.”
That’s the point. If you have to take 30 samples each of size 30 in order to estimate the SEM for a sample of size 30, you might just as well have taken a sample of size 900 and used the formula to estimate the uncertainty for the sample of size 900.
“With multiple samples you don’t *need* to assume anything.”
If you don’t like using the standard deviation of a sample of 30 as an estimate of the population standard deviation, why would you prefer to take the standard deviation of the means of 30 samples as an estimate of the SEM? You are still making the same assumption – the the standard deviation of a sample is an estimate of the population.
And you are making the assumption that you can justify the cost of taking many more measurements just to estimate the uncertainty of a single small sample. In the real world, the one you keep’s pretending he lives in, there are reasons why you have to rely on a small imperfect sample, rather than a much bigger one.
“I won’t reply in this thread again.”
Tim always pull’s this trick when it’s obvious he’s lost the argument.
“I am saying that not all elements will be of average length.”
You don’t say.
“I am saying that not every sample pulled from a population will be Gaussian.”
Really. Almost as if you agree with me that not all distributions are Gaussian.
“It’s the very definition of sampling error!”
You need to get a better dictionary.
“Increasing the sample size will *NOT* make the average more accurate if the elements in the distribution are inaccurate!”
You keep saying this nonsense, and never listen to my corrections. The elements in the distribution cannot be inaccurate. What I suspect you mean is the measurements are inaccurate.
Of course if you have inaccurate measurements your average will be inaccurate. If you have a single measurement that is inaccurate your single measurement will be inaccurate. The accuracy of the measurements is not a problem with averaging, it’s a problem with measurements. If your measurements are wrong your bridge might be short, regardless of whether you used statistics or not.
“Increasing the sample size will *NOT* make the average more accurate if the elements in the distribution are inaccurate!”
Wrong. The only way increasing sample size will not reduce the accuracy is if you have nothing but a systematic error.
“If the data elements in the population are inaccurate then the population mean is going to be inaccurate as well.”
And again, the population mean cannot be inaccurate. The population mean is the value you want – the true value you might say. This is like arguing that if you measure the length of your wooden plank inaccurate then the length of the plank will be inaccurate.
“You always claim you don’t assume that measurement uncertainty is random, Gaussian, and cancels”
Yes I do – because it’s true. Not all measurement uncertainties are Gaussian. They certainly are not all random. Can you now get rid of this self-defeating lie. Every time you resort to it it just becomes obvious you are incapable of arguing honestly.
“Sampling doesn’t eliminate measurement uncertainty, it doesn’t even minimize it.”
Nobody claims sampling eliminates any uncertainty. The uncertainty from sampling is mainly the uncertainty from sampling. The result of taking random values from a population. The larger the sample the better, as long as it’s an unbiased sample. It will also decrease “measurement” uncertainty, provided those uncertainties are random. The larger the sample the better for both cases. What won’t be reduced by sample size is a systematic error in all the measurements.
I have never said anything else. Systematic errors are systematic. If you spent less time arguing with straw men you would have noticed me saying this numerous times.
Your problem is that you keep claiming that measurement uncertainty increases with sample size, which is plainly wrong. And that when that argument fails you start introducing systematic error as an argument for not increasing sample size. You don’t seem to get that systematic error is a problem regardless of whether you use an average or just a single value.
“Not *every one* has to be below average. I used that to emphasize what could happen.”
These discussions would be so much easier if you were capable of doing what I ask, and supply a simple hypothetical description of this exercise. I asked you where the average comes from in this example. But rather than explaining that you just keep rambling on, as if it should be obvious top the rest of the world what’s going on in your head.
“You seem to believe that *every* sample will turn out to be a Gaussian distribution”
I don’t and it’s irrelevant to the point. The distribution of the sample will tend to the distribution of the population. The larger the sample the better. But that means that if the population is not Gaussian the sample will tend not to be.
Regardless of the distribution, the mean of the sample will tend to the mean of the population. If the distribution is skewed that might mean you have more below average than above average items, but the average will tend to the average, which also means the sum of all the items will tend to the average times the number of items.
“That’s not what the CLT says.”
Of course not. The CLT has nothing to do with the distribution of the sample, it’s about the sampling distribution, in this case either the distribution of the mean or of the sum.
“If you pull just ONE sample then exactly how is the average of that sample going to help you judge what is going to happen?”
You still don’t get that you usually only have one sample. What that sample will give you is
In all cases, the larger the sample size is the better.
How that information is going to help you judge what is going to happen depends to a large extent on what you want to happen – which is why I keep asking you to describe an example.
If all you are interested in is how many planks you need to reach a specific length, you can use the estimated average and it’s uncertainty to estimate a minimum number of random items you would need to have a specific percentage chance of reaching that length.
If you have to reject any board that is too short, then you can use the estimated population distribution to determine the percentage of boards that will likely be rejected from each batch, and factor that wastage into your calculations.
How realistic any of these scenarios are to actually building a bridge I couldn’t say, never having tried to build one myself. It might well be safer to measure every single board multiple times, and hope that there is no systematic error in your tape measure. That’s true of any sampling exercise – you don;t take a sample because it’s more accurate than measuring every single item in the population – you do it becasue it’s cheaper and easier.
“You keep saying this nonsense, and never listen to my corrections. The elements in the distribution cannot be inaccurate. What I suspect you mean is the measurements are inaccurate.” (bolding mine, tpg)
This just says it all.
You just plain don’t understand the concept of uncertainty. You never will.
Nothing more needs to be said.
And you claim I’m the one who doesn’t understand the difference between a measurement and a measurand.
I have never participated in building a bridge so I have no personal stories to relate. However, my father owned an International Harvester dealership as I was a gofer when assembling farm equipment as soon as I could walk. At that time equipment was not shipped assembled, it was in piece parts and the dealer assembled it. There were many times holes would not match to allow bolts to be inserted. Sometimes they would align during cool mornings or in the hot afternoons. It didn’t take a genius to understand that steel and iron shrinks or expands according to temperature. There were also times that the holes were simply drilled incorrectly. Those are all examples of measurement uncertainty and should be included in an uncertainty budget.
Here is a link to a good article about design of beams. These are things you learn in Statics and Dynamics classes in Civil Engineering. As EE’s, we had to learn these concepts and how to calculate beam requirements for transmission and distribution supports. You learn how to calculate and specify compression and tension loads under line weights and wind loadings. Again, measurement uncertainty was used to insure safety and security.
Beam Stress and Strain: A Lesson in Statics | JLC Online
Interesting how often the provocateurs post early in the comments.
Just look at some climate change or Palestine protesters and you will have a good idea why.
Its what they live for.
Indeed. Followed by an endless stream of comments. Tiresome..
Zeke Hausfather admits that climate scientists don’t understand climate:
“Earlier this year NASA’s Gavin Schmidt and I separately wrote that the evolution of global temperatures in 2024 would be important to tell us if the “gobsmacking” conditions we saw in the latter half of 2023 represented a new persistent condition for the climate or more of a temporary phenomenon.
Gavin suggested that we would have a better sense by August if conditions were stabilizing or the climate was heading into “uncharted territory”.”
What they do understand, is data manipulation, fabrication and torture.
It is their whole existence.
What I suspect is happening, is that HT gave the El Nino a kick-start, so to speak…
… and the extra moisture in the stratosphere is making it hard for the atmosphere to get rid of the energy released.
and a less than average summer here in the upper midwest.
Ditto in Britain.
Ditto in the great plains, specifically Kansas.
However in NJ we have had a continued succession of ‘Excessive Heat Warnings’ and ‘Air Quality Alerts’.
Today the high is 10ºF above the average daily high, yesterday was 12ºF above.
It is hilarious to see climate whackos drone on about hottest month on record and bloviate it month after month. When in realty the change of 1.5 C in 100 years is hardly noticeable and easily addressed with a nice tall glass of cold water.
The Sun/Ocean Dynamo is what is driving the slow warming trend a reality that climate nutters ignore because they have a scam to sell.
Well, I guess a drop of 6 C could be fixed with a sweater and a hot cup of tea. But when the global temperature dropped by 6 C, we had a glaciation, with a km of ice over NY.
No one knows what thermometer temperatures were during the last glaciation. The high-resolution data we have now cannot be compared to paleoclimate reconstructions.
Bingo.
A 1.5ºC or more drop in world-wide annual average temperature now, would be catastrophic, especially as electricity supply networks are already struggling to cope due to “renewables” infection.
Crop failures, famine, people freezing in winter, massive increase of cold related deaths.
Pray for continued natural warming.
Maybe in a century or so we can match the RWP or if we are really lucky, the Holocene Optimum temperatures.
So how far did temperatures drop in the last glaciation?
I am assuming you do in fact think that they did?
Because, well, you know – we cant be sure of anything.
I’m assuming you are totally clueless about everything.
A safe assumption.
A drop of 1.5ºC would take us back to the LIA.. a very hard time for humans
Crop failures, famine, people freezing in winter, massive increase of cold related deaths.
1.5 +/- 2 C rise since 1880 is also 1.0 +/- 2 C rise since 1879.
And you know this how exactly?
So how far did temperatures drop in the last glaciation?
I am assuming you do in fact think that they did?
Because, well, you know – we cant be sure of anything.
N.B.: Banton has no rational answer.
I asked you.
I agree with Nick.
Whereas you replied with some weird figment of your imagination.
BTW: If you didn’t know, “weird” is the new monicker for Tump/Maga.
Own it. You certainly deserve it, like him/them.
Ah yes, TDS. No surprise.
Agreeing with Nick, means you are most likely an idiot.
No.
Someone who doesn’t employ ideologically based cognitive dissonance.
AND understands the science – which you continually show that you lack via rabid ad hom attacks (the resort of the idiot who has no other means left).
There is no “science”! If there was, there would be no need to have the models do projections. The models could make accurate predictions of what will occur year by year into the future.
Are you saying that the models are currently making accurate predictions? If so, explain the need for parameter guesses.
“If there was, there would be no need to have the models do projections.”
So NASA has no need to model orbital trajectories. For nuclear physicists to model atomic interactions. Aviation in modelling engine performance and airframe aerodynamics. NWP in weather forecasting ?….
or shall we go back to computation via slide-rule and abacus?
Beyond bonkers.
Any advanced science utilises advanced numerically modelling to gain insight as to future events.
We are not living in Newton’s time, or Darwin’s, or even Einsteins.
Models are what is driving modern science forward.
As I’ve just said elsewhere, my time arguing with the idiot is over, lest he beat me by experience.
The subject is Global Circulation Models. Your argument fails based on immaterial evidence.
This link isn’t saving correctly. You’ll have to copy and paste into a browser.
https://human.libretexts.org/Bookshelves/Philosophy/Critical_Reasoning_and_Writing_(Levin_et_al.)/03%3A_Informal_Fallacies_-_Mistakes_in_Reasoning/3.02%3A_Fallacies_of_Evidence
You have really fallen in love with red herring arguments, please try to stay on subject.
Let’s make a guess. If the globe is currently 15°C and drops 1.5°C the global temperature will be 13.5°C or ~56°F.
That isn’t exactly a temperature where the ice age results. Glaciation shouldn’t be much different than the Little Ice Age.
The change will be losing the flora increase we are now experiencing. The result is starvation for many. The Precautionary Principle would indicate that an adverse reaction such as starvation should be avoided.
Remember, the PP should only be applied when there is no scientific evidence that will unequivocally show what the effect will be. We have a good idea what a return to the LIA will cause. We don’t have science that unequivocally tells what a 1.5 or even 2°C will cause
And all of the global warming that melted the glaciers since the last glaciation was natural. But 1-1.5 °C in the last 100 years is the tipping point to the coming apocalypse. Yeah…no.
I see that you dodged my point which is that in many decades of warming we continue to handle it easily and we already handle the temperature change of 30–40-degree F change during a summer day without a problem.
I used to work in the outdoor all day as Irrigation specialist with a lot of walking, digging, in the process of making repairs and more and easily handle the 100 degree F days in the process.
I am surprised that it is so difficult even for scientists to understand that regardless of whether the long-term trend is caused in whole or in part by human factors, the annual variability must necessarily be caused in whole by natural variability, whether it results in extra cooling or extra warming in any given year. If it is true that humans add a small forcing each year, we cannot be responsible for a large change in any particular year or years.
The long-term trend in the UAH is 0.014°C/year. For any given year, any change above or below that is natural variability. In terms of the human impact on climate, it only makes sense to discuss the long-term trend.
Models cannot reproduce what happened in 2023-24 because it is natural and not caused by one of the usual suspects like ENSO. Models can reproduce the small annual increase plus the occasional ENSO event. The most parsimonious explanation for this unprecedented warming is the unprecedented volcano.
UAH has aligned with ERA-5(only uses mid latitude results).
Arctic 90N-60N 5.4C
NH 60N – 23.5N 22.7C
Tropics 23.5N to 23.5S 25.3C
SH 11C 23.5S 50S
Antarctic -28C 60S-90S
NH 22.7 + SH 11 / 2 = 16.9C
Reality is much different.
NH 16.8 + -2 / 2 = 7.4C (normal 7.6C)
TSI 1317w-m2 3C (earth is 4.6C warmer in July)
Opposite in Jan
TSI 1407w-m2 7.6C (earth is 4.6C cooler)
As often, here is the Australian lower troposphere temperature anomaly updated to the beginning of August 2024. Thanks again to Dr Roy Spencer.
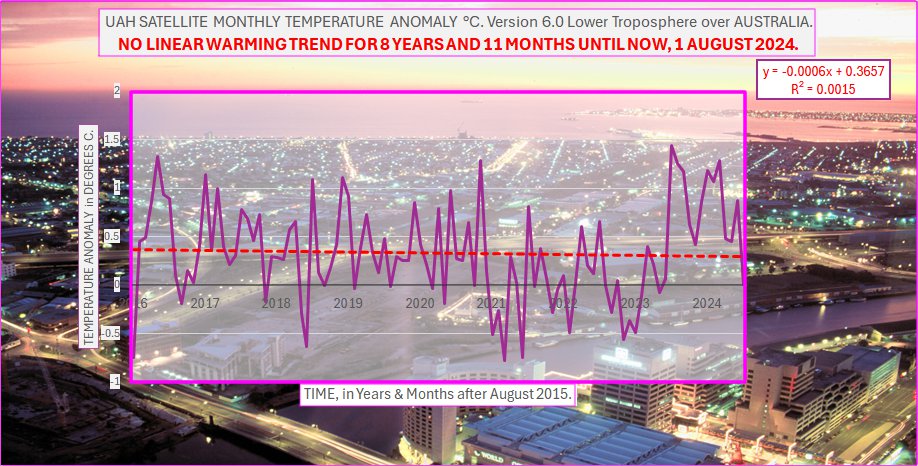
The Australian “pause” in Viscount Monckton style is now just short of 9 years. It is hardly cause for children to be concerned about “existential crisis” alarmist talk. (Locally, Melbourne where I live has had several weeks of quite cold winter weather, such as I recall from the 1960s, for what that is worth).
The large, recent feature on the global graph above is not nearly so pronounced over Australia, which continues to raise queswtions of the mechanisms that are creating these temperatures, as well as providing data to test hypotheses about what caused the feature, as in Hunga Tonga or not, etc.
Geoff S
My averaging calculations at http://www.waclimate.net/australia-cooling.html are that ACORN 1961-90 anomalies since March 2012 show a 0.055C mean temperature cooling among Australian land stations when the time period is compared 50/50 over the past 12 years and five months.
ACORN maximum anomalies have cooled more than minimum anomalies.
UAH lower troposphere shows 0.075C warming since March 2012 when compared 50/50, with the Australian +0.01C anomaly for July 2024 hinting that this dataset will also show cooling by year’s end.
NOAA mean temperature anomalies for Oceania, which are yet to be updated for July 2024, show a 0.051C cooling when compared 50/50 from March 2012 to June 2024.
That’s three separate datasets suggesting a bias toward cooling in the Australian region for almost 12 and a half years, or at least a plateau.
Chris,
These UAH monthly pause graphs over Australia started in Aug 2012 when I was composing them back in mid-2022.
The recent peak lasting about a year (?Hunga Tonga influence?) has slightly reduced the pause. If you wanted to generalize into “almost a pause” rather than abiding by the strict math, then yes, the pause in UAH would be more like 12 years.
In the UK we have a 14% increase in sunlight at the surface since 1980, probably due to the huge SO2 reductions. 14% of the approx 240 wm^-2 is way more than CO2.
But anyway, regardless of the cause of warming, and the irony of at least some of that warming resulting from reducing pollution, where is the associated crisis?
Some slight changes in rainfall, longer growing seasons, and a greener planet.
And thats it. I am sure some very dry places might have suffered a bit from the drop in rainfall, but the net effect of warming and CO2 is beneficial.
The science and data is clear on this
When is the destruction going to happen? Isn’t that 14 months of 1.5C above pre-industrial levels.
How many more before goalposts begin moving elsewhere?
According to the latest data in March 2033:
https://cds.climate.copernicus.eu/apps/c3s/app-c3s-global-temperature-trend-monitor
If it weren’t for all the media ranting and raving, I doubt anyone would have noticed much change in temperature at all…
… except those living in the 15 minute concrete jungles, of course.
And yet the planet is greener. Go figure. Almost as if warmer is better.
Nothing to see here! Absolutely nothing! Please, go away! Don’t crowd!
Abrupt reduction in shipping emission as an inadvertent geoengineering termination shock produces substantial radiative warming
Here is the Monckton Pause update for July. At its peak it lasted 107 months starting in 2014/06. Since 2014/06 the warming trend is now +0.38 C/decade. That is a lot of warming for a period that was used by many to declare that the warming had stopped.
“the warming” — hehehehehehehe
It’s ironic that this is the same person who constantly accuses others of misrepresenting his posts and spreading ‘disinformation.’ Talk about hypocrisy and double standards!
Absolutely.
First…you may be confusing me with someone else. I don’t know. It’s impossible to know for sure without context.
Second…do you think 1) the Monckton trend starting from 2014/06 is something other +0.38 C/decade and 2) that I posted an incorrect value with the intent to deceive?
1) The whole point of the Monckton pauses were to show how the IPCC over-predicted the rate of warming since 1990.
2) It’s definitely unfair to try and discredit others by using past predictions against them. Nobody, including Monckton, knows for sure when the warming will stop. Anyone who claims they do shouldn’t be taken seriously, and I’m sure WUWT readers are smart enough to recognize that.
Even after being told many many times, they are unable or refuse to comprehend CMoB’s methods.
Hmm…okay. Let’s ignore the obvious hypocrisy of these two statements for now and talk about the 1990 IPCC prediction.
Here are the 4 scenarios the IPCC considered in 1990. This is pg. xix in the SPM. I have marked the actual concentrations in red. It looks like scenario B or C is what humanity choose. Let’s just call it scenario B to be safe.
Here are the temperature predictions for each scenario. This is pg. xxiii in the SPM. I have marked the temperature rise using UAH TLT including the difference between the 13m average and the Monckton method. If anything I think you could make the argument that the IPCC under-predicted the rate of warming since 1990. What do you think?
That hasn’t stopped WUWT from publishing articles claiming just that. See here, here, and here for examples. And I’ll remind you of the prediction Monckton published in 2013 saying the Earth was going to cool by 0.5 C.
You might view it differently, but I believe that the claims of the IPCC and mainstream climate science should be held to a much stricter standard than climate skeptics. Their assertion of a major human impact on climate change carries significant consequences for both scientific integrity and economic stability.
Secondly, the IPCC projected a 30% increase in emissions under their BUA scenario from 1990, but the actual increase has been much larger. Their mistake stemmed from how they estimated the impact of emissions on CO2 concentrations, which is what you’re illustrating, and consequently on the rates of temperature increase.
Thirdly, why are you citing what Monckton said in 2013, over 11 years ago, instead of his more recent positions?
I don’t disagree.
The BUA scenario comes from WGIII. IPCC AR1 WGIII SPM pg. xxxii table 1 lists the BUA increase of CO2 emissions from 1985 to 2025 as 11.5 GtC / 5.9 GtC = 94% increase. Per Friedlingstein et al. 2023 emissions were 11.1 GtC. So in terms of CO2 emissions humans choose a pathway slightly below BUA. I think part of the confusion in interpreting the AR1 report is that WGI used “science scenarios” and WGIII used “policy scenarios”. The difference is that the graphs of “science scenarios” (WGI SPM figure 5) show actual CO2, CH4, CFC11, etc. concentrations separately whereas the graphs of “policy scenarios” (WGIII SPM figure 2) show “equivalent” CO2 concentrations. Note that WGIII defines “CO2 equivalent” as the CO2 concentration alone that is expected to be equivalent to the concentration of CO2 plus the concentrations of the other GHGs from the BUA scenario.
I was responding to your statement “Nobody, including Monckton, knows for sure when the warming will stop.” The boldening is mine.
The important factor trumpeted by the IPCC, as you show, is that CO2 is THE reason temperatures are increasing. The IPCC never, ever trumpets clouds or ocean currents or aerosols as components, only CO2. Yet you never criticize climate science as being a one horse cowboy selling CO2.
Some quotes you need to refute from:
CONFESSIONS OF A CLIMATE SCIENTIST THE GLOBAL WARMING HYPOTHESIS IS AN UNPROVEN HYPOTHESIS by Mototaka Nakamura.
From Appendix 1 Emissions Scenarios from the Response Strategies Working Group of the IPCC:
Monckton is not a psychic and cannot predict with certainty when the warming will end, nor can anyone else.
Not to mention he has never, ever made such a prediction. This was not the purpose of calculating pauses, which the trendologists are unable to comprehend.
Apparently, he wrote 11 years ago that he believed it was very likely the Earth would cool.
Big deal! That prediction was based on the information available at the time. Mainstream science has certainly had its share of failed predictions.
He certainly didn’t rely on the outputs of climate models; maybe it was a way to get people thinking beyond looking at straight-line regressions.
Trendologists believe correlation is *proof* of causation even though they deny they believe that. Their own words betray them however.
None of them can explain how if the earth emits two photons and gets one back from CO2 that it causes the earth to get hotter and hotter leading to increased desertification, food shortages, and coastal cities being innundated by accelerated sea level rise. All they can do is point to the “average” global temp is correlated to CO2 rise – totally ignoring the fact that the correlation works both ways if you believe correlation is causation – i.e. CO2 causes temp rise vs temp rise causes CO2 rise.
Who cares what these lying politicians write?
Oh yeah, YOU.
What you are saying is that it takes a major El Nino to break a long-term zero trend.
This is very obvious in the UAH data, with basically no warming between those major El Ninos
Why do you people, savages and vandals of society that you are, want to reorder entire economies and liberties based on so insignificant BS?
I know the answer, so don’t bother with more lying.
I think you have me confused with someone else. I’ve never savaged or vandalized anything. And I don’t want to reorder entire economies.
You are constantly vandalizing science.
You are supporting the anti-science AGW agenda that has stated loud and clear that it wants to reorder entire economies.
Are you so dumb, that you haven’t figure that out yet !
You truly are savaging and vandalizing economies by participating in the outcry to close perfectly good coal and gas power plants, to mandate the use ICE vehicles, and to stop fracking solely because you believe in a correlation is also the cause, i e., CO2.
I would also point out that your graphs and your conclusion means there is no longer a need for the IPCC nor for better GLOBAL Circulation Models. The ones we had in 1990 are right on the money.
You have me confused with someone else.
I’ve never suggested that either coal or gas power plants should close.
I’ve never mandated the use of ICE (or EV) vehicles.
I’ve never suggested that fracking should be stopped.
I’ve never claimed that correlation implies causation.
Stop gaslighting everyone!
Look at your last graph. Temperature and CO2.
You can’t tout IPCC as correct without also accepting their conclusion that CO2 is an existential threat to life on earth
Nonsense, it’s not possible to obtain an overall global temperature. Only about one third of the planet has the means to record temperatures. Nobody knows what the global temperature is. I’s certainly not possible to measure it to decimal points. It’s nonsense.