Gabriel Oxenstierna
All life on Earth (somehow) originates from the Sun’s heat.
But how much of the solar irradiation reaches us Earthlings?
The question is highly relevant, as the amount of reflected sunlight displays a remarkable decreasing trend over time. As will be shown, this trend alone explains most of the warming we’ve had in recent decades.
The Earth’s reflectivity is measured by albedo (a latin word meaning ‘whiteness’). Albedo measures the proportion of solar irradiation that is reflected back to space, either by the ground or in the atmosphere. If albedo is 100 percent, all light is reflected, and 0 percent means no light is reflected. Albedo is very different for different materials: pure snow can be as high as >90%, dirty snow can be as low as 20%. Water has albedo <10% (depending on the angle of reflection, see figure 1).[1] Clouds vary greatly and are between 30% and 80% depending on the type of cloud. The Earth’s albedo averages 28%.

Figure 1. What reflects more sunlight, clouds, snow, ice, or water?
If we start from the top, we have a pretty much constant solar irradiance. As soon as the radiation enters the atmosphere, photons begin to be reflected by ozone in the stratosphere, by clouds, water vapor and aerosol microparticles. Of the remaining solar irradiation that reaches the Earth’s surface, an additional part will be reflected away. The amount that is reflected varies greatly and depends on numerous factors such as the geographical location, ground conditions (land/sea/rural/urban), which season we’re in, temperature, altitude, and not least the weather at the location.
On a global scale, all that local randomness evens out, and we have a stable irradiation on a monthly basis. Figure 2 shows how much net solar irradiation that flows in, as a global average, per square meter: it is solar irradiation at the top of the atmosphere, about 340 W/m2, minus reflected shortwave irradiation of about 98 W/m2. Net approximately 242 W/m2.

Figure 2. Net solar irradiation that reaches Earth, watts/m2, calculated as incoming solar radiation minus reflected shortwave radiation. Seasonally adjusted monthly averages for each of the hemispheres. Thick lines are Loess smooths, March 2000 – September 2023. Data: Ceres Ebaf4.
There is a significant positive trend during the period 2000–2023. The increasing amount of solar irradiation reaching Earth is due to a trendwise decrease in reflected shortwave irradiation by 1.5 W/m2. On the other hand, solar irradiation decreased by approximately 0.2 W/m2 during the same period due to the solar cycle becoming less active.
We have thus had an increase in net solar radiation over the period of approximately 1.3 W/m2 according to the Ceres data. The long-term positive trend in shortwave radiation has been confirmed to exist since 1983 (with other satellite data).[2] That there is an established trend for 40 years makes it climatologically significant.

Figure 3. The trend of increase in shortwave radiation from 1983-2001. Copy of figure 1 in [2].
Albedo change explains the increase in net solar irradiation
Albedo is highly variable in time and space. Nevertheless, there is a great deal of stability on a global scale. In Figure 4, the development is shown separately for the Northern Hemisphere (NH) and the Southern Hemisphere (SH). They are very close to each other; the difference is stable and mostly less than 0.5 percentage points. SH has the slightly lower level, which is explained by the fact that it is dominated by sea (with ~80 percent of the surface area, compared to the NH’s ~60 percent). If we’re looking only at the nature of the Earth’s surface, the difference would be significantly higher due to the land/sea ratio – but the reflection from the clouds acts to even out the hemispherical differences.

Figure 4. Albedo for the period March 2000 – September 2023, calculated as reflected shortwave radiation measured at the TOA relative to incoming solar radiation. Seasonally adjusted monthly averages. Thick lines are Loess smooths. Data: Ceres Ebaf.
We have a continuing, and significant negative trend. This means that more solar irradiation enters and warms the Earth. That the albedo trend is negative is well established, and has been demonstrated with different methods: Ceres satellite data, and also by measuring the Earth’s back-radiation towards the Moon.[3][4][5]
What causes the albedo decrease? Several factors contribute: a decreasing cloud cover (both its extent and optical depth) has been shown to be the primary factor [3][4]; increasing vegetation (‘global greening’) is also a well-established secular trend of significant importance. Decreasing amounts of aerosols are of less importance. This can be imputed from the stable difference between NH and SH in figure 4, as aerosols have a local, short-term effect that mainly affects the NH.[6]
The climate is very sensitive to a reduced albedo. Scientists at NASA claim that a reduction in albedo of 1 percentage point produces a warming effect equal to a doubling of CO2 in the atmosphere.[7] Accordingly, the albedo decrease we have had in the last 24 years corresponds to almost 2.0 W/m². The increase in CO2 corresponds to only 0.7 W/m². See calculations below.
Conclusion: The ongoing, longterm reduction in albedo has produced more than twice as much warming effect in recent decades as the radiative forcing from CO2.
Calculations
1. Forcing from CO2
The IPCC states 3.9 W/m2 increased forcing from a doubling of CO2.[8] Mathematically, we search a factor that gives 3.9 from a doubling, expressed as a logarithm, ln(2/1). That factor is 5.63:
3.9 = x * ln(2/1) è x = 5.63
We can now insert start and end values for CO2 instead of the numbers ‘2’ and ‘1’. In March 2000 we had about 370 ppm and in September 2023 about 420 ppm. The theoretical forcing from CO2 for the period would then be:
5.63 *ln(420/370) = 0.71 W/m²
2. Forcing from albedo decrease
a. Using the data. Estimating the global albedo decrease from March 2000 to September 2023 with OLS yields a negative slope of -0.0019 percentage points (pp) per month, and the total decline for the period is 0.54 pp.
Assuming a linear relationship during the period, a reduced albedo of 0.54 pp gives an increased solar irradiation of:
0.0054 * 340 W/m2 = 1.84 W/m2
b. Using the NASA rule of thumb. Alternatively, calculated according to the NASA researchers’ claimed relationship of the warming effect of a 1 percent albedo reduction mentioned above, and using IPCC:s value for forcing from CO2 of 3.9 W/m2, the theoretical forcing of the global albedo reduction for the 24 years is: [7]
3.9 * 0.0054/0.01 = 2.1 W/m²
In both variants a. and b., the resulting figure is more than 2.5 as large as the forcing from CO2. The calculations have not taken into account the slightly decreasing solar radiation over time, but this affects the result only marginally.
References
[1] The albedo of water is calculated according to the Fresnel relationships, see e.g.:
https://en.wikipedia.org/wiki/Albedo#Water https://en.wikipedia.org/wiki/Fresnel_equations
[2] Do Satellites Detect Trends in Surface Solar Radiation?, Pinker and 2 co-authors, Science 2005, https://doi.org/10.1126/science.1103159 .
[3] The albedo of Earth, Stephens and 5 co-authors, 2015, https://doi:10.1002/2014RG000449
[4] The changing nature of Earth’s reflected sunlight, Stephens and 8 co-authors, 2022, https://doi.org/10.1098/rspa.2022.0053
[5] Earth’s Albedo 1998–2017 as Measured from Earthshine, Goode and 5 co-authors, 2021, https://doi.org/10.1029/2021GL094888
[6] Divergent global-scale temperature effects from identical aerosols emitted in different regions, Persad and Caldeira, Nature 2018, https://doi.org/10.1038/s41467-018-05838-6
[7] Changes in Earth’s Albedo Measured by Satellite, Wielicki and 5 co-authors, Science 2005, https://doi.org/10.1126/science.1106484
[8] IPCC 2021, AR6 WG1, chapter 7, p. 925
Technical note
In order to create the diagrams, I first downloaded data from Ceres (NetCDF4 format). The data were then preprocessed in the program CDO (Climate Data Operators) in Linux (in my case Ubuntu under Windows). All the time series data were calculated as surface-weighted monthly values in CDO. After that, the resulting data files were read into R/Rstudio where the figures were created with GGplot. All data and software are free to use/open source.
Gabriel Oxenstierna is a PhD at Stockholm University and one of the Clintel signatories.
Correction: in Figure 4, the y axis should be in Percent.
Nice article.
I would point out that a small fraction of life utilizes geothermal energy and mass, e.g., from hydrothermal vents, hot springs, etc.
The label is corrected now
The IPCC 3.9 W/m^2 for CO2 doubling is a gross overstatement
According to Dr. Happer, it is only a fraction of a watt due to saturation of CO2
See recent article on WUWT
Albedo changes are one of the only two factors that affect global temperature at a given distance from the sun because they mimic the effect of moving the Earth closer to or further away from the sun.
The other factor is atmospheric mass which only changes over geological time scales.
Atmospheric composition is not relevant because any such changes are neutralised by changes in the rate of convective overturning.
That leaves us with solar induced cloudiness variations as the likely cause of all climate variability on millennial time scales.
WELL STATED , Stephen 🙂
No it doesn’t.
The precession cycle shifts the exposure of land and water to changing solar intensity. Land has a strong positive response to solar forcing. Oceans have a very small non-linear response. Oceans get the bulk of the sunlight but move just 1C over an annual cycle. Land gets about 1/3rd of the sunlight but shift 12C. It is the change in land temperature that drives the global average temperature. Sunlight over land is trending up thereby causes “global” temperature to trend up.
Accumulated solar anomaly over land since it nbottomed in 1537 is 20ZJ. A tiny fraction of the energy has actual been retained through net meltwater produced but it has caused the oceans to retain significantly more heat at observed in the increasing abyssal temperature due to reduced ocean to land heat advection notably in August and September. offset a little by increasing advection to high northern latitudes during the boreal winter.
The precession cycle applies more to longer periods of time. The climate variability that concerns the alarmists is separate.
You are not alone in the mistaken belief. However the precession cycle never stops influencing Earth’s climate. Earth was not in equilibrium in 1850. The closest it came to an energy equilibrium was around the early 1500s when the amount of sunlight over land bottomed but reached its maximum over oceans.
The sunlight over land has risen steadily since. It is only in recent years that the warming of land in the NH has become obvious. But the warming has been observed for centuries. The last Thames frost fair was in the early 1800s. The sea level has been rising steadily for a couple of centuries.
There is very little ice left on land that will melt in this deglaciation cycle. Greenland is already gaining elevation and permanent ice extent.
Snow melt is still outpacing snowfall over most of the NH so think how much warmer the ocean surface needs to get before there is enough snow to form permanent ice.
“The sea level has been rising steadily for a couple of centuries.” It has been rising steadily for at least 6,000 years at a rate of about 1-2 mm/yr. See “A search of Scale in Sea-level Studies, Larson et. al. Journal of Coastal Research, July 2006. Before that it was rising much faster.
Stephen
“…millenial time scales….”, how about monthly or less ?…or as often as the weather changes ?
If we think about it, the LOWESS smoothing and 13 month running average of UAH obscures some reality from us. Take those out and suddenly we can focus on the wide swings of Fig. 2, or monthly changes of UAH or RSS graphs. These rapid variations can ONLY be explained by cloud cover variation, Earth’s Albedo, and how much of the incoming 1360 W/sq.M is reflected into outer space (all really the same thing).
It simply isn’t volcanoes, solar cycles, ice cover, growing vegetation nor CO2 emissions that can change the surface temperatures that quickly.
Anything that makes the surface warmer hence increasing evaporation in one locality is likely to increase cloud cover (especially low level cloud), hence cooling, somewhere downwind…when ?…next day…next week…random vagaries of Coriolis effect and advection…Add all those random effects and you essentially have a fixed surface average temp of 15 C and fixed cloud cover of 65%.
Add in ocean surface temperature variations with AMO, PDO, and deep water turnover of 500 to 800 years and you have lots of possibilities for a couple of degrees variation that last a couple of decades to a couple of centuries, but still only a couple of degrees off the 15C.
So when looking for what might be causing long term temperature trends, a good place to start is with what might cause long term cloud cover trends.
There are lots of natural short term changes from internal system variability but those are not the changes that have led to current concerns.
Long term trends affecting cloud cover relate to solar induced changes in the relative sizes and positions of the Hadley, Ferrel and Polar convection cells. Those changes alter the degree of jet stream meridionality which alters the length of the jet stream tracks. Longer tracks involve longer lines of air mass mixing and thus more clouds.
Total BS wild speculation ignoring planetary geometry and the greenhouse effect changes measured 365 days a year
Claims about the effects of clouds are not backed by data. Science requires data.
The earth’s atmosphere is gaining mass due to fossil fuel burning.
You are suffering from mass confusion.
Here is some data.
The interesting feature there is the plateau from the early 2000s.
There has been only a slight increase since then which is why expectations of a cooling trend have been frustrated.
The recent drop in solar activity was enough to reduce the earlier rate of cloud reduction with its consequent warming but not enough to eliminate or reverse it.
We need global cloud cover to increase much more in order to develop a cooling trend and until it does so we are still in the recovery period from the Little Ice Age.
That will require a longer period of reduced solar activity than we have seen so far.
Several even quieter solar cycles will be required leading to far more jet stream meridionality and much more clouds.
Much as I deplore the climate change cultists and their continual droning on about how humans are to blame as well as the scam artists pushing manipulated temperature records, do we really ‘need’ a cooling trend? I agree with Richard Greene on at least one point – I like the warming trend we seem to be on, I wouldn’t really mind if it stayed that way for a while longer.
The atmosphere is not gaining mass, the oxygen removed is greater in mass than the carbon added.
12 Gt of water are created from the oxygen consumed in combustion. More than half of the CO2 emitted is taken up by the biosphere and other sinks. Some of that oxygen is transferred to the ocean.
The atmosphere is not gaining mass, the oxygen removed by combustion and carbon dioxide sinks is greater in mass than the carbon added to the atmosphere.
12 Gt of water are created from the oxygen consumed in combustion. More than half of the CO2 emitted is taken up by the biosphere and other sinks. Some of that oxygen is transferred to the oceans.
Land biosphere uptake alone is estimated to be about 30% of emissions. While that oxygen is released in photosynthesis, photosynthesis in water transfers some of that oxygen to lakes and oceans.
So, while we add ~10 Gt of carbon to the atmosphere in a year, less than half of that remains there and more than 10Gt of oxygen is removed. So we actually reduce the mass of the atmosphere by more than 5Gt per year. Plus, only a portion of the ~6.6 Gt of oxygen taken in by the ocean CO2 uptake is likely released back to the atmosphere. So the atmosphere is likely reduced by ~10Gt per year.
Absorbed shortwave radiation has been increasing during the entire satellite era. It is highly likely that absorbed shortwave radiation has been increasing during the entire warming period. It is the primary driver of global warming.
2023 saw a large increase in absorbed shortwave radiation corresponding in the recent warming.
graph
This hits the nail squarely.
The reason is that land has increasing exposure to sunlight and has a highly positive response. Over an annual cycle, the solar energy input over land now ranges from 124ZJ to 152ZJ. That causes a temperature swing of 12C.
The sunlight over land bottomed in 1537. Since then it has increased reasonably steadily with some periods of acceleration and deceleration. Overall accumulated anomaly since the bottom is 20ZJ.
The sunlight over oceans has been declining but oceans have a small, non-linear response to solar forcing. The oceans have actually warmed in concert with the warming land surface because they have been transferring less heat to land. Hence retaining more heat.
Do we have a theory as to why the cloud cover has been reducing since 1537?
Cloud coverage data are only in the satellite era and do not reveal how much solar energy the clouds are blocking, which depends on the types of clouds and when they are present.
Cloud cover data goes back to the 1850’s, enough to be able to extrapolate from. We have far more data than just the short satellite era – why does everybody think observation only started when we put a satellite into orbit? That’s very lazy thinking.
Hmmm…”do we have a theory”
maybe Svensmark’s cosmic rays….maybe less aerosols from decreasing forested area….maybe less forested area as mankind burned off forests for hunting and agriculture…..it seems ocean surface temp has been increasing which logically should increase humidity and increase low level clouds causing cooling, but this is NOT THE TREND, so something confounds our logic…..if it was easy, there wouldn’t be continued papers with ECS somewhere between 0.8 and 6.0……
There may be less forested area than a century ago, but there is much more forest. But wildfire is down substantially, so less aerosols from that. CO2 uptake means much more photosynthetic efficiency and water efficiency; less stressed plants produce less cloud forming aerosols. Also, increased precipitation clears aerosols (dust, etc) and increased soil moisture means less aerosols from land. There’s also been changes in the amount, location, and methods of biomass burning. Plus, there’s been a reduction in tilling for agriculture.
Yes, that’s my question. Why is the cloud cover decreasing steadily?
Please show us your 1537 data. Possibly Magellan took those readings in his attempted circumnavigation of the world.
The Thames froze in January, enough for people to ride horses on it and it was a very wet and rainy summer.
1540, by comparison, was hot and dry for most of the year with little cloud cover – it was described as the ‘big sun year’.
The why is the warming mainly affecting TMIN?
The planet surface can only get rid of heat by radiation to the “sky”. A constant couple of watts input (or some approximation of that) causes slightly more warming at Tmin than it does at Tmax simply because of the T ^4 laws of radiation.
Article says:”Net approximately 242 W/m2.”
Well this can’t be true since we have measured temperatures on the ground above 100 F.
What ground ?
Yes. We have also measured temperatures of -100F. Planet is a big diverse place.
Phoenix for one.
We measure temperatures above the ground not on the ground
We have not measured 100 F everywhere simultaneously. The global average stays confined to a much smaller range as compared to specific locations.
I looked up the Wielicki paper (Ref 7 here). They point out that a decrease in albedo due to cloud decrease (said here to be the primary factor) also decreases the blocking of exiting IR by clouds. Those opposing effects are of comparable magnitude, and that is why it is still uncertain what is the sign of cloud feedback.
There are more reasons than clouds for albedo decrease, greening f.e.
The albedo decrerase is measured, isn’t it ?
But as Gabriel said, clouds are the primary albedo effect.
But not the only reason, that is the point.
Does anyone know for sure, as we continue to degrade our energy systems?
Like Nick said :
“clouds are the primary albedo effect.”
And
“it is still uncertain what is the sign of cloud feedback”
“There are two kinds of forecasters: those who don’t know, and those who don’t know they don’t know.”
I believe there is a third type. Those who refuse to accept that they don’t know.
Decrease in clouds allows more solar energy into the system.
Enhanced atmospheric CO2 does not put more energy into the system.
Your comment about balancing is meaningless.
As you presented in an other thread, the sunshine hours increased.
Even if the mythical “CO2 forcing” did exist.
It is WITHIN the system, therefore cannot add any extra energy to the system.
There is no evidence any energy is being “trapped” [lol] because of CO2, either.
In fact, OLR is increasing…
hate to say this bnice2000…..but OLR would increase through the atmospheric window if the surface temp had, for example, increased since 1985….which it apparently has….
“Enhanced atmospheric CO2 does not put more energy into the system.”
More CO2 and water vapor keep more heat in “the system”. Are you stuck on stupid?
The only thing raising temperature is CO2. H2O contains “latent” heat, i.e., does not raise temperature.
The greenhouse effect is a deflection of some upwelling radiation back down to Earth’s surface where it DOES heat the surface.
Since a majority of upwelling radiation does not get reflected back down, it is common for people to say the greenhouse effect “impedes the cooling”. Others say the GHE “traps heat”.
To be accurate, downwelling long wave radiation caused by GHE water vapor, CO2 or clouds DOES heat the earth. And you are wrong.
The back radiation cannot heat the Earth. The earth *lost* that back radiation when it sent it skyward.
What happens when the atmospheric temperature goes up? Hint: Planck is a negative feedback.
WV keeps about 93% of the energy
CO2 only about 3%, due to its very limited absorption spectrum, which limits CO2 mostly to 15 micrometer photons, of which it catches only a part, because WV molecules, at least 45 times more abundant near the surface, catches a much bigger part of the photons.
WV also STORES the energy by evaporation and in clouds, which is a continuous process.
The AR5 has a Chapter 7 on Clouds. They try to quantify these opposing effects thus:
” By enhancing the planetary albedo, cloudy conditions exert a global and annual shortwave cloud radiative effect (SWCRE) of approximately –50 W m–2 and, by contributing to the greenhouse effect, exert a mean longwave effect (LWCRE) of approximately +30 W m–2, with a range of 10% or less between published satellite estimates (Loeb et al., 2009). Some of the apparent LWCRE comes from the enhanced water vapour coinciding with the natural cloud fluctuations used to measure the effect, so the true cloud LWCRE is about 10% smaller (Sohn et al., 2010). The net global mean CRE of approximately –20 W m–2 implies a net cooling effect of clouds on the current climate.”
Reduced clouds still has a warming effect, but only 40% of what is said here.
Nick, I’m seeing a lot of “approximatelys, estimates, abouts, implies” in this excerpt.
Why don’t they say –
“at this time, we just don’t know”?
Good question!
They should admit the truth!
Hi Nick.
The cloud radiative effect shows different trends for the shortwave and longwave spectrums.
The SW radiative effect goes from around -45.5 W/m2 in 2000 to around -44.5 in 2022 according to Ceres data. Thus, more solar is let in through the clouds over time.
The LW radiative effect goes from around 26.4 W/m2 in 2000 to around 25.4 in 2022.
The net effect is more or less the same, but there is a redistribution from the LW side to the SW side in terms of the total effect.
The net global CRE effect is unchanged over time at -19.1 W/m2.
Picture here:
But it should not balance out, if it was just a decrease in cloudiness. The SW reduction should dominate the LW reduction, so to say. That is unless there is a relative increase in high altitude- on the expense of low altitude clouds. And that is the interesting part.
We massively enrich the atmosphere with artificial cirrus clouds which are not just warming, but also dimming the sun light to the natural water cycle below. What you might expect is a reduction in evaporation, less relative humidity and ultimately less natural low water clouds. All of which occurs.
Great comment, thanks!
And this is still way too simplistic – and wrong. In reality the LWCRE is more like ~75W/m2, not just 30W/m2. The largest of part of it is overlapped with other GH constituents. So it is 30W/m2 “net” and 75W/m2 “gross”.
These 45W/m2 in LWCRE that are overlapped with GHGs cannot be ignored, although “climate science” loves to do just that. Neither it can simply be attributed to GHGs (as they do it) OR clouds. It is just not how it works with overdetermined systems.
Simply concluding clouds were cooling is an epic and stupid blunder.
That argument doesn’t work. Simplifying things a bit, let’s say that the area of clouds over land decreases but their opacity is the same. Each unit of extra land so warmed emits the exact same LW as the previous land area, so the incoming SW and outgoing LW still balance exactly as you claim and the ‘new’ warmed land is at exactly the same temperature as the ‘old’ warmed land. But the area of warmer land has increased, so the global average temperature has gone up.
No, the new land warmed because of the extra sun, but cooled because it lost the downwelling IR from clouds.
ROFLMAO.
Nick has just totally destroyed the whole increasing GHE myth…
… and AGW with it…
Well done Nick ! 🙂
Nick is being at least partially correct here, clouds do increase downwelling IR as cloudy nights are typically much warmer than clear nights. Where I would disagree with Nick the difference in total downwelling radiative energy between a clear day and a cloudy day is greater than the difference between downwelling IR on a cloudy night and a clear night. This related to where warming from GHG’s will be more pronounced at the north pole than at the equator along with average temperatures going up more from increases in minimum temperatures than increases in maximum temperatures.
The whole AGW myth rests on increased WV downwelling caused by CO2.
As Nick clearly points out.
“ it lost the downwelling IR from clouds.”….
… this isn’t happening.
“Where I would disagree”
I don’t think we disagree. The IPCC put the effects in about a 100:60 ratio.
IPCC does NOT do science.. they do political gesturing !
Daytime clouds are a more powerful climate variable by blocking sunlight compared to their contribution to the greenhouse effect
CO2 does nothing so is reasonably neglected.
As to the observed change in thermalised solar. There is an analogy to this – chicken or egg.
Global land temperature has been trending up for a very long time. The atmospheric moisture over lend is not trending up in concert. It has risen but the trend has been almost static over land since 2000.
Less atmospheric water over land means less cloud, particularly in summer, so more solar energy gets thermalised rather than reflected.
There are far more powerful forces at play than a bit of soot or not in the air.
CO2 is neither carbon nor soot.
Correct. Bu I am not clear why you made the comment?
I did some quick complementary albedo research and found an interesting recent paper by Rugenstein and Hakuba in GRL (2023). They compared the two hemisphere albedo asymmetries in CMIP5 and CMIP6. CMIP6 did WORSE than CMIP5. Going the wrong direction again, just like with ECS divergence.
Interestingly, the ‘best’ model (defined as closest to the CMIP6 ensemble average asymmetry—which does [perhaps accidentally?] closely match CERES) was again INM CM5—the only CMIP6 model that does NOT produce a tropical troposphere hotspot, and with an ECS of 1.8C, closest of any in CMIP6 to the various EBM observational ECS estimates of about 1.6 to 1.7C.
I am more convinced than ever that we should throw the rest of CMIP6 out, and just rely on INM CM5 for future climate projections. Or, to paraphrase George Box, least wrong—and useful. (The actual quote, which Andy May has been using here recently, is “All models are wrong. But some are useful.”)
You can throw out the INM model as well. It also warms the SH and cools the NH relative to measured. It is as wrong spatially as all the others so has no merit. The fact that it is a closer match to the overall observed trend can be achieved by fiddling a single parameter.
If you want to know the average monthly temperature for a particular place on the globe in say 2100, you will be best served by just assuming it will be the same as the corresponding month in 2023 than looking at any climate model output. Until models can get spatial and temporal results close to what is observed they remain junk science.
A straight line fit to the observed temperature anomaly gives a regression coefficient of 70%. No model output can match that. Just extrapolating that straight line trend will be a better prediction than any climate model.
I respectfully disagree. is a GHG. Proven in 1859. So must have some effect. The only question is, how much. One way to answer that question is with parameterized climate models that replicate what we understand as observational reality,
CO2 cannot be a GHG. Attached is a specific heat table from a thermodynamics book. If CO2 caused any warming because of IR then the table would require an extra column for the air table. Also for the CO2 probably. One for with IR and one without and two different temperature increases would be shown.
CO2 does not cause warming by retaining heat in its mass. It causes warming by impeding the transport of energy that would have otherwise escaped to space. CO2’s specific heat capacity is mostly irrelevant at least in the context of this trapping effect.
The interesting question on how CO2 affects IR radiation transport relates to the very short mean free path (0.4m?) of a photon at a CO2 resonance frequency. This means that changes in CO2 will have only minor effects on the transport of IR energy at altitudes where weather takes place. It will have an effect at higher altitudes.
The more rapid CO2 related warming at night is innate to the climate system, because the night-time temperatures are inherently more sensitive to climate forcing.
The layer of air just above the ground is known as the boundary-layer, and it is essentially separated from the rest of the atmosphere.
At night this layer is very thin, just a few hundred meters, whereas during the day it grows up to a few kilometres.
It is this cycle in the boundary-layer depth which makes the night-time temperatures more sensitive to warming than the day.
The build-up of carbon dioxide in the atmosphere from human emissions reduces the amount of radiation released into space, which increases both the night-time and day-time temperatures.
However, because at night there is a much smaller volume of air that gets warmed, the extra energy added to the climate system from carbon dioxide leads to a greater warming at night than during the day.
This higher sensitivity of night-time temperatures has also affected the number of cold-extreme nights we have seen in recent years.
The number of extremely cold nights has dropped by half during the last fifty years, in contrast to the extreme-cold days which have decreased by a quarter.
It does not impede the transport of energy for more than a microsecond.
It DOES NOT trap heat anywhere… there is no evidence for that particularly mindless non-science conjecture.
Measurements have shown that any slight increase in CO2 absorption is more than balanced by an increase in the atmospheric window.
Did you know that when CO2 was tested as the gas between glass layers in double glazed windows, it actually an INCREASE in the heat transmission through the window compared to normal air.
CO2 is just another conduit for atmospheric cooling.
Totally clueless, as usual
Richard, you have many good interesting things to add to the discussions on this site. But your discourtesies detract.
Bringing attention to a behavior is in bounds. If I were the HMF, the karlomonte/bnice name calling would not be allowed
It’s a years long slide that suits the interest of WUWT. They earn from the Kramer effect of the juvenile name calling, and that’s why they allow it.
If I read BS and comment that I jus read BS, I accomplish two things:
I tell the commenter this is not a conservative echo chamber,
and
I challenge the other person to defend his conclusion.
If there are more facts and data to prove me wrong, I want to see them posted. But the usual response to a challenge is NO ATTEMPT to add facts, data and details. Just insults.
A real scientist would respond to skeptics by trying harder to prove his conclusion.
That too rarely happens here.
Because there are too many opinions here NOT supported by facts, data and logic. When they are challenged, all I hear is insults in response.
I would consider it to be a great learning experience if someone corrected any science related sentence in my comment and explained why I was wrong. And you would feel great proving me wrong online, or at least providing contrary evidence.
“When challenged, all I hear is insults in response.” But insults are not responses on the science. Ignore them. You seem to be a very intelligent man with much to say about our climate. I certainly learn a great deal from you. I strongly advise you stick with science as you see it and withhold the insults.
I beg to differ Richard – you usually call someone a ‘nutter’, a ‘denier’ or a ‘clown’ or ‘buffoon.’ This usually marks you out as someone with limited intelligence, little knowledge or nothing better in the way of arguments. If you’d stop such behaviour, so would everyone else.
His discourtesies and insults invalidates any argument he makes. If he cut them out people might read his posts.
It seems to on Venus where the atmosphere is many times more dense than Earth’s, nearly all CO2 and much closer to the sun. It seems we on Earth are fortunate to have oceans which removed most all of the primordial CO2 unlike Venus which has no oceans.
Planetary scale comparisons are interesting. As an example a lot of people incorrectly conclude that just because Venus experienced a runaway GHE that Earth could too. The thing is Earth cannot experience a runaway GHE because it is too far from the Sun meaning the absorbed radiation is below the Simpson-Nakajima limit thus preventing the tipping point from being reached. However, the Earth is still susceptible to what is called a moist greenhouse state in which the atmosphere saturates and gets really hot. But fortunately it is believed that it would take upwards of 10,000 ppm of CO2 to kickstart this effect. [Goldblatt et al. 2012]
Slight tangent…Earth will eventually undergo a runaway GHE. It’ll just take a billion years or more for the received radiation to exceed the Simpson-Nakajima limit due to the brightening of the Sun. This should occur before the Sun goes into its red giant phase in 5 billion years which would obviously cook the planet and its atmosphere entirely due to it being engulfed by the outer layers of the Sun. .
I am reliably informed by my doctor that I won’t make it to the Earth’s runaway. As to 10,000, would the oceans ever permit this, excepting collision with a huge dry ice asteroid? Not enough fossil fuels to do It, I think.
I don’t even think there is fossil fuel stock to even inject 1500 ppm of CO2. Proven reserves equate to about 500 ppm. Let’s assume 3x that can be recovered eventually. That’s 2000 ppm. The highest estimates I’ve seen for carbon hydrates is 10000 GtC or roughly 5000 ppm. That gets us to 7000 ppm. But 7000 ppm would not stay in atmosphere. Let’s assume 25% (it could a lot higher) of that could be buffered that brings us back down to 5000 ppm left in the atmosphere. So no it is questionable that 10,000 ppm is even possible. And that’s with both fossil and hydrate carbons.
CO2 either re-radiates any energy it absorbs or it passes it on through collision. Re-radiated CO2 energy *will* be mostly absorbed by other molecules before reaching the earth, even the downward radiation. Non-radiating molecules that receive collision energy get rid of it via other methods.
It *all* somehow gets sent into space, either through direct radiation or through latent heat loss.
As atmosphere temps go up its radiation goes up by T^4. In other words it radiates any increased energy at a much higher rate than it receives from downward radiation. According to Planck, black body radiation is a negative feedback. The more energy it gets the more it radiates at a higher rate, thus losing energy and returning to a state where energy in equals energy out, i.e. equilibrium.
mkelly
ThermoDUMBnalics instructor
And there you go again, you just can’t help yourself – if you stopped the insults, so would everyone else.
“If CO2 caused any warming because of IR”…
CO2 in the atmosphere absorbs electromagnetic energy. That electromagnetic energy is transformed to thermal energy. The air is now warmer. That much is settled.
Is that minute change in temperature significant relative to other factors, like the change in albedo? Probably not.
“That much is settled.” Except at the poles.
It does if you believe in the “greenhouse” fable. That is the only place where non-condensing, non-solidifing gasses alter the energy balance.
CO2 has no measurable direct affect ib the real physical world. It is questionable it is adding to atmospheric mass because there is no measurable change in atmospheric pressure as far as I know.
It contributes to greening and greening moderates the extremes in temperature.
The whole global energy balance as observed to be increasing “uptake of ocean heat” is, in fact, an upward trend in ocean heat retention which we know has been going on for a long time and there is no acceleration.
Clueless, Jr.
Of course it has a measurable effect. Countless NDIRs measures its energy trapping effect so precisely that it can distinguish changes in concentration of a 1 ppm in the cuvette.
BTW…there is a subtle irony here. Those who dismiss the GHE on sites like these get to do so because the same mechanism that causes the GHE (energy trapping) is also used to help control the HVAC systems that keep the data centers operational so that they can post their dismissals of it on the internet at all.
I don’t think anybody dismisses the effects of gases like that. We just don’t think they’re responsible for runaway thermageddon like the climate cultists believe.
They may be in the minority, but they do exist. Based on their post history it would seem mkelly and bnice2000, who happen to have participated in in this article, are in that camp. There are several regulars on Dr. Spencer’s blog who have no shame in proudly proclaiming their rejection of the GHE in its entirety.
The forces that shape Earth’s climate are far more powerful than the tiny additional mass that CO2 contributes. CO2 plays much the same role as any non-condensing, non-solidifying gas in the atmosphere but such a tiny amount that it is insignificant.
Water is what matters because it exists as solid, liquid and gas throughout the atmospheric column.
NDIR is not an energy measuring device. Writing such nonsense displays your ignorance.
You are making a massive leap that analysing EMR spectrum gives any insight into the global energy balance.
All the spectrum analysers have to be calibrated back to ocean heat content to get a meaningful number. On their own, they produce meaningless numbers with respect to energy.
And then there is the wild assumption that ocean heat “uptake” is a result of trapped heat.
Your CO2 nonsense is the modern equivalent of Ptolemy geocentric orbital models. So much mistaken fiddling to fit observations that are easily explained by orbital precession.
Ok. Well. That happened. Since I’m not currently in the mood to defend infrared spectroscopy, the 1LOT, and perhaps other well established laws of physics I’m going to let you have the last word here.
Rub, depends on what is a defined as a GHG.
What was proven in 1859 is that CO2 is a “radiatively active gas”.
Nothing about its action in the atmosphere was proven at all.
The term GHG was “invented” much later by “climate” non-scientists…
…. and is a total misnomer.
Here’s the spectrum of the Earth’s IR emission, notice the large notch in the centre which is due to the CO2 in the atmosphere absorbing IR emitted from the surface and preventing it leaving to space.
3235847a-d90c-4e12-b224-91c357a069b4
Yes, CO2 absorbs in a narrow band.. then what….
…. that doesn’t mean it causes warming.
Measurements show that the slight increase in absorption in the CO2 band is more than balanced by an INCREASE in the atmospheric window.
Nothing is being trapped.
Exactly, that’s how global warming works.
OLR has been increasing steadily as well.
So where is your evidence any energy is being “trapped”
“OLR has been increasing steadily as well.”
OLR is increasing because Earth’s surface is warming. It’s called global warming. Look it up.
Climate science claims that “global warming” will occur without an increase in OLR. Look it up.
As temperatures increase, the amount of thermal radiation emitted also increases, leading to more outgoing longwave radiation (OLR)
Yes, that is what’s happening. But, that’s not the way it is supposed to be happening. It appears you don’t understand the greenhouse effect at all.
Yes, but it’s warming because of SW radiation, not longwave. There seem to be large negative feedbacks to the longwave radiation. The top of the atmosphere imbalance is actually smaller than the supposed GH forcing.
.32w/m^2 (difference between change in -1.42SW out and +1.1LW out) and the 1.42 change in SW out. .32 is the maximum possible greenhouse effect contribution to warming.
So you have 1.42 warming from SW and <.32 from the GHE (some of the SW will be lost in the ocean so not all of the .32 is GHE.) The GHE is at most 22% of recent warming.
The AGW conjecture completely ignores the fact that good absorbers are also good radiators and whatever LWIR photons are absorbed are quickly radiated away.
The so-called greenhouse gases do not trap heat any more than any other gases in the Earth’s atmosphere. CO2, (unlike H2O) is just another gas as far as the atmosphere is concerned.
In fact, the non-greenhouse gases will tend to hold onto heat energy longer than the so-called greenhouse gases because the non-greenhouse gases are such poor LWIR radiators to space.
Since energy transfer by conduction, convection and bulk air movement totally dominates over energy transfer by LWIR absorption band radiation in the troposphere, means the fact that the so-called greenhouse gases absorb LWIR radiation makes little difference.
CO2 does absorb (and emit) IR. As the concentration increases you get more more absorption. However, you also get more evaporative cooling at the surface. These two elements appear to cancel out based on Miskolczi’s work with radiosonde data and Gray/Schwartz work with NCEP data.
The evaporative cooling then drives reductions in upper troposphere water vapor which allows more energy to radiate to space. This counters the added latent heat of condensation from the additional evaporation. This is why there is no hot spot.
Two balancing mechanisms, one near the surface and the other above the clouds.
The effect of CO2 in a lab is a good proxy for the effect of CO2 alone in the atmosphere. It is mainly the amount of water vapor positive feedback amplification that is in dispute.
As you said – alone. The effects of CO2 in a lab study the characteristics of CO2 in isolation. There have been limited studies (if any at all) looking at the atmospheric mixture of gases and how the characteristics of individual elements interact and overlap. That would be well worth looking at.
It was examined in a laboratory and those characteristics defined under ideal laboratory conditions, in isolation. It is not in isolation in the atmosphere – where is the observational data on its characteristics when mixed in the atmosphere? We know that methane is swamped by water vapour, how does CO2 fare? I’m afraid I don’t really buy into the idea “we don’t really know what happens but it must do something” without a bit more to go on.
How about the standard “All models are wrong, some less so then others.”, as RickWill identifies below INM CM5 has a long way to be claimed ‘fit for purpose’ and thus ‘useful’ for anything…
“youcantfixstupid”, but perhaps, just perhaps, you can learn to use “then” and “than” correctly.
Istvan is colluding with Russia and must be investigated by the Joe Bribe’em FBI
INM is the only climate comfuser game that at least gives the impression of trying to make accurate predictions
The others are climate scaremongering propaganda.
You’re just embarrassing yourself now.
Rud,
Box wrote “all models are wrong” in his famous 1976 article on modeling. Either he or someone else added the “But some are useful” part later. I was never able to find out who added the second sentence, or when they did it. See attached. Maybe someone else knows?
Amazing, after all these years of soot reduction from low temp, lump coal and fuel oil compbustion, better refining, increased filtering efficiency, and smog reduction, that albedo is still reducing. And all so very confusing after being told fos so many years, in fact decades, that soot, volcanic ash and dust played so little part in temperature change.
Odd, too, that “global greening” increased conversion of radiation to carbohydrate through photosynthesis, should havve the effect of increasing thermal energy all while decreasing albedo.
Meanwhile, we continue to change the albedo by the use of concrete and tarmac. There is a better correlation between built up area increase and temperature than there is for CO2
Tarmac or macadam increase absorbtion of the surface, cured concrete and lightly colored masonary decrease absorbtion and increase reflectivity. Plowed ground increases absorbtion, while it is damp, while dry soil, growing plants, or grass pasture will each change the surface reflectivity.
On a global basis, it is ulikely that re-radiation to the atmosphere from changes to surface covering is measurable or predictable.
Is there really a consensus on the global effect of engineering and agriculture on the amount, or even the direction of the change in terrestrial albedo?
According to Loeb the albedo change is a feedback of warming; not a cause. See [Loeb et al. 2021] and [Hansen et al. 2023].
https://wattsupwiththat.com/2024/03/05/the-continuing-albedo-change-warms-the-earth-more-than-twice-as-much-as-co2/#comment-3878381
Yes, that is the key. What caused cloudiness to diminish? Very likely, rising T. And what caused T to rise? GHGs. GHGs count as a driver of T, because their concentration does not depend on T (well, CO2 does because of solubility, but that is a small effect, itself a positive feedback). Cloudiness does depend on T, and it is hard to see why it would change otherwise.
Well… that was proper non-science, incoherent nonsense. !
You know I thought the same thing.
CO2 -> T+ -> water vapor+ -> clouds+
Hmm, since warm air holds more water then cold air & a warming planet would logically lead to more evaporation of the oceans leading to more water vapor being available I’d expect a warming planet to be more cloudy not less…perhaps you can explain the mechanism by which a rising temperature leads to less clouds…
Clouds are complicated. More clouds does not necessary mean less warming. In fact, more high clouds or more nighttime clouds mean more warming. It is only low level daytime clouds that can act to reduce the warming. It also important to point out that more water vapor does not necessarily mean more clouds. Ceteris paribus that is only true if relative humidity also increases. The general rule is that relative humidity increases when specific humidity increases at a rate greater than 7%/C. It turns out that although specific humidity is increasing it’s not increasing at a rate fast enough to even keep relative humidity constant. There are several other important factors like the mixed phase state, optical depth, mean altitude, etc. that all change as a result of warming. The net effect of all of these changes is looking more and more likely to result in a positive feedback.
Thanks for the lengthy description, though I’ve seen it before (at least similar)
Even so this isn’t on topic to my question to Nick. Specifically he claims that an increase in T is “very likely” the cause of a decrease in clouds…I provided 2 potentially naive but in 1st order reasons that would increase cloud cover due to increase in T. Nick claiming something is “very likely” means he should be able to easily show legitimate and obvious ways that increased T leads to decreased cloud cover.
It’s the Clausius-Clapeyron relationship. When T goes up by 1 C the saturation vapor pressure goes up 7%. The consequence is that water vapor content needs to increase by 7% for every 1 C to maintain the same relative humidity. As a general rule (though it is complicated) you have more clouds when RH goes up and less clouds when RH goes down.
It turns out that specific humidity is increasing as expected but relative humidity is decreasing. Again…this is because the water vapor is not increasing at a rate of 7%/C. It is increasing at a slower rate. The faster T goes up the faster RH goes down.
Thanks bdwgx for clarifying this.
Clouds do NOT cause more warming. They may reduce the gradient of cooling, but the earth still cools. That is not warming.
Tmin is more controlled by the dew point when water vapor emits as it precipitates.
It might be interesting to mention that at one point scientists believed that the cloud feedback was net neutral or even possibly negative despite the reduced relative humidity. This was at least partially the result of models overestimating the ice content in mixed phase clouds. In a warming environment it was thought that the ratio of ice-to-liquid in clouds would decline resulting in more liquid dominant clouds which 1) last longer and 2) have higher optical depths. Field observations over the last 2 decades has shown that we have probably overestimated the ice content in clouds. This means that there is less ice to convert to liquid which means we probably overestimated both the longevity and optical effects of the feedback. As a result the negative part of the cloud feedback may clamp out sooner than expected thus the positive part of the feedback latches in sooner as well.
Things would be lot simpler for climate “science” without that pesky sun always complicating the conjectures about how things work.
Things would be alot easier for climate science if it wasn’t for all the faux climate “scientists” simplifying a highly complex, dynamic and apparently “self managing” process.
“And what caused T to rise? GHGs.”
Unsubstantiated BS !!
Not according to climate models.
Climate models predict this behavior. See [Donohoe et al. 2014] for details on the shortwave feedback and why it is expected that both ASR and OLR will increase.
See figure 1 in Trenberth/Fasullo 2009. That’s not what has happened. The models predict the clouds decrease late in the century, not now.
Figure 1 from Trenberth 2009 isn’t relevant since it does not show how ASR and OLR have changed. It also isn’t a prediction. It’s just a depiction of the current state.
Yes. As I discussed elsewhere in the comments early climate models showed a more neutral cloud feedback response. We now know that it is more likely that the feedback is positive.
I agree. The RH over land is not rising in concert with the increasing temperature so less cloud over land resulting in more solar being thermalised. Most noticeable in August and September with less heat advection from ocean to land during those months. So more heat being retained in the oceans.
All consistent with the accumulated solar anomaly over land now up 20ZJ since it bottomed in 1537.
I argued otherwise in my 2022 paper – “The patterns of behaviour of clouds, both for cloud area and cloud optical thickness, are studied over the period of available data, 1983 to 2017. There was a decrease in cloud cover over the study period, while global surface temperatures increased. The patterns of clouds and temperature indicate that the cloud cover decrease could not have been caused by the increased surface temperature.“.
I read the paper. I have 3 primary concerns.
1) You conclude that higher temperatures lead to more clouds by showing a positive correlation between temperature and clouds on a short time scale. This is problematic for two reasons. :First…correlation does not imply causation. Second…this was done using data that shows an increase in temperature coincident with a decrease in clouds on a longer time scale.
2) You hypothesize that an increase in clouds should follow an increase in temperature because more water is evaporated. But this is an overly simplistic view since generally (the details are complex) more/less clouds occur with higher/lower relative humidity. Just because specific humidity might increase does not necessarily mean relative humidity will increase. You haven’t shown or even hypothesized a mechanism for why specific humidity changes should exceed (or even just stay the same) the canonical 7%/C rate from the Clausius-Clapeyron relationship. If this rate is not satisfied then relative humidity will decrease even though water vapor content is increasing in absolute terms.
3) You do not actually provide an alternate hypothesis for the decrease in clouds. Yeah, I see proposition (b), but it is not actually a hypothesis. It’s just an untestable “nuh-uh” statement.
According to climate models the warming feedback is not due until the late 21st century. In fact, they show an initial increase in clouds.
The decreasing trend in relative humidity is the main driver of the decreased trend in cloud cover. Because of the limited availability of water vapor sources over land, terrestrial clouds are more likely to be humidity limited.
The ocean heat advection to land in August and September is down. So RH over land is declining particularly in those months. More sunlight is being thermalised as a result. Oceans are retaining more heat as a result. Oceans are doing less of the heavy lifting to keep the land warm as the sunlight over land increases under the changing orbit.
It is really important that northern land masses retain vegetation to help retain atmosphere moisture over land.
Building offshore wind turbines that reduce ocean advection in summer is really bad for the climate. Replacing vegetation with solar panels is really bad for the climate.
How often have government policies achieved the opposite of what they were supposed to do because of muddled thinking.
About the same often as someone with influence can see a way to profit because of some particular government action.
One possible cause of the lower humidity is reduced evapotranspiration due to increasing ocean microplastic pollution.
Theoretically, anything that makes water less pure will lower evaporation. As global population increases as well as prosperity, more plastic is being used. The question is whether this change is significant enough to cause a measurable effect.
Seems like a pretty easy thing to measure. But, I doubt we will see any scientific experiments documented. That would challenge the climate change narrative which we know is verboten.
As there are several reasons for the albedo decrease, it should be interesting to have a closer look at the starting points of these changes to find out if there are logical follow ups.
F.e. an earlier starting of greening may lead by little warming to a small decrease in clouds, what may leed to a further warming.
More green is beneficial. The farming practices of the 1930s in the USA were a probable cause of the high land temperature in that time.
The rainforests of South America, Borneo and India are almost indistinguishable from ocean in their temperature response to solar forcing because they retain so much near surface moisture. They get preferential monsoon because they respond a little faster to solar forcing on a daily basis than the adjacent ocean water.
Some of the recent greening in north-central Africa have been due to improved land management plus the increase in CO2. Primarily concerned with retaining surface moisture.
The “Climate Change” groups have it backwards. They are calling the effect the cause.
Oceans store up solar heating for many decades so the increase in solar irradiance over the last 100 years has warmed the oceans and they have warmed the atmosphere.
https://lasp.colorado.edu/lisird/data/nrl2_tsi_P1Y
The warming oceans have been releasing CO2 as they warm like beer does when it is warmed.
There are about a million times more water molecules in the ocean than CO2 molecules in the air, and the CO2 molecules are just receiving are reradiating the heat from the ground, which isn’t very hot.
BS
A one degree C, increase of ocean temperature since 1850 might release a mere 15 to 20ppm of CO2. The actual atmospheric CO2 level increased 140ppm
Drink less beer before posting
The ocean has been taking CO2 from atmosphere. It is a net absorber. Specifically of the 670 GtC humans put into the atmosphere the ocean took 175 GtC. The nuance here is that the ocean also warmed which means it became less effective at taking carbon. At a 1 C change we expect about a 4% differential. What this means is that the amount the ocean was able to take is about 4% less because it warmed by 1 C relative to if it hadn’t warmed at all. This means there is about 7 GtC more in the atmosphere than if ocean hadn’t warmed. That doesn’t mean the ocean outgassed 7 GtC. It means the ocean lacked the ability to take the 7 GtC. [Friedlingstein et al. 2023] [Takahashi 1993]
Each part per million of CO2 in the atmosphere represents approximately 7.82 GT of CO2.
1 ppm = 2.13 GtC
1 ppm = 7.82 GtCO2
But you did make me realize a mistake. I computed the 4% offset from 175 GtC uptake when I should have done it relative to the actual carbon amount in the atmosphere of 895 GtC. So that should have been 0.04 * 895 GtC = 36 GtC = 17 ppm.
So text above should have read…
This means there is about 36 GtC more in the atmosphere than if ocean hadn’t warmed. That doesn’t mean the ocean outgassed 36 GtC. It means the ocean lacked the ability to take the 36 GtC.
This is a reminder for myself to always double check my calculations. Anyway, thanks for bringing that to my attention.
It’s the sun stupid. (the sky is blue)
” (the sky is blue)”
On Earth, from low elevation, and on a clear day.
Otherwise not so much. Regardless, there is interesting physics involved.
It’s a quarter to midnight here, the sky is black.
Stokes,
You quote the AR5 concerning the Long Wave Cloud Radiative Effect as an authoritative reference. They were certainly not. Clouds can certainly vary randomly. Your BS is relentless. You used to have a real job.
If only you had the vision of Greta you could plainly see that CO2 increase is the reason for albedo decrease.
That was actually first hypothesized by Arrhenius back in the late 1800’s.
Oxygen in the stratosphere absorbs UV radiation with a wavelength of less than 242 nm and ozone is formed. Ozone absorbs UV B radiation. If solar activity decreases, the amount of UV photons with the shortest wavelength decreases, and ozone production decreases. As a result, more UVB radiation reaches the Earth’s surface. In the troposphere, only clouds can partially block UV radiation.

A decrease in temperature in the stratosphere indicates a decrease in ozone.
https://en.wikipedia.org/wiki/Ozone%E2%80%93oxygen_cycle
Most of the ozone production occurs in the tropical upper stratosphere and mesosphere.
The conclusion is that both galactic radiation at high latitudes and UVB radiation near the surface at mid-latitudes increase during periods of low solar activity. Therefore, susceptibility to mutations in the biosphere may increase. We feel this, on ourselves, as strong burning radiation.

Solar irradiance may peak in the visible but a large fraction of it is still in the infrared. How does this factor into albedo changes and net irradiation?
Three is more solar energy reaching Earth’s surface. The author pretends to know why with incomplete data.
He primarily blames clouds without having an annual global average cloud statistic. Different types of clouds also have different effects on the climate. And night clouds have different effects than day clouds. Too little is known about clouds to know exactly how they are affecting the climate.
The only cloud coverage data are the percentage of cloud coverage, which DOES NOT reveal exactly how much solar energy is being blocked by the clouds. Nor does that percentage reveal the greenhouse effect of clouds.
The author is speculating without competent accurate data on the effect of clouds
We do know reduced SO2 pollution increases solar energy reaching Earth’s surface. The author claims that variable is minor. But the average temperature difference between the NH and SH is only 0.2 degrees C. in the UAH database. That seems too small to support the author’s conclusion about the small effect of reduced aerosols,
The author is also guessing about the effect of land use changes. Land use changes do not affect the 71% of Earth’s surface that are oceans. They may affect some of the 29% of Earth’s surface that is land. That means land use changes are unlikely to affect more a very small percentage of Earth’s surface. I doubt if the percentage would exceed 10%.
Most important, however, is the author’s claim to know how much global warming is caused by CO2 emissions. The author claims to know. He does not know.
If albedo changes were the primary cause of warming, the result should be mainly new TMAX records after 1975.
If greenhouse gases were the primary cause of warming, the result should be mainly TMIN records set after 1975
Since 1975, about 2/3 of new temperature records have been TMIN, and one third have been TMAX
That suggests greenhouse gases (also some increased UHI) have had a larger effect than the amount of sunlight reaching Earth’s surface (from whatever cause).
It is also worth mentioning that all Arctic warming has been in the colder months of the year, with little sunlight. That warming could not be related to solar energy.
And Antarctica is not warming at all, which is expected from increased CO2 because most of the continent has a permanent temperature inversion.
The author has a modest anti-CO2 bias. His article is rejected for my daily blog recommended reading list because too many conclusions are not sufficiently backed by accurate data, in my opinion.
The Honest Climate Science and Energy Blog
You are so foreseeable and laughable. 😀
Always nice to hear from my number one fan, Hairy Krishna.
Richard,
The purpose of the article is to establish that albedo change is a fundamental aspect of global warming, and more important than the CO2 in terms of its direct warming effect. A lot more scientific focus should be on understanding and explaining what’s going on in the SW (solar related) part of the spectrum, as it has some precedence over the LW greenhouse effects.
Thus, with all due respect, my article is not about the underlying causes of the albedo decline. I mentioned a few of the possible factors in one short paragraph, just to point in the direction of clouds (and humidity) as the main factor, and with references given to G.Stephens work on albedo.
You say: “We do know reduced SO2 pollution increases solar energy reaching Earth’s surface. The author claims that variable is minor. But the average temperature difference between the NH and SH is only 0.2 degrees C. in the UAH database. That seems too small to support the author’s conclusion about the small effect of reduced aerosols”
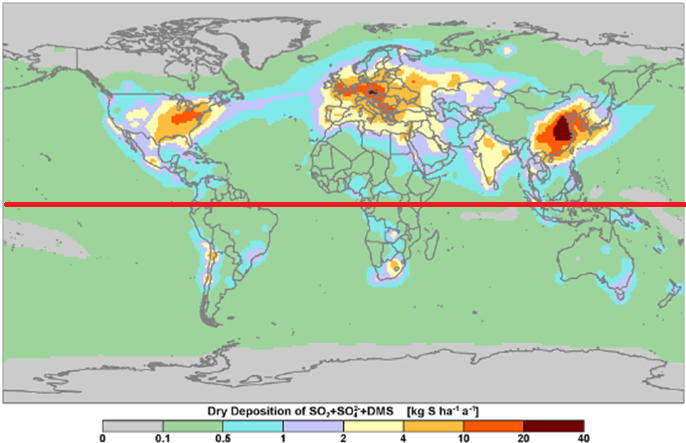
My point is that the albedo difference between the NH and SH almost doesn’t change over time. Aerosols do have a local, short-term effect (up to a few weeks) that mainly affects the NH, thus the reduced SO2 pollution should have given an effect. See the map for an illustration:
Therefore, the structure and variability of ENSO is mainly related to the intrinsic dynamics of the tropical atmosphere caused by ozone in the lower stratosphere, resulting in the expression of zonal wind variability along the equatorial Pacific region, both at the surface and in the upper troposphere. It is therefore more likely that the energy that drives ENSO does not come from the surface, but from ozone-related regulation of incoming solar UV-B radiation.
We have shown that ozone regulation not only peaks during austral summers, but is significant throughout the ENSO life cycle. Therefore, it can be argued that ENSO initiation is primarily the result of small tropical perturbations in the central Pacific in the physical and chemical properties of the atmosphere that determine the balance of ozone in the lower stratosphere and the amount of solar UV-B anomalously warming the upper troposphere.
https://www.nature.com/articles/s41598-017-05111-8
T. Landscheidt has shown that El Niños are sun driven and forecasted 2 excactly and a third with some days difference.
STORY TIP;
calling an Ice shelf a glacier…
read on
https://www.sciencealert.com/radical-plan-to-stop-doomsday-glacier-melting-to-cost-50-billion
From the above article:
“All life on Earth (somehow) originates from the Sun’s heat.”
(first sentence of body text)
Not true.
Animal/bacterial and plant life (mainly crabs, gastropods, tube worms and thermophilic extremophile bacteria, archaea and algae) found on the ocean seafloor near hydrothermal vents are not at all dependent on solar radiation that Earth intercepts. Instead, the thermal energy that allows such life to exist comes from the heat in the Earth’s interior that is residual from its formation (gravitational agglomeration of early solar system debris), as supplemented by heat released from nuclear fission decay of minor amounts of radioactive elements/compounds contained therein.
Scissor’s comment of March 5, 2024 5:04 pm bears repeating.
I know what you mean, but to be pedantic they kind of are. If it weren’t for the radiation of the Sun the Earth would be entirely exposed to the cold of space…3 K. The surface of Earth would thus only be heated by radiothermal and tidal forces yielding only about 0.1 W/m2. In other words Earth would be so cold it is unlikely that any life whatsoever (including extremophiles) would exist at all.
The heat of the inner earth doesn’t have the sun as source.
No offense…but duh.
This is a great and clear analysis. Hopefully it doesn’t lead to a flood of hare-brained ideas for Geo-engineering to increase albedo. That’s exactly the sort of thing I’ve grown to expect from the caliber of academics, political leadership, administrative elite and fashionable idiots who plague our society.
Vegetation will be labeled a planet killer and fires will be seen as a solution. Growing food will be restricted due to the reduced albedo of healthy crops. Large schemes to cover bodies of water with mirrors will become state-wide mandates (we’ve already done the same to swaths of pristine desert so why stop on dry land).
“Chemtrails” will become the new net zero and all fossil fuels will be dedicated to keeping every functional aircraft aloft for as much time as possible so as to increase cloud cover.
Before long certain colors of clothes, hair and skin will be seen as heat inducing and there will be all kinds of “guidelines” to reduce their frequency and possibly even genetic engineering to make more albinos.
Perhaps I’ve said too much. My scheme for world domination could be stolen by some radical leftist and then my dreams of power and money are for nought. I suspect a certain Hungarian billionaire is already hiding in the dark rubbing his hands with glee while he signs check to unemployed arts students and floundering democratic prosecutors to start the ball rolling.
One interesting aspect of the CERES data is its ability to test Lindzen’s Iris hypothesis. It is a dagger into the heart of his theory. I think it is premature to say Lindzen’s theory is dead, but CERES sure is driving the dagger deep and hard.
No its not. There is still no ocean surface sustaining more than 30C over an annual cycle. It is the reason oceans are retaining more heat. The NH summer water cycle is slowing down as the sunlight over the NH increases. There is less heat advection from ocean to land particularly in late summer.
The heat retention in the oceans is dominated by the water abutting the land around the North Atlantic and Arctic Ocean. The Southern Ocean and vast regions of the Pacific ocean west of South America have retained less heat.
I can’t see that your response has anything to do with my post.
Oxenstierna? If that is your family name, then you may be descended from one of the wisest men who ever lived:
Count Axel Gustafsson Oxenstierna, 1583–1654, Chancellor of Sweden, 1612. After the death of Gustavus Adolphus at Lutzen in 1632, the dominant member of the council of regency and virtual ruler of Sweden.
In a letter to his soon he wrote: Nescis, mi fili, quantilla sapientia regitur mundus.
{Learn, my son, with how little wisdom the world is governed.}
👋
In 1. above you use ln. Shouldn’t that be log2 (C2/C1). If you use ln you should use
Log2 (X) = ln (X) / ln (2)
Ln 2 ≈ 0.6931
Hi Walter.
It’s a matter of choice which log base to use. It’s convenient to use ln for this kind of problems, where you have a small growth rate in an accumulating variable, like the CO2.
ΔlnY(t) =lnY(t) − lnY(t−1) = ln (Y(t) / Y(t-1))
= ln(1+ΔY(t) / Y(t-1))
where the last quota is the growth rate, and the bolded part is the quota I used.
If you Taylor expand that, you can drop all higher terms for small growth rates, and you get:
ΔlnY(t) ≈ ΔY(t) / Y(t−1)
This easy way of calculation gives a close approximation for small growth rates.
Here is a nice explanation of why we use ln in growth problems:
https://betterexplained.com/articles/demystifying-the-natural-logarithm-ln/