From Dr. Roy Spencers Global Warming Blog
Roy W. Spencer, Ph. D.
The Version 6 global average lower tropospheric temperature (LT) anomaly for January, 2024 was +0.86 deg. C departure from the 1991-2020 mean, up slightly from the December, 2023 anomaly of +0.83 deg. C.

The linear warming trend since January, 1979 now stands at +0.15 C/decade (+0.13 C/decade over the global-averaged oceans, and +0.20 C/decade over global-averaged land).
New monthly record high temperatures were set in January for:
- Northern Hemisphere (+1.06 deg. C, previous record +1.02 deg. in October 2023)
- Northern Hemisphere ocean (+1.08 deg. C, much above the previous record of +0.85 deg. C in February, 2016)
- Tropics (+1.27 deg. C, previous record +1.15 deg. C in February 1998).
The following table lists various regional LT departures from the 30-year (1991-2020) average for the last 13 months (record highs are in red):
| YEAR | MO | GLOBE | NHEM. | SHEM. | TROPIC | USA48 | ARCTIC | AUST |
| 2023 | Jan | -0.04 | +0.05 | -0.13 | -0.38 | +0.12 | -0.12 | -0.50 |
| 2023 | Feb | +0.09 | +0.17 | +0.00 | -0.10 | +0.68 | -0.24 | -0.11 |
| 2023 | Mar | +0.20 | +0.24 | +0.17 | -0.13 | -1.43 | +0.17 | +0.40 |
| 2023 | Apr | +0.18 | +0.11 | +0.26 | -0.03 | -0.37 | +0.53 | +0.21 |
| 2023 | May | +0.37 | +0.30 | +0.44 | +0.40 | +0.57 | +0.66 | -0.09 |
| 2023 | June | +0.38 | +0.47 | +0.29 | +0.55 | -0.35 | +0.45 | +0.07 |
| 2023 | July | +0.64 | +0.73 | +0.56 | +0.88 | +0.53 | +0.91 | +1.44 |
| 2023 | Aug | +0.70 | +0.88 | +0.51 | +0.86 | +0.94 | +1.54 | +1.25 |
| 2023 | Sep | +0.90 | +0.94 | +0.86 | +0.93 | +0.40 | +1.13 | +1.17 |
| 2023 | Oct | +0.93 | +1.02 | +0.83 | +1.00 | +0.99 | +0.92 | +0.63 |
| 2023 | Nov | +0.91 | +1.01 | +0.82 | +1.03 | +0.65 | +1.16 | +0.42 |
| 2023 | Dec | +0.83 | +0.93 | +0.73 | +1.08 | +1.26 | +0.26 | +0.85 |
| 2024 | Jan | +0.86 | +1.06 | +0.66 | +1.27 | -0.05 | +0.40 | +1.18 |
The full UAH Global Temperature Report, along with the LT global gridpoint anomaly image for January, 2024, and a more detailed analysis by John Christy, should be available within the next several days here.
The monthly anomalies for various regions for the four deep layers we monitor from satellites will be available in the next several days:
Lower Troposphere:
http://vortex.nsstc.uah.edu/data/msu/v6.0/tlt/uahncdc_lt_6.0.txt
Mid-Troposphere:
http://vortex.nsstc.uah.edu/data/msu/v6.0/tmt/uahncdc_mt_6.0.txt
Tropopause:
http://vortex.nsstc.uah.edu/data/msu/v6.0/ttp/uahncdc_tp_6.0.txt
Lower Stratosphere:
/vortex.nsstc.uah.edu/data/msu/v6.0/tls/uahncdc_ls_6.0.txt
We await the trendology clown show.
Unfortunately Monckton no longer seems to post here.
He means you and your lot, delusional one.
What, no – how could that be. Oh, why can I never understand sarcasm.
caught out making a moronic comment.. now backtracking.
loser. !
Say what you want, Bellman. You still can’t let go of y=mx+b.
Here’s a loess fitting if you don’t like straight lines.
Gotta use those El Ninos while they are there, hey..
Another totally meaningless graph because it is based on those transients.
Roy Spencer himself and UAH also use linear regression for their trends. It’s right there in his post:
Monkton bases his entire “no warming since…” nonsense on linear trends.
No one here questions linear regression until it suggests something they don’t like. Suddenly, linear trends must be ‘let go of’.
What gives here? For months on end and over several periods Monckton suggests global warming has stopped because the short term linear trend says so. He is cheered to the rafters.
The UAH long term linear warming trend increases to +0.15C / dec and suddenly linear trends are persona non grata.
Make your minds up, guys.
It may be hard for you to understand, but not all people here share the same opinions.
Linear trends or central tendencies, in general, hide a lot of important detail. You can’t isolate overall energy uptake as a variable from temperature measurements, even when averaging over time. Bellman doesn’t know the value of the data points, and you probably don’t either.
I can see the data points as plainly as you can, and Bellman, and Roy spencer, for that matter.
Of course there are variations in the data. That’s why charlatans can manufacture short-term trends.
But the long-term linear trend in UAH, the one Roy Spencer and the UAH team publish with each monthly update, is consistently one of warming and it is statistically significant.
You did not understand what I wrote.
Possibly not, and I don’t wish to be rude.
But I am just referring to the temperature trend, which is the subject of this article.
I get the same linear trend from the temperature data as Dr Spencer does.
It’s not my opinion, it’s just maths.
What is the ‘temperature trend’? Do the data points hold any value, any real-world representation? That’s the main point.
What do you think ‘statistically significant’ global warming means? There IS a difference between a collection of data points and the real world; surely, you would know that.
I can collect a graph over time depicting the amount of hours I sleep and could get a statistically significant increase, yet it would mean absolutely nothing if my starting point was a week with less sleep. It would only be significant because of the y-axis.
*only be significant
because of the y-axisbecause of the starting point*It’s the trend in the data, as calculated by linear regression. Do it yourself on a spreadsheet. See if you get a different number to me or Dr Spencer.
The data come from ‘real world’ observations; in this case microwave sounding instruments from satellites.
I said the warming trend in the data are statistically significant, meaning that the probability of the observed warming happening by chance in a system where there is no trend are less than 5%, based on the data series. Again, this is counting, not opinion.
We’re back to short data series here. UAH monthly has 542 datum points now, more than enough to draw strong statistical inferences, unless you now want to start questioning statistical mathematics?
Yep, you are TOTALLY RELYING on the short-term warming transient of the major El Nino events.
As you said yourself, relying on short term events is mathematically idiocy.
Putting monkey-type linear trends through data that is driven by transient-events, is meaningless mathematics… period.
Almost as stupid and meaningless as putting a linear trend on oscillating data.
But it is all you have.
I have done it, and I’m not challenging the derived equation. If you are familiar with measurement uncertainty, you should know that when you average measurements together, you are assuming that the conditions are taken under repeatable and consistent conditions because the goal is to obtain a representative sample of all measurements.
I collected observations of a single average from the years 2000 to 2023 at a nearby station and demonstrated that isn’t the case. I’d invite you to click on the click and see that for yourself. Temperature is very delicate, as you would know, and it varies significantly over short distances with complex terrain (pretty much everywhere on Earth). If you’re arriving at the same average under a multitude of different conditions, what use is that average?
You need to understand that a statistical model treats all data uniformly without attention to context. That was the point I was making with my example: you’d get a statistically significant trend, but you could draw a false conclusion from the data if you don’t know the context. If you want to understand what climate is doing, you have to take into account the non-linearity and dynamics of the system. What if an event that occurred 32 years ago doesn’t manifest itself in the data until 16 years later? There are also feedbacks, and individual locations can undergo significant outlier events that raise the average disproportionately. That’s why we use the term ‘trendologist’ to describe Bellman. He doesn’t grasp the limits of linear regression.
Except the data is far from linear… so basically just a meaningless value.
And of course, it relies TOTALLY on El Nino events. !
Exactly!
The use of a “global average anomaly” is a statistical shell game. It hides the variability and range that’s apparent at each station with a simple averaging trick.
What if instead of all the averaging done to get anomalies, just the daily highs for a station were averaged for a month, and that plotted as a data point? Then the entire series of Januaries, Februaries, etc., could be plotted over the life of each station and a trend calculated for each month at each station.
I did this with the USCRN data and found that about 30% of the stations demonstrated a cooling trend over the life of the station. Of course, that result was wiped out by averaging that showed a warming trend for the US.
The averaging also removed the need to explain why those cooling trends existed in the first place.
Anomalies are misleading, being averages of averages of averages. They have no place in science.
On the contrary many global average temperature datasets (like UAH) provide the gridded data which shows the variability and range.
Yep. You can do that.
If you wiped out data while computing a spatial average then you’ve done something wrong. Other datasets that compute a spatial average temperature do not delete the underlying data as part of that step. That data is still there and can be used for other kinds of analysis.
It shouldn’t. Computing a statistic does not remove the need to explain other statistics. If anything it adds the need to explain more.
You’re not going to be satisfied with temperatures in general then since both the C and F values are themselves anomalies. The C baseline is the freezing point of pure water. The F baseline is the freezing point of salt brine solution.
Not this nonsense again — 0F and 0C are not “anomalies”, they are constants defined by international metrology agreements.
I must not have expressed myself well, because you missed my point every time.
I didn’t wipe out data. It’s still in the database. My point was that if you have 70% of the stations showing warming trends and 30% showing cooling trends, averaging just shows a warming trend for the country. The end user — a person just reading the headlines — only sees “it was the hottest year ever”, and never knows three out of ten stations are cooling.
A statistic not presented does not have to be explained.
In other words, GAT anomalies tells nothing about climate.
Then what’s the problem?
Assuming the stations are evenly dispersed spatial then yes that would mean there is a warming trend for the country. That’s just how it is.
Nobody is stopping that person from looking at the individual station records.
Individual station data and statistics are presented so I’m not sure what you think the issue is here.
The problem is not the type of line or the direction of the trend but rather the short time span for which data were available. A zillion-zillion perfectly accurate data points with pico-second resolution and 100% planetary coverage would be great, but would not resolve the question “how will it look in 100 years?”
Warming had stopped.
Then we got a strong El Nino.
Absolutely nothing to do with CO2 or any other human causation.
UAH shows warming ONLY at those El Nino events.
They are all you have..
Between those El Ninos.. NAD, ZIP.. NOTHING !!
But when one arrives you start yapping like mindless little chihuahuas.
Come on, fungal spore…… show us evidence of warming by atmospheric CO2
You know you have been a complete and utter FAILURE for several years now.
“Let’s go round again….”
We did not get a strong El Nino.
We got a moderate one, which is already fading (peaked in late November).
Before that we had a series of 3 La Ninas, which subdued global surface temperatures.
This is just the natural movement of existing heat between ocean and atmosphere.
It does not explain the additional warming that we are all seeing and feeling.
Look at the data…. The energy released and it widespread result.
This El Nino released a LOT of energy.
This spread rapidly over the whole tropics and further.
Only a completely and deliberately blind moron would not see that.
There is no “additional warming” that is just a figment of a deluded, crazed and brain-washed chicken-little mind.
The only warming in the satellite record has come from a couple of major EL Nino events, like this one.
As you say.. TOTALLY NATURAL !!
With absolutely no evidence of any human caused warming in the whole satellite record.
“It does not explain the additional warming that we are all seeing and feeling.”Really? I don’t feel any “additional warming”!
It is the empty space in his skull that is overheating from the adrenalin rush due to its manic panic.
Apart from though unfortunate people living in concrete urban ghettos, no-one on the planet has experienced any “noticeable” warming.
If you look at the graph, you can see that the 2015-16 El Nino peaked and declined more rapidly than what the current El Nino is doing.
What “additional warming?”
That wasn’t who we were waiting for, Chuckles!
It’s appalling to see there’s a faction at WUWT who can’t handle the simple truth that global temperatures have been rising substantially since May ’23. It can be argued this is a transient response, but that doesn’t invalidate a trend. The temperature data don’t imply a cause either. That can be debated, but it makes no sense to argue with observed data.
I believe that the method for getting a global average anomaly is invalid and hides the real trend. Therefore the apparent increase is incorrect.
What do you think is the correct way for getting a global average temperature and what is the real trend?
Tell us all when you can feel a +0.1°C temperature difference.
What does “substantially” mean?
Got it! Here in Argentina it is 100 deg F right now. The Good Boy (El Niño) is creating a great wine grape harvest. Last season the Bad Girl (La Niña) froze 30% of the wine grape harvest with a late Spring freeze. Not a hard choice, is it?
Perfect for ice wine.
My comments from Dr Spencer’s blog.
I had though the spike might have been falling of a little this month, but I still would put money on ’24 not being as warm as ’23- on the assumption that this El Nino is behaving differently to past ones.
This marks the 7th month in a row where the global anomaly has been a record for that month.
February will be interesting as that’s usually the warmest anomaly during an El Nino. The record for February is currently 0.71 set in 2016.
As far as this January is concerned it beat the previous record by 0.43C, set in 2016.
Top 10 warmest anomalies for January.
Cherry-picking the trend from certain start dates, the slowest rate of warming starts in December 2015, and is 0.12°C / decade.
Starting in September 2014, where people where insisting the pause started – the warming rate is now 0.21°C / decade.
The trend over the last 15 years, is 0.30°C / decade, starting in January 2009.
And over the last 20 years it’s 0.24°C / decade, starting in January 2004.
(This is longer than the Great Pause that got some people so exited.)
Even starting in 1996, the start of that great pause, the trend is now more or less the same as the overall trend, 0.15°C / decade.
All of this is just a reminder that looking at short term trends over variable data can be misleading.
Relying solely on the long term can be misleading. The pauses reveal an inconsistency with the popular belief that greenhouse gases are the primary contributors to the ‘long term trend.’ Arguing otherwise relies on ridiculous curve-fitting exercises.
Nah. Pauses are expected. That’s what happens when you superimpose short term variability onto a long term trend.
Well, if nature can cause long pauses, then it can surely cause warming by itself.
Nature can cause warming by itself. That does not mean that humans cannot also cause warming or that pauses are expected.
How can there be this short term variability if CO2 is the driver? That sounds like you turned up the thermostat in your home and the temp inside went up 2 deg, then down a degree, then did nothing for a while, then went up a half deg, then another half deg, then down a half degree, and so on.
Would you ignore the behavior of the thermostat and furnace just because the temp eventually went up?
CO2 does not prevent all of the other factors from having a modulating effect. Similarly turning up the thermostat on your furnace does not prevent all of the other factors (like opening doors, closing window shades, etc.) from having a modulating effect.
The following graph might help you visualize what is happening.
No uncertainty limits — FAIL.
How do you prove that the correlation between temperature and CO2 isn’t spurious? All your graph shows is that a model, based on the assumption that CO2 causes warming, behaves as intended.
This can be done by showing that CO2 impedes the transmission of energy.
First, CO2 causing warming isn’t an assumption. It’s based on the 1st law of thermodynamics and the heat capacity equation.. Anyway, yes, the graph shows that observations including the variability are not inconsistent with CO2 being a significant contributing factor to the long term warming trend.
Said another way…the point of the graph is not a proof by itself that CO2 is the cause of the warming. The point of the graph is that 1) it shows that observations are not inconsistent with it being the case of warming and 2) it helps people visualize the net effect of short variability superimposed on a long term trend.
You’re basing your claim off your model. A model is not evidence; it is someone’s interpretation of what is happening. There are far more than five variables, and we know they react dynamically and not linearly. CAGW sure love circular reasoning.
That’s right. Again…the claim I’m making is that the global average temperature observation is not inconsistent the hypothesis that CO2 is a modulating factor upon it. What the model shows is that you cannot falsify this hypothesis from the GAT observation alone.
A model is a set of equations, heuristics, or algorithms that accept inputs and produce outputs that explain and predict reality. It is a part of the body of knowledge and consilience of evidence. It might be insightful to know that every single temperature measurement you’ve ever seen comes from a model. Yet I suspect you would agree that temperature measurements themselves are evidence. No?
Yep. It’s a fact I’ve mentioned many times. It’s the reason why my model cannot explain all of the UAH TLT changes. What is interesting, however, is that we only need 5 variables to explain 75% of those changes.
And remember the goal of my model is not to explain the UAH TLT changes perfectly. The goal is to demonstrate visually how those changes are not inconsistent with a hypothesis that CO2 can be a modulating factor despite the numerous ebbs and flows and pauses that you see.
“pauses are expected”
If you take the effect of the El Ninos out of the satellite data.
The long term trend is basically ZERO !!
Most of the satellite data is so-called “pause” interrupted by El Nino events.
There is absolutely no evidence of warming by atmospheric CO2 in the satellite data.
“That’s what happens when you superimpose short term variability onto a long term trend.”
Yep, when you get major, but short term, El Nino events imposed on the ZERO TREND underlying UAH..
… you get what looks like a bit of a natural warming trend..
roflmao.
And you tried to imply you weren’t a trendologist !
Get a mirror, fool !!
Great to have a major El Nino to hang warming trends on, isn’t it. !
You know that without them .. there is no warming.
Someone didn’t notice I pointed out this was cherry-picking.
Don’t worry in a couple of years you can be applauding the start of a new pause which your insist has nothing to do with the El Nino last year.
Still a monkey with a ruler. ! so sad.
No warming except El Ninos.. get over it !!
“this was cherry-picking.”
So you were doing it INTENTIONALLY…… Why !?
You knew it was totally meaningless garbage…
…. and still posted it. !
Someone has to fill in for Lord Monckton.
You would be the very last in queue.
Your mathematical ability and scientific understanding is that of a kindy student compared to Lord Monckton’s.
You are a mathematical and scientific non-entity.
If you are using Monckton as you standard, I’ll take non-entity as a complement.
Yes Monckton with a BA in classics and a Diploma in Journalism, a true mathematical and scientific non-entity.
Poor phil, doesn’t realise how much mathematical training Monckton has….
He would walk rings around any of you clowns.
I never got over him claiming to have proven the Goldbach Conjecture, and then calling me a totalitarian when I suggested he might try getting it published in a maths journal.
Not a chance, I remember when he was a junior editor in the local paper when I was working on my PhD which required a significant amount of maths.
“take non-entity as a complement.”
Yes, it was an over-estimate, by a long way..
bellcurvewhinerman keeps trying to goad me into replying to his pseudoscientific nonsense, his fav is to call me a “troll”; CMoB has had his act ID’d for a long time now.
“bellcurvewhinerman calls me a troll”.
And some people think karlo has no sense of humour.
“And over the last 20 years it’s 0.24°C / decade, starting in January 2004.”
With two large El Ninos and one small one.
El Ninos are your “go-to” for warming !
It really is mathematical idiocy to be constantly using transient spikes to calculate trends.
But we expect nothing else
Remind me next time to say something like
“All of this is just a reminder that looking at short term trends over variable data can be misleading.”
So you intentionally created idiotic trends which you knew were misleading.
Ok ! Why do that ??
Not as misleading as presenting a “global temperature”, no matter who is doing it.
Bellman,
Comments on UAH monthly observations invariably have emphasis on where on earth it is hotter than before. A balanced comment would include places where it is colder than expected or than before.
Here where I live, in Melbourne Australia, we have been having a very cool summer. Today is forecast to reach 100F, the first Century this summer, so that is a hint that a normal summer can still happen.
But there seems little inclination to report colder than expected, when hotter than expected comes with the wisdom and help of regulatory advice, like taking action to stay cool, to wear a hat, to drink water. The thirst to push news of warming over news of cooling is a silly social thing because Nature sets the weather in the main, not people, so it is gossip territory – in the category of which knitting pattern will be stylish comes next winter.
I have absolutely no interest in your list of hottest Januaries. What will be, will be. As best we can measure, the global surface is in a time of gentle warming that by Nature’s coin flip could have been a time of gentle cooling.
Enjoy it. You have only one lifetime. Geoff S
El Ninos usually mean that the east part of Australia has decreased rainfall..
This has NOT been a “normal” El Nino. 😉
Maybe it’s El Nino that identifies as a La Nina?
Or a La Nina that identifies as an El Nino?
(Anything is possible these days, hey?)
We’ll have to wait for the global map to be published before knowing where it was cooler. But according to the published table January was 1.18°C above the 191 – 2020 average. December was 0.85°C above the average.
This El Nino has had a very wide-ranging impact..
But it is all you have.
Before the El Nino it was cooling !!
I was responding to someone saying it had been a cool summer in parts of Australia.
Which is has been… Certainly nothing out of the ordinary.
Centre of Australia gets warm in summer.. didn’t you know that !
A degree or so either way is absolutely NOTHING and almost certainly within measurement capability. !
Stop yapping.
You might want to look a little more closely at the UAH Australia data. According to this latest update, at +1.18C, January 2024 is the warmest January on record for Australia, according to UAH.
I would say warmest on record is a little ‘out of the ordinary’, wouldn’t you?
What don’t you understand about “nothing out of the ordinary”.
A fraction of a degree is meaningless, just like your comment.
No-one has experienced anything untoward except the amount of idiotic yapping and snarling from the AGW cultists.
Did you forget there was a strong El Nino?
Now.. any evidence of human causation?
Or are you admitting this is totally natural warming.
I might ask you the same question. If you think record breaking warmth during a moderate El Nino (nowhere near as strong as 2015/16) isn’t out of the ordinary then I can’t help you.
Was not a “moderate” El Nino event. You are chronically mal-informed as usual.
Huge amounts of energy released that travelled around the whole tropics.
An unusually strong El Nino release.
You can see its progress in the following chart, as it absolutely swamps the tropics.
You are the one needs help, for your psychotic AGW panicking and yapping. Maybe a dog muzzle for a start. !
Just check the data here.
Nowhere near as strong as 2015/16.
You moron…. that is the ENSO value.
Not a measure of the energy released.
What a completely ignorant twit you really are. !!
Denying what your eyes can see (if you let them)
I thought even a complete moron would see the El Nino event spreading energy around the globe.
Seems I over-estimated you…. by a lot.
Global temps are still lower than nearly all the last 10,000 years.
This has been a pretty average summer so far, albeit rather damp and hence humid.
No-one without a thermometer is going to notice a couple of slightly warmer evenings.
Stop your gormless, idiotic, chicken-little panic and carrying-on.
… makes you look like a total moron. !
You’re sounding a bit panicky again.
You should take something for that.
NOT whatever you have been taking.
That seems to lead to irreparable brain damage.
Come on fool..
… admit that without a thermometer, you couldn’t tell the difference between 20C and 21C.
Or are you like Greta and super-sensitive to things like CO2 and temperature !! 😉
BoM: Australia’s national area-averaged mean temperature for January was 1.54 °C above the 1961–1990 average, the third-warmest January on record (since observations began in 1910).
For Western Australia it was the fifth-warmest January on record, and for Queensland the eight-warmest on record.
Most Australians live around the coast, I don’t think they’re bothered, I wouldn’t be, especially when you look at the reality behind the alarmists “boiling Australia”.
Bellman, as it has been cool in Melbourne, a “part” of Australia housing about 6 million people; and “someone” is Geoff Sherrington who has been studying these routine land surface temperatures since 1992 and even writes articles for WUWT. GOODNESS!
The very next article after this one is by Geoff Sherrington, which is the real name given to the chap who tends to curl a lip at poor science, fearless about cancel culture that so fascinates the immature mind.
I’m sorry. Calling you “someone” was not meant to be an insult. It’s just a common problem where I respond to a specific claim someone, anyone, had made, and are then attacked by someone else for not addressing a completely different issue. E.g.
Someone: It was cold in one specific location.
Me: We’ll the data says it was above average.
Someone else: Why are you ignoring all the reasons why it was hot there.
No, it was HOT in one specific place. The middle of Australia where there are a couple of thermometers…. and about as many people.
(see chart from “alpha” above)
I am not talking about thermometer readings. This is satellite data.
Here’s the map
Cold over Northern Europe and the USA, warmer over Southern Europe and North Africa, and pretty much throughout the tropics.
Australia is warmest at the center, and has one cold spot in the north. Cold spots over the southern hemisphere, and especially over the Antarctic.
It’s the persistence of positive anomalies around the tropics that seem most telling – as the article says it’s a record anomaly for any month there.
“A balanced comment would include places where it is colder than expected or than before.
Here where I live, in Melbourne Australia, we have been having a very cool summer.”
Which is yet another reason why a “global average”, whether temp or “anomaly”, is meaningless.
No, it is a global average temperature. The places that were hotter than average outnumber the places that were cooler than average and to a greater extent than ever before recorded in January for this data set.
Fractions of a degree, that NO-ONE would notice were it not for the constant yapping of the AGW cultists.
Most of the warming is a large band of +0.5 around the tropics from the El Nino.
There is absolutely no evidence of any warming from atmospheric CO2 in this El Nino event.
The 2015/16 el Nino was much stronger than this current one, yet warmest temperature records are falling all over the place. So it’s not just El Nino.
Obviously the energy released in this one was much greater and widespread, so the first part of your comment is just plain wrong.
And yes, we have explained to you many times the effect of urban warming and bad thermometer siting, mal-adjusting data etc etc
Thanks for confirming that you have absolutely no evidence of any warming from atmospheric CO2 in this El Nino event..
.. or anywhere else.
How could the energy released by a much smaller El Nino event be ‘much greater and widespread’ than that released by a much larger El Nino event? How is that “obvious”?
How is it then that northern hemisphere ocean temperatures are the warmest on record for January? As Spencer says:
Are the satellites positioned wrongly? That urban heat island effect is mighty strong, lol!
Oh dear, you really haven’t got a clue have you. !!
El Ninos release to the WHOLE atmosphere and ocean, you gormless twit. !!
And this one released a LOT of energy.
And haven’t you ever heard of ocean currents !
How come you are so incredibly ignorant ?????
There’s a very good reason this El Nino looks different. There’s more solar energy making its way to the surface. This chart says provides some details.
The last time I saw a CERES specification for solar shortwave was back in 2021. There had been an increase of 1.5% in absorbed solar radiation (ASR) during the 21st century. This shows an additional .9% since 2022 which could tie in very well with the Hunga-Tonga eruption (HTE).
Is there a reasonable explanation for why the HTE would decrease cloud cover? Maybe a reduction in cloud condensation nuclei (CCN)? Would an increase in stratospheric water vapor reduce cosmic radiation? I know it affects ozone so that might explain part of the ASR increase. But why a reduction in clouds?
Thanks, Richard. Very nice graph.
Richard,
Rather nice, more please?
Geoff S
The graph comes from this web site.
https://www.climate-veritas.com/?page_id=26
I think Nikolov and Zeller provided some good information years ago on the similarity of planet temperatures. Unfortunately, I don’t agree with their views on the causes of warming.
On Dr. Spencer’s blog you called CERES a cult.
No, I called those who push AGW cultists. If they work on the CERES project then they are part of that cult. As we can see from the data collected, the planet is now receiving 2.5% more solar energy at the surface than it was getting when the 21st century began. Some of us think that might have an influence.
Loeb is the developer and maintainer of CERES.
Watch out bnice2000 will be after you for contradicting his view that the only cause of warming is El Niños!
And what do you think charges the El Ninos, moron !
A “record” compared to what? All you are saying is that there is an upward trend, which is obvious from the graph. That says nothing about the cause or if the recent El Nino is stronger than past events.
“A “record” compared to what?”
Compared to the respective previous 44 month in the satellite data.
“That says nothing about the cause or if the recent El Nino is stronger than past events.”
All I’m saying is there have been a lot of records – indicating it’s been quite hot recently. I find things like that interesting, even if they mean little. I say nothing about the cause of the recent spike – I certainly doubt it’s the start of accelerated warming. It’s probably caused by the El Niño, but there may be other factors, and it’s still unusual due to the timing.
“All you are saying is that there is an upward trend, which is obvious from the graph.”
If you are going to mention the upward trend, be prepared to be called a “trendologist” whatever that is. Yes, I’ve been saying there’s an upward trend, but many here will prefer to point to some arbitrary pause. There had apparently been no warming for the past 8 years, and for the 18 before that, yet here we are still talking about an obvious upward trend.
Here’s what it looks like if you remove the trend. Monthly residuals as dots, 12 month moving average as red line.
The massive injection of water into the stratosphere by the submarine Tongan eruption could take years to clear.
The water, El Niño and cleaner maritime fuel requirements combined to warm the air last year.
Yes, possibly or probably. The truth is we really don’t know what all the variables are or how they all work together, and idjits saying they do with any degree of certainty are just lying their a$$e$ off.
ENSO forecast estimates El Nino conditions will probably persist through April.
Add in the lag, and UAH is probably going to indicate large warm anomalies for quite some time.
It will be very interesting to watch where UAH goes after this El Nino effect is over.
Tongan water coming out of the atmosphere at an unknown rate. How long to remove that factor?
Still have a few more years until the AMO flips, but that will also be interesting.
Good thing I can come to WUWT and keep learning!
Even Roy Spencer and John Christie of UAH have said the HT eruption had a very limited impact on global lower troposphere temperatures. Hundredths of a degree, at best.
These new monthly records are a 10ths of a degree higher than the previous warmest; so the HT volcano doesn’t explain it.
they used lots of “coulds”, “Seems to” etc… ie they were speculating.
You know, like CO2 warming of the atmosphere is pure speculation.
A strong El Nino fed by more absorbed solar energy.
Absolutely no evidence of any human causation.
Amazing how brainless some people are that they go into a MANIC PANIC over 1/10 of a degree, which is almost certainly within the real measurement error range.
“ so the HT volcano doesn’t explain it.
How would a anti-scientist like you know if the HT eruption didn’t explain a tiny fraction of a degree of warming.
What a moronic comment!
Take your tablets dear.
Thanks for admitting that I am correct. 🙂
Keep listening, and if you are capable (as if), you may actually learn something.
You calm now? Good.
For the umpteenth time, not that it will do any good, El Nino is but one phase of the ENSO oscillation; the phenomenon that moves existing heat into and out of the oceans.
It does not create heat (or cold) all by itself.
Something else is doing that.
For the umpteenth time…
…your comment indicates that you are totally ignorant about El Nino events, what they are and what they do.
That is not my problem.. it is yours.
That is why you need to go and get an education, so can actually learn something.
The heat and energy for El Ninos most definitely does not come from atmospheric CO2.
Only a complete moron would think that…… so you probably do.
This is nuts. You’re just denying what ENSO is now without providing your alternative explanation, perhaps mercifully.
Do you know what the word ‘oscillation’ means?
Hint:
Movement back and forth; not ‘generation of magic warming”.
I’m not denying ENSO.
The fact you describe ENSO the way you have shows you are basically ignorant of what it is.
ENSO is NOT like that pendulum they swing in front of you when you were brainwashed each day. and when they use it to try to help treat your psychosis.
It is two phases that do different things.
Sorry if that is too difficult for you to comprehend.
“Something else is doing that.”
Oh no… ,,fungal thinks the BOOGIE-MAN is doing it.
“ the phenomenon that moves existing heat into and out of the oceans.”
You just proved you have ZERO CLUE of the origins of the energy that drives El Nino events, and total ignorance on what La Nina and El Nino actually do.
Isn’t that wonderful… gives you so much opportunity to learn, if you are capable of doing so.
“Something else is doing that.”
Good, finally a comment that can be taken as a search for knowledge, finally some science.
OK – what do you think causes these ENSO cycles – anything I’ve read just refers to them as phenomena but without any real idea as to why, which is weird compared to other areas of weather/climate science where everyone has an answer to everything.
Has anyone been able to match up the pattern with any other phenomena in nature?
Even the mechanics of how the upwelling or collection of warm water on one side of the Pacific versus the other, gets started at all, why does it leave the peace of several years of equilibrium for a year of El Nino or Nina every so often?
TFN,
What, precisely, is that “something else”?
Geoff S
Don’t feed the trolls – ignore the juvenile jibes, let’s focus on the science.
Totally agree, especially with “manic panic over 1/10th of a degree” – but try to be nice and civil and patient – at least for the sake of reducing the ‘flame wars’ so the truly informative comments like “Richard M’s”, above re: reduced cloud cover and increased absorbed shortwave (visible and UV) radiation, don’t get buried under streams of name calling and insults.
And let me stress again you are totally correct in saying 1/10 of a degree is nothing for anyone to worry about, whether a product of instrument and method uncertainty or an actual, real change – and even if it were a steady change over a decade, and even if it gave rise to a big, whopping 1 whole degree over a century – or even 2, or what the heck, even 5, whole Celsius (or Kelvin) degrees over a century – there is no cause for alarm, Greenland and Antarctica would still have massive icecaps – and the alarmist scientists know this and should be ashamed for inspiring panic over what amounts to weather trivia.
I’m over being civil to this fool.
He needs to know just how ignorant he is.
“Blockbuster rainstorm, major flooding to unfold
Because the new storm, packing much more moisture, will hit only a couple of days after the first storm soaked and saturated much of the state, runoff will be rapid and potentially dangerous and destructive, especially in portions of Southern and Central California, where most of the new rain is likely to fall.
The first storm brought a general 1-6 inches of rain from Wednesday to Thursday. However, starting as early as Saturday night, more than double the amount of rain may fall from the new storm, with some of the rainiest spots picking up a foot or more of rain in only 48 hours.”
The link you missed:
https://www.accuweather.com/en/severe-weather/38-million-face-flooding-from-blockbuster-rainstorm-in-california/1618504
And see it coming, ain’t it a beaut?
See the 1014 isobar (my black highlight) – perfectly hugging the coast
Otherwise what billions of folks around the globe who also live in deserts call: Monsoon
They handle such things with relative ease, so why do the Rich Educated and Intelligent People of California lose their heads about such things?
https://www.ventusky.com/?p=38.33;-120.15;6&l=rain-ac&t=20240206/2100&m=gem
The Jan. 21st to 26th storm brought us, at 8600 ft elevation in SW Utah, 2.3 inches of snow water equivalent.
This storm has given us about 2 inches so far this month, 2 days, and snow in varying amounts is expected for the next week. As per your link, we are on the southern edge of the big water.
Early January it was looking like a LOW snow year, at around 60% but the January storm and this storm has us about 90% of the 1991 to 2020 median for this date. We may make 100% by next weekend.
Same in NE OR.
Drake,
There’s a station about 2 hours from Salt Lake City near the Tooele area. I examined the data and am updating it every month. It’s new and is situated away from artificial heat sources. Here’s the data, Viscount Monckton style.
The pause is 291 months.
Story Tip
The slight warmth from the El Nino has had only positive effect on world crop production.
World Cereal Production Set To Hit Record High In 2023 | NOT A LOT OF PEOPLE KNOW THAT (wordpress.com)
The maximum length of the Monckton Pause hit 107 months on the 2023/04 update. The start date at that time was 2014/06.
In just 9 months the trend from 2014/06 went from 0.00 C/decade to 0.23 C/decade.
Golly-gee, Batman!
Yep the trend moneys are back !!
El Nino transients, and the sometimes associated step, are required to break the long zero trend periods between.
Is that what you are saying ???
There was actually a cooling trend before the current El Nino.
But El Ninos are the only atmospheric warming the AGW cult have.
typo.. “moneys” -> MONKEYS
Which means CO2 could not have been the cause.
BINGO!!!
CO2 levels have shown a consistent pattern without any acceleration. Rather, the more plausible suspect seems to be the rise in incoming solar radiation, as evidenced by CERES data. However, the puzzling aspect is how this variable abruptly manifested in the data, especially considering that there was no warming observed for approximately 18 years. This discrepancy brings us to an intriguing possibility: Hunga Tonga.
Think of it as a slowish build-up of stored heat and energy… then a sudden release.
The western Pacific Warm Pool above Australia can build-up a sea level anomaly quite a bit higher than the eastern pacific off Equador/Peru… (see chart of Great Barrier Reef during the 2015 El Nino)
… that means a lot of potential energy, as well as heat energy that gets released as the water “sloshes” back, which it must eventually do.
The effect of HT is yet to be fully known, and may not ever be fully understood… lots of theories abound, though.
No, it means that relying on trends shorter than ~30 years is as useful as a chocolate fireguard.
But he’ll be back, once this ENSO spike falls back, with another cherry-picked data-mine, and you will all fall for it again, as usual.
The ‘Great Skeptics’!
There is absolutely ZERO scientific evidence that CO2 had anything to do with this El Nino
The ONLY atmospheric warming you AGW morons can ever find, is from El Ninos.
Relying TOTALLY on those El Ninos, is the ultimate in data mining.
There is nothing else, but boy do you AGW clowns get into a hyper-panic when one happens.. even though YOU KNOW CO2 has nothing to do with it.
And yes, between the major El Ninos.. there have been extensive zero trend periods.
Come on fungal fool. show us evidence this El Nino was caused by human released CO2.
Waiting !!… for yet another blank, empty response
No one, but no one, has suggested that El Ninos are caused by anything other than natural fluctuations.
What you consistently ignore is La Nina. The cooling phase of the ENSO system. You only want to count the warming but not the cooling effect of ENSO.
The ‘O’ in ENSO stands for ‘oscillation’. ENSO only moves heat around; it doesn’t create it by magic.
WOW.. fungal admits that EL Ninos have ZERO human causation.
So that means he has admitted there is..
… NO HUMAN CAUSATION IN THE WARMING IN THE SATELLITE ERA.
No I don’t ignore La Nina.. you are totally ignorant about what it actually is, that is all.
Just because you are belligerently ignorant of what fuels ocean energy.. that is not my problem.
You are the moron thinking that CO2 creates heat “by magic”
Oh dearie me.
Fungal is SOooooo IGNORANT he thinks ENSO is like a pendulum.
No, muppet.. It is not. It is two stages doing two different things.
And the fact that he TOTALLY CLUELESS about where the energy charging El Nino events comes from..
… shows just how little he understands about anything. to do with the topic.
No wonder he is totally LOST and has to dream up imaginary unicorn farts. !
“The cooling phase of the ENSO system.”
NO.. it is the phase where energy builds up.
That doesn’t necessarily mean cooling.
Your total lack of understanding is CONFIRMED.
If you believe that increasing CO2 were the cause of the jump from anomaly of 0.18 C in April 2023 to 0.93 C in October, please explain how that happened. Thanks!
I don’t believe that.
As I said, I believe that reliance on short-term trends in global average temperatures is idiotic.
I hope folks here remember that when Lord M next appears with his ’10-minures no warming!’ claims…
“ reliance on short-term trends in global average temperatures is idiotic.“
Yet it is exactly what you do.
You rely TOTALLY on the very short-term transient effect of El Nino events, and the step change that sometime follows them.
Yes… we all agree this is totally idiotic., but is it what you do.
But it is all you have available to you.
You also said the downtrend from 2016 will remain intact in July. It took only but a few weeks for UAH start reporting values that exceeded in the peak in 2016. The trend since 2016…+0.14 C/decade. You made one of the worst predictions I’ve ever seen in regard to the climate so I’m questioning how it is possible that you can be so confident with this statement.
There you go again relying totally on the current very short term El Nino transient to put a super -dumb trend.
Why not just use the trend starting at the base of the El Nino, just to show how stupid you are.
That says it all, doesn’t it? Meanwhile, Lord M is nowhere to be seen…
Big El Nino.. or didn’t you know that. ??
El Ninos are absolutely required to end the long periods of zero trend, or in this case, cooling since 2016, until the start of the El Nino.
UAH is basically just long periods of zero trend or cooling, interrupted by strong El Nino events.
No evidence whatsoever of any CO2 warming.
Moderate El Nino; not ‘big’. Much smaller than 2015/16, yet so many new warmest temperatures globally.
Head-scratcher, right? What can it be….?
Poor fungal, still hasn’t figured out that this is actually a rather strong EL Nino release, with very wide-spread effects.
Why remain so ignorant?? Is it by choice, or just stupidity . !
Now, any evidence of any human causation?
Nope, didn’t think so.
TOTALLY NATURAL. !!
“What can it be….?”
Take a few more of your wacky tablets,..
.. and get back to us with your hallucinogenic fuelled anti-science explanation..
I’m sure it will be hilarious. 😉
Nobody cares.
And yet if you were to plot the temperature of only La Nina years you’d see the same growth rate as if you just looked at just the El Niño years.
ENSO_global-surface-temp-anom.png
Maybe more like sin(at) + bt
As shown on that graph there was no growth prior to 1974 so the growth would seem to be due to something other than ENSO.
Continuous downpours in northern Australia.

Ireneusz, it’s due to the adjacent area being directly sub-solar recently during high TSI.
https://www.timeanddate.com/scripts/sunmap.php?iso=20240202T0300
What do the satellites measure?
from the WP
Watch the Earth breathe for one yearThis image of our planet is the closest we get to a real-time view of how carbon dioxide builds up in our atmosphere.
https://wapo.st/3SHhnXQ
Took way too long to do anything… but being from WaPo, almost certainly contrived nonsense.
Pertinent (and ignorant) comment in the text.
“Then winter comes, the plants die,”
Wrong, and shows a deep ignorance of biology, but yes… cold can kill plants…
… and/or can severely disrupt crop production.
As long as plant have sufficient water, anything but really extreme heat will help plants grow.
As linked a few comments above, 2023 saw another record cereal crop harvest.
More often than not, plants hibernate during cold weather.
Precisely.
Perhaps the guy only plants “annuals” ?
But bacteria and fungi continue to work even when the air temperature is at or even below freezing.
Is it so cold in the northern hemisphere right now? Turn off the heating!
https://earth.nullschool.net/#2023/08/01/0200Z/chem/surface/level/overlay=co2sc/equirectangular/loc=-62.691,-33.541
https://earth.nullschool.net/#2024/02/03/0300Z/chem/surface/level/overlay=co2sc/equirectangular/loc=78.963,63.807
https://earth.nullschool.net/#2024/02/03/0000Z/chem/surface/level/overlay=co2sc/orthographic=-355.61,70.10,288/loc=-75.238,40.424
I don’t believe the animation. Mauna Loa measurements show CO2 reaching a low about October, climbing to a peak in May, and then declining rapidly until the next October. That isn’t what the animation shows. Note that there is an abrupt decline between December and January, during the seasonal ramp-up in the northern hemisphere. I suspect it is an animator’s fantasy rather than a faithful representation of what happens during a year.
It’s not clear how they made it. I notice the animation doesn’t run on my old computer with Firefox but it does run on my google browser. Though they say you can see CO2 at some wave lengths, implying they photographed it at that wave length, they don’t actually say it. It’s probably made on a super computer- based on some real data and of course models.
I see:
Nice, compare CO2 to arsenic! That comment is way out of line for any reputable science organization.
The animation certainly is trying to convince the idiots out there that fossil fuels is poisoning that atmosphere- it looks dirty! And, why should it change so much throughout the season – if this is based entirely on real data? There’s a fluctuation but not that dramatic- so yuh, made with a computer and made to look far more dramatic. Maybe they’re just trying to show the change of CO2 concentration, not the actual amount?
That does represent an awful lot of Energy being pissed away into space..
Methinks we really do wanna be getting some trees into the ground and capture some of it before Planet Earth takes all the charm and temperature of a witch’s tit
The NOAA ENSO website graphs and maps predict rather a short El Niño period. Can we expect another 30 month La Niña ?
It looks like over CONUS we had our first negative monthly anomaly since last June. That’s also when this recent temperature spike anomaly began. Interesting to see what the rest of 2024 brings.
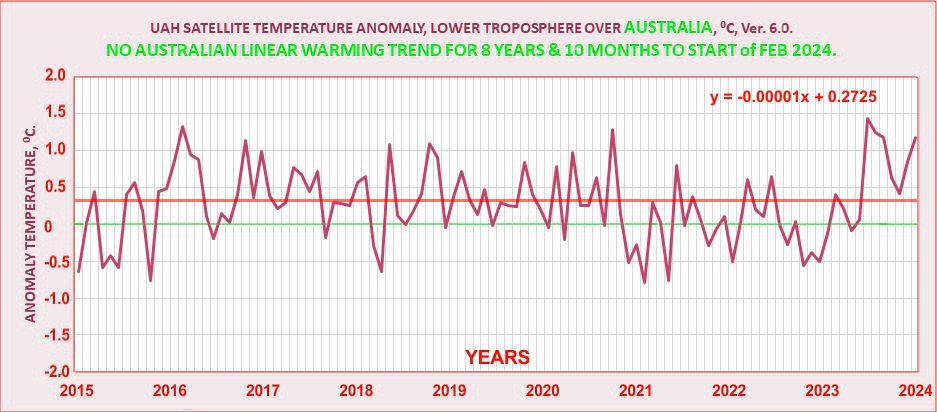
The Australian “pause” Viscount Monckton style, has lost a couple of years from its beginning and now stands at 8 years and 10 months. It is quite tochy; a small difference in each new monthly temperature can move the beginning date around sensitively.
The pause length is being governed by the shape of the current peak said to be caused by El Nino – or by Hunga Tonga, or by natural variation, or by CO2 increase.
Geoff S
Oooops! Here is the intended version with the linear trend line. Geoff S
Thanks, been doing other things and hadn’t got around to it. 🙂
Don’t like the fluro green writing, though 😉
ps… according to my calcs, there are 11 months with higher anomalies than Jan 2024. A couple of Februarys, one in Nov… but mostly in the cooler months.
odd, I get a slightly different trend. Maybe some data isn’t quite the same.
Must remember to check mine matches UAH complete, when it comes out.
bizarre… that a simple comment like gets two red thumbs. and no counter response
Must the AGW COWARDS again.
You are on the trendologists’ list of hate.
“You are on the trendologists’ list of hate.”
Oh dearie me.. that hurts me so, so much ! 😉
Consider yourself lucky, Bellman got 24 red thumbs for just producing a table of January anomalies. https://wattsupwiththat.com/2024/02/02/uah-global-temperature-update-for-january-2024-0-86-deg-c/#comment-3860048
Pushing the warmest EVAH crap as if fractions of a degree are even noticeable. That’s why.
I see, so to quote you “a simple comment like that gets two (multiple) red thumbs”, the work of “COWARDS.’
I assume red is better than black.
But it is curious how those like karlo and and bnice, who make a habit of trying to be as insulting as possible are also the ones who cry loudest when they get a single down vote.
Indeed!
The overt focus on minor anomaly issues is why he is not credible why are you defending a dumb list that no one here can actually feel the difference.
In previous 3 decades warmist/alarmists wail about the warming trend predicting a list of woes that never arrives which is why they get the downvotes a lot now because they destroyed their credibility.
Suck on this!
Carbon Dioxide Fertilization Greening Earth, Study Finds
LINK
The planet loves it and so does our farm crops see ever higher harvest records still gets ignored by stupid climate crier cults:
World Cereal Production Set To Hit Record High In 2023
LINK
There is no climate emergency!
morning on the farm
-49 degrees, humidity 57%
thick ice fog, wind calm
daylight 7hr 2mn > 6mn 43sc
it’s groundhog day in America,
we don’t ask groundhogs how many weeks
of winter are left in Alaska, we ask moose..
https://www.facebook.com/photo/?fbid=7651090821570093&set=gm.10161792022128676&i
This is a rainy summer in northern and eastern Australia.

In the 1970-80 years I flew to Darwin about 8 times a year on average.
January was called “The Wet”. And the rain was heavy. Willis E would have loved the afternoon storms with lightning and tall anvils.
The Wet was always the term, so far as I know.
Geoff S
This is great news for Australia and its wildlife. There was concern about a repeat of the 2019-2020 bushfires. It was sad to watch from across the world. Hopefully, Australia is making plans for another challenging season to protect its infrastructure, people, and wildlife.
What will begin on Sunday in California.
https://www.ventusky.com/?p=38.4;-119.8;5&l=rain-3h&t=20240204/2100
Is it worth scaring about sea surface temperature anomalies? Currently, El Niño is operating most strongly in Peru.

Ireneusz,
It would be great to incorporate sea surface temperatures into articles, but the measurement uncertainty is too high to be useful yet.
Interesting comments yesterday by Prof Wyner in the Mann vs Steyn trial, that taking a wrong or different pathway in stats work can lead to unrealistic outcomes because of uncertainty effects.
SST errors can get baked into current wisdom ideology if the experts fail to admit to high uncertainty. Nobody benefits in the long term. Sooner or later there will be an expensive mess to correct. Geoff S
“The following table lists various regional LT departures from the 30-year (1991-2020) average for the last 13 months (record highs are in red):”
On my monitor the record highs are in bold black with pale yellow highlight.