From Dr. Roy Spencer’s Global Warming Blog
by Roy W. Spencer, Ph. D.
The Version 6 global average lower tropospheric temperature (LT) anomaly for October, 2023 was +0.93 deg. C departure from the 1991-2020 mean. This is slightly above the September, 2023 anomaly of +0.90 deg. C, and establishes a new monthly high temperature anomaly record since satellite temperature monitoring began in December, 1978.

The linear warming trend since January, 1979 still stands at +0.14 C/decade (+0.12 C/decade over the global-averaged oceans, and +0.19 C/decade over global-averaged land).
Various regional LT departures from the 30-year (1991-2020) average for the last 22 months are:
| YEAR | MO | GLOBE | NHEM. | SHEM. | TROPIC | USA48 | ARCTIC | AUST |
| 2022 | Jan | +0.03 | +0.07 | -0.00 | -0.23 | -0.12 | +0.68 | +0.10 |
| 2022 | Feb | -0.00 | +0.01 | -0.01 | -0.24 | -0.04 | -0.30 | -0.49 |
| 2022 | Mar | +0.15 | +0.28 | +0.03 | -0.07 | +0.23 | +0.74 | +0.03 |
| 2022 | Apr | +0.27 | +0.35 | +0.18 | -0.04 | -0.25 | +0.45 | +0.61 |
| 2022 | May | +0.18 | +0.25 | +0.10 | +0.01 | +0.60 | +0.23 | +0.20 |
| 2022 | Jun | +0.06 | +0.08 | +0.05 | -0.36 | +0.47 | +0.33 | +0.11 |
| 2022 | Jul | +0.36 | +0.37 | +0.35 | +0.13 | +0.84 | +0.56 | +0.65 |
| 2022 | Aug | +0.28 | +0.32 | +0.24 | -0.03 | +0.60 | +0.51 | -0.00 |
| 2022 | Sep | +0.25 | +0.43 | +0.06 | +0.03 | +0.88 | +0.69 | -0.28 |
| 2022 | Oct | +0.32 | +0.43 | +0.21 | +0.05 | +0.16 | +0.94 | +0.04 |
| 2022 | Nov | +0.17 | +0.21 | +0.13 | -0.16 | -0.51 | +0.51 | -0.56 |
| 2022 | Dec | +0.05 | +0.13 | -0.03 | -0.35 | -0.21 | +0.80 | -0.38 |
| 2023 | Jan | -0.04 | +0.05 | -0.14 | -0.38 | +0.12 | -0.12 | -0.50 |
| 2023 | Feb | +0.09 | +0.17 | 0.00 | -0.11 | +0.68 | -0.24 | -0.11 |
| 2023 | Mar | +0.20 | +0.24 | +0.16 | -0.13 | -1.44 | +0.17 | +0.40 |
| 2023 | Apr | +0.18 | +0.11 | +0.25 | -0.03 | -0.38 | +0.53 | +0.21 |
| 2023 | May | +0.37 | +0.30 | +0.44 | +0.39 | +0.57 | +0.66 | -0.09 |
| 2023 | June | +0.38 | +0.47 | +0.29 | +0.55 | -0.35 | +0.45 | +0.06 |
| 2023 | July | +0.64 | +0.73 | +0.56 | +0.87 | +0.53 | +0.91 | +1.44 |
| 2023 | Aug | +0.70 | +0.88 | +0.51 | +0.86 | +0.94 | +1.54 | +1.25 |
| 2023 | Sep | +0.90 | +0.94 | +0.86 | +0.93 | +0.40 | +1.13 | +1.17 |
| 2023 | Oct | +0.93 | +1.02 | +0.83 | +1.00 | +0.99 | +0.92 | +0.62 |
The full UAH Global Temperature Report, along with the LT global gridpoint anomaly image for October, 2023 and a more detailed analysis by John Christy, should be available within the next several days here.
Lower troposphere:
http://vortex.nsstc.uah.edu/data/msu/v6.0/tlt/uahncdc_lt_6.0.txt
Middle troposphere:
http://vortex.nsstc.uah.edu/data/msu/v6.0/tmt/uahncdc_mt_6.0.txt
Tropopause:
http://vortex.nsstc.uah.edu/data/msu/v6.0/ttp/uahncdc_tp_6.0.txt
Lower stratosphere:
http://vortex.nsstc.uah.edu/data/msu/v6.0/tls/uahncdc_ls_6.0.txt
It is notable that the spike peaks in previous El Niños in the satellite era have been around the turn of the year or soon after, suggesting there is a seasonal element in their timing. Should we expect similar behaviour this time?
it doesnot add up:
Nine of the eleven El Ninos were ended because of a volcanic eruption; there is no way of knowing when their spike peak might have occurred if the eruption had occurred
BurlHenry, if we are willing to spend the money needed to inject 80 million tons of sulfur dioxide annually into the stratosphere, we can produce an Annual Anthropogenic Virtual Volcanic Eruption (AAVVE).
An AAVVE could quickly push the earth’s climate system back to that of the Little Ice Age which occurred between about 1400 and about 1750. All it would take is roughly 200 billion dollars spent annually plus the political will to just do it.
Or just go back to using coal, even the dirtiest stuff.
The graph shows almost a degree above the current average, so the Earth must be way over the 1.5 or even the 2 degree “limit” that the IPCC pulled out of its collective ass.
So the world is over, nothing much to be done now, hopefully the econ-nazis will be quiet as they go off to their safe-places to mourn the end of the world.
So long and thanks for all the fish!
Coal is just wood that mother nature has heated and compressed for easy storage.
Two things are reasonably certain about solar geoengineering using SRM:
1) It would quickly reduce global mean temperature to levels at or below that of the Little Ice Age;
2) We would find out very quickly if there is any reason whatsoever for anyone to pay any serious attention to global mean temperature.
And all of this for only 200 billion dollars annually! Such a deal!
Don’t know why they are down rating this, its a very nice and pointed comment which nearly made me spill my coffee.
The evidence shows that Pinatubo injected only 1/3 of that and the long-term effect was global warming. So, I doubt it would have the desired effect.
IIRC, Pinatubo injected 15 million tons of SO2 into the atmosphere which produced a very short-term cooling effect of roughly -0.5 C. Which didn’t last very long because the SO2 released by the eruption was quickly washed out of the atmosphere.
Solar geo-engineering through SRM would require 80 million tons of SO2 injected annually directly into the stratosphere, done more or less continuously every year indefinitely into the future in order to maintain a GMT which is a steady 2 C below current levels.
The reason why we are seeing heavy-duty criticisms of SRM coming from a variety of quarters is that there exists good scientific evidence that it would produce the targeted reductions in GMT, but that it carries a very significant risk of unintended collateral damage.
Beta Blocker:
Since 1980, satellites have been used to measure the amount of SO2 aerosols injected into the stratosphere, and for a VE4 eruption it averages 200,000 tons,.which causes about .02 deg. C. of cooling. for up to 2 years, before it settles out.
A similar injection of SO2 into the troposphere should cool things down even more, since the SO2 gas would combine with moisture to .form the reflective SO2 aerosol, H2SO4. (Stratospheric and Tropospheric SO2 aerosols have the same cooling effect).
I think your estimate of 80 million tons of SO2 annually into the stratosphere is at least, an order of magnitude too high.
So volcanic eruptions are seasonal?
They might become seasonal with some helpful assistance from AAVVE.
It does not add up
Not at all. They are random.
For the eruptions since 1900: Jan-Mar 7
Apr-Jun 13
Jul-Sep 5
Oct-Dec 5
El Niño takes its name from water temperature off Ecuador around Christmas, so yes, peaks occur in December and January.
This year’s UAH spike from July to October so far has occurred as CO2 fell, so more plant food in the air didn’t cause it.
Another month, another monthly warmest record and another warmest ever anomaly record.
New warmest year record for 2023 in UAH now looks nailed-on.
El Niño, Honga Tonga…
And what is your idea about that:
https://notrickszone.com/2023/11/02/a-major-surprise-nature-study-finds-phasing-out-fossil-fuels-will-lead-to-decades-of-warming/
“We would expect from a 100% switchover from fossil fuels to zero-emission renewables…net radiative heating would increase drastically.” – Nair et al., 2023”
From the UAH August 2023 report, available as a PDF from here:
The previous record warmest October anomaly in UAH was +0.47C in 2017, which was also influenced by El Niño conditions. This October’s anomaly was +0.93C; so I’m afraid ‘a few hundredths of degree’ doesn’t quite make up the difference.
You know there ate other opinions about Honga Tonga.
Yes there are. But it turns out they are all consistent with Dr. Spencer’s.
Jucker et al. 2023
Jenkins et al. 2023
Zhang et al. 2022
Zhu et al. 2022
Basically, what you are saying is that Spencer said that the HT eruption will have minimal effect, but every paper you just referenced is saying the opposite.
The blind leading the blind I guess.
All of those papers say global average temperature effect is small. Technically Jucker et al. 2023 does not address the global average temperature in the paper directly. But he did clarify the results in a twitter post. One paper I failed to mention was [Sellitto et al. 2022] who also describe the warming effect on the climate system as small.
And all of them still believe the AGW fantasy. Their opinions are dubious. Keep in mind there are other impacts from H-T besides water vapor.
Ozone depletion could allow more high energy UV radiation to reach the surface while the tsunamis may have weakened the Antarctic sea ice base reducing the volume of ice and allowing more solar energy absorption.
How much has ozone depleted because of Hunga-Tonga and how much energy was added to the climate system as a result?
Rapid ozone depletion after humidification of the stratosphere by the Hunga Tonga Eruption
AbstractThe eruption of the Hunga Tonga–Hunga Ha’apai volcano on 15 January 2022 offered a good opportunity to explore the early impacts of tropical volcanic eruptions on stratospheric composition. Balloon-borne observations near Réunion Island revealed the unprecedented amount of water vapor injected by the volcano. The enhanced stratospheric humidity, radiative cooling, and expanded aerosol surface area in the volcanic plume created the ideal conditions for swift ozone depletion of 5% in the tropical stratosphere in just 1 week. The decrease in hydrogen chloride by 0.4 parts per million by volume (ppbv) and the increase in chlorine monoxide by 0.4 ppbv provided compelling evidence for chlorine activation within the volcanic plume. This study enhances our understanding of the effect of this unusual volcanic eruption on stratospheric chemistry and provides insights into possible chemistry changes that may occur in a changing climate.
Stratospheric ozone depletion inside the volcanic plume shortly after the 2022 Hunga Tonga eruption
Near-term in-plume ozone depletion was observed for about 10 d by the Aura Microwave Limb Sounder (MLS) right after the January 2022 Hunga Tonga–Hunga Ha’apai (HTHH) eruption. This work analyzes the dynamic and chemical causes of this ozone depletion. The results show that the large water injection (∼ 150 Tg) from the HTHH eruption, with ∼ 0.0013 Tg injection of ClO (or ∼ 0.0009 Tg of HCl), causes ozone loss due to strongly enhanced HOx and ClOx cycles and their interactions. Aside from the gas-phase chemistry, the heterogeneous reaction rate for HOCl + HCl → Cl2+ H2O increases to 104 cm−3 s−1 and is a major cause of chlorine activation, making this event unique compared with the springtime polar ozone depletion where HCl + ClONO2 is more important. The large water injection causes relative humidity over ice to increase to 70 %–100 %, decreases the H2SO4 H2O binary solution weight percent to 35 % compared with the 70 % ambient value, and decreases the plume temperature by 2–6 K. These changes lead to high heterogeneous reaction rates. Plume lofting of ozone-poor air is evident during the first 2 d after the eruption, but ozone concentrations quickly recover because its chemical lifetime is short at 20 hPa. With such a large seawater injection, we expect that ∼ 5 Tg Cl was lifted into the stratosphere by the HTHH eruption in the form of NaCl, but only ∼ 0.02 % of that remained as active chlorine in the stratosphere. Lightning NOx changes are probably not the reason for the HTHH initial in-plume O3 loss.
Yeah. So within the plume itself it was substantial. But outside the plume the loss was minor and short lived. In fact, according to NASA’s OzoneWatch website global mean ozone levels remained steady at about 285 DU from 2021 to 2022. And so far through 2023 ozone is running higher than in 2022.
Three of your four citations predict significant warming from HTHH’s water injection into the stratosphere, based upon models, eg “greatly enhanced effect” on optical depth (Zhu).
Since when is a few hundredths of a degree C significant? I ask because I keep hearing about how the 0.6 C of warming in the UAH record is insignificant.
Nevermind that 2 of the 4 (Zhang et al. and Zhu et al.) actually predict slight cooling. Note that “greatly enhanced effect” on optical depth results in cooling.
And if we include [Sellitto et al. 2022] that I accidently left out that is 5 of 5 that either predict cooling or only warming of less than 0.1 C.
Nature Climate Change paper from January 2023 predicted significant warming for next five years from HTHH eruption:
https://www.nature.com/articles/s41558-022-01568-2
Tonga eruption increases chance of temporary surface temperature anomaly above 1.5 °C
I already cited [Jenkins et al. 2023].The authors say the warming is only expected to be a few hundredths of a degree C. Again…a few hundredths is hardly what I’d call “significant”. And considering many (most?) here on WUWT challenge the significance of the 0.6 C of warming shown by UAH I doubt you’re going to get a majority supporters regarding the significance of a few hundredths.
By 7%. And that’s only because the warming is already expected to be close to 1.5 C over the coming decade.
Doesn’t need any help from Hunga Tunga – the El Nino from 1997 was more than 1 degree bump from the trough before it, more than the rise from the current El Nino. 1997 took about 12 months from trough to peak, so we probably have a couple of months more of new highs before the temperature comes down on the other side. That also jives with the normal schedule of the El Nino – enjoy the Christmas gift of warmth while it lasts.
Speaking of the other side – I’d might as well get my prediction in: the last ten years shows the temps wiggling around the +0.25 mark as an average – so I think, based on previous performance, that after the El Nino there will be another pause wiggling around a +0.5 or 0.6 average (using the current averaging timeframe, but if it’s adjusted to a new range then my prediction will be for 0.5-0.6 degrees above the, say, 2001-2015 average, which is currently 0.0C on the graph at the top.
Comparing a super El-Nino event in the last stages of Pinatubo cooling to this is clearly an apple to oranges comparison. The warming from the 97 did not occur this rapid, it took at least 12 months. There is no way this El-Nino caused what is being observed globally, global atmospheric humidity levels in the troposphere have dropped this year, that rules out El-Nino as the culprit.
You’re not even looking at the graph, apparently. Just count the little curcles, there’s one for every month – or you could use the x axis if you enlarge the graph and get out a ruler to measure.
In both cases, the El Ninos are taking a year to ramp up to the peak, and I pointed out that I fully expect the current one to keep going until after Christmas. So to me the rapidity is roughly the same – you can quibble about the speed after the temps finally come down.
Your comment is confusing – you’re saying that the current El Nino is not caused by El Nino?
If you meant the humidity levels, that’s fine but I didn’t comment on that – I made a prediction of what temperature the next ‘pause’ would average out to. The temp graph shows the rising temps, but it also shows steps – temps in the 80-90s at one level, then the 97 El Nino, a new step about .25C higher during the early 2000s, then another El Nino, then another step, and finally the current El Nino.
So if the steps are real and not just an artifact of the result of many climate factors fighting for dominance – then there should be another decade long pause in the temperature trend, and I figure it will be at 0.5-0.6°C, using the current 1991-2020 baseline.
It’s amazing isn’t it, that even with H-T, even with CO2 and methane emissions reaching new records, the trend is still 0.14°C – rock steady (if you ignore the steps).
The decay side of the peak by visual appearance could be almost over for Australia.
But, visual is as unreliable as other beliefs. For example, how could atmospheric CO2 produce these patterns of peaks of a few months duration?
We are spending vast fortunes on “carbon” when nobody has a clue about its effects, including me. Geoff S
“We are spending vast fortunes on “carbon” when nobody has a clue about its effects”
Yes, our leaders are shooting in the dark when it comes to CO2. They have no clue.
… we are analyzing the potential (and natural) warming impacts of the 2022 eruption of the Hunga Tonga submarine volcano and its injection of water vapor into the stratosphere… At this point, it appears this influence will be minor, perhaps a few hundredths of degree.
This really has no merit whatsoever, if he stands behind this statement he is obviously wrong. But this is not a paper, it is an off the cuff statement without anything to back up such a statement.
When there are several published papers about how the HT eruption will and is causing the anomalies observed. You people are mind boggling. Do you just get up each day and decide what to blindly follow for the day?
Did Christy modify their climate models to deal with massive clouds of stratospheric water vapor migrating from latitude to latitude (as we speak) each month, no he did not. He wrote a summary for August and gave an opinion about the ratio of aerosols to water vapor injected and its impact on climate. Why would anyone even bring up SO2 on this, it is a non issue in this grand experiment, I will tell you why. Because he no experience with this event, nor does anyone else.
GTR_202308AUG_v1.pdf (uah.edu)
If there are several then it should be easy to post links to say 5 of them (to match the 5 below that say otherwise) showing that the current anomaly (0.93 C) would be 0.90 C higher than that of the month of the eruption (0.03 C).
Jucker et al. 2023
Jenkins et al. 2023
Zhang et al. 2022
Zhu et al. 2022
Sellitto et al. 2022
You are so predictably boring Rusty. What happens when the anomaly is +2°C and there’s nothing but beneficial effects?
I’m all for beneficial warming but I don’t anticipate that it will last, unfortunately.
Warming being beneficial does not falsify the hypothesis that Hunga-Tonga only has a minor effect on the global average temperature.
I have always been a skeptic of Hungry Tonka, so I don’t know what point you’re trying to score here.
TFN was saying that Hunga Tonga has minimal effect on the global average temperature. I’m pointing out that the debate regarding whether warming is beneficial or not is irrelevant to the evidence that the HT eruption has minimal effect on the amount of warming.
Wow, Hunga-Tonga, ship SO2 emissions, net radiative heating resulting from aerosol decreases….we’re really grasping at minor effects compared to the reflection of incoming solar by Earth’s 65%+/- 15% cloud cover, +/-100% over large patches. Temp Variations are evident monthly on UAH, RSS, and are simply not explainable by anything other than more or less sunlight reaching the surface causing convective cloud randomness.
And long term variation in average cloud cover will be the overall result of sea surface temperature changes, a self correcting feedback loop that has a half-life of about 500 years at the present configuration of Earth’s continents and polar ice sheet extents, with multi-decadal fluidic oscillations of AMO, PDO noticeable over our brief instrumental record, somewhat longer for Ecuadorian fisherman’s collective memories.
Exactly right DMac. Hungry Tonka? meh! Aerosols? yawn! CO2 emissions? Uh uh. Natural variability? ding-ding-ding!
How fortunate we are to live in a time where natural variation is resulting in life-nurturing warmth rather than the alternative. If our life-enhancing industry is also paying a small dividend of warmth, all the better!
Not to worry, Nail. If the proletariat keeps refusing to knuckle under the constant barrage of climate alarmism, your beloved Left has a ready backup plan in the form of nuclear winter.
I wouldn’t describe myself as ‘on the left’, but carry on.
Why don’t you describe your position on the “climate crisis”?
He might be going through that “crisis of belief” that many religious adherents go through from time to time.
no-brain-left… would be more appropriate.
I wish you wouldn’t put it like that, it’s terribly gauche.
Not on the left—rotflmao
The Right has become completely silent when it comes to so-called “Climate Change.”
Maybe they have EV and solar panel investments.
Yes, in the 44 year satellite data. Was the global average temperature briedly warmer in the 1930’s? We don’t know. Didn’t have satellites then. Warmer during the peak of the prior interglacial 125,000 years ago? We don’t know. Didn’t have satellites then. Will the recent brief spike in warming rapidly decline like past large El Niños? We don’t know but very likely, based on past observations. Is there any imminent disaster due to a brief warm spike? Based on previous ones, no. Is Earth on the precipice of a global disaster from recent warming? No, the roughly 1 °C warming since the 1850’s has been beneficial for humans as the explosion of the population and improved crop yields have demonstrated. Will the recent warming and increase in CO2 spiral out of control into a hot Earth, stifling all life? Based on hundreds of millions of years of evidence, extremely unlikely.
So why worry? Move on and enjoy your life. And turn off the “news”. You’ll be amazed how much it will improve your outlook.
Thanks for your advice, stinkerp. I would say I was more interested than worried.
Sorry if I ever gave you grief – there are many positions on CO2 and climate, and if you defend CO2 causes warming, you may inadvertently be lumped into the “CO2 causes catastrophic warming and so we need global communism and de-industrialization” category.
Yet you continue to carry-on in utter panic over a fraction of a degree of El Nino warming.
You should watch your antics….They are hilarious.
“Yes, in the 44 year satellite data. Was the global average temperature briedly warmer in the 1930’s? We don’t know.”
No, we *do* know it was as warm or warmer in the 1930’s, as it is today. We have written temperature records that show it was just as warm in the recent past as it is today. Records from all over the world show this same temperature profile.
Can you post a global average temperature dataset showing that it was warmer in the 1930. I have boldened the word global to reinforce the idea that we are looking for a global average temperature dataset where global means the entire Earth all 510e12 m2 of it.
The GAT is a meaningless index that tells nothing about “the climate”.
“Can you post a global average temperature dataset”
You ask this stupid question every time.
Where do you think the Data Mannipulators got their data? Answer: From the regional temperature charts that show it was just as warm in the Early Twentieth Century as it is today. The regional charts you disparage.
Numerous regional temperature datasets from all around the world showing the very same temperature profile are equivalent to your computer-generated “global” dataset.
They are what make up the global dataset. That and the bogus sea surface temperatures the Data Mannipulators added in to cool the past and make the present look like the “hottest year eva!”
You are making a silly argument to try to cover up for the fact that regional temperature profiles do NOT look like the profile of the bogus, bastardized Hockey Stick charts you are in love with.
Do you have a link to a global average temperature dataset showing that it was warmer in the 1930’s or not?
Did you know there is a global temp link in the right hand margin of this page? The data is a little complex. It measures the monthly deviation from a running 12 month average temp compared to a 30 year average temp. The deviation has been reported for about eight years, as I recall. The site monitors and records between 50,000 and 70,000 weather stations every hour. Data is gathered from four sources – 2 administered by NOAA, and 2 affiliated with NOAA. There are limited stations in the Southern Hemisphere, so the temps are probably biased towards N.H. temps. Curiously, except for a recent 2 month heat blip, the deviation has stayed around +0.15 F for the last year. If you click on the link, they chart out all their monthly deviations for you. I am not a scientist, but I am curious to hear what others think about the data and analysis on the site.
Yup, and everything is still OK!
Enjoy the warmth while it lasts.
Yes, in this series its going to be the warmest since 1979. Not a very long time series for climate trends. But the two questions are, is this fluctuation natural or anthropogenic or both, and if both, in what proportions and with what uncertainties in the estimates?
And, will the policies advocated by the alarmists either work or make any material difference?
Its the last that is the critical point. The current policy agenda from activists is to move everything in the West to electric, and to supply the electricity from wind and solar. Its impossible to do because of intermittency. Even were it possible, it would only address one third of emissions, and then only in the West, which is only about 25% of global emissions and falling. Because none of the rest of the world has any intention of reducing their emissions. On the contrary, their priority is economic growth, and they will increase fossil fuel use and emissions as needed.
All you have to do is look at China. More coal mining and use than the rest of the world put together, more coal generation plants approved in the first six months of this year than the current total production capacity of the UK or France or Germany. No intention of reducing. India similarly committed to increases.
I don’t think anything much is happening to global temperatures other than natural fluctuation. A very modest anthropogenic upwards trend but nothing to get worried about. But whatever anyone thinks about this, even if they think there is a huge strong anthropogenic trend, current activist policies are just ways of having no effect on it at vast expense which would be better incurred preparing to protect our populations about the putative climate damage from China.
“All you have to do is look at China. More coal mining and use than the rest of the world put together”
But… but… green energy is MUCH cheaper than fossil fuels…. /s
And yet there’s no catastrophe and no tipping point.
Record since 1979.
We are in a multi-century slow warming trend since the bottom of the Little Ice Age. Record temps always occur in long term warming trends—-how could they not?
I expect there were frequent “records” for heat set during the Medieval Warming Period.
Looking back only to 1979 is not good science, if you are trying to learn something non-trivial about the climate. After all we’re pretty sure that was a year following a couple decades of cooling.
Still no hockey stick shape to the temperature trend so the alarmists are still not right.
The trend is not matching the rate of CO2 increase either.
Most likely a natural recovery from the Little Ice Age with the ice cores failing to record large natural short term variations in atmospheric CO2 which are probably linked to ocean surface temperatures via the 800 to 1000 year long thermohaline circulation.
Human causation is well short of being proven.
James Hansen’s latest paper says very clearly that there is currently no human caused warming that is distinguishable outside natural variability.
Keep on lying. Maybe there are people here who didn’t see you make a fool of yourself in the previous article.
Read what he said little child.
NOT the unfounded speculation he put with it.
““global warming will soon be apparent above the level of natural climate variability”
What he is saying is that CURRENTLY IT IS NOT.”
Stop your idiotic tantrum about the facts.. It makes you look like a complete moron.
Read the few words before your partial quote “a post-2010 acceleration of global warming will soon be apparent above the level of natural climate variability.”.
Not even you can be so fanatically dense as to think “acceleration of global warming” and “global warming” mean the same thing. So I can only assume your continuous spamming of partial sentence is deliberate lying.
If the warming up to 2010, was attributable to natural variation, then there is absolutely no proof that human generated CO2 was the culprit. There still isn’t enough data from 2010 (13 years) to show that the warming has exceeded natural variation, assuming the 30 year climate change period is not just a made up figure.
I still argue that the “linear regression” being used is still nothing but curve fitting. Time and temperature are not related in any function that I know of. Just because software will give you an equation of a line DOES NOT prove causation.
“If the warming up to 2010, was attributable to natural variation”
Why would you think that?
“There still isn’t enough data from 2010 (13 years) to show that the warming has exceeded natural variation”
I still don;t know what natural variation you are talking about. The question is, is there enough evidence to show that the warming rate since 2010 is greater than the rate before that. I would say not at the moment. That seems to be the point Hansen is making, but predicts it will be evident in a few years time.
Personally I doubt it – but time will tell. In the mean time I prefer to assume that without compelling evidence it’s better to assume the rate of warming is constant. The shirt term rate of warming will tend to oscillate, due to natural variability. It makes no more sense to claim a faster rate means accelerated warming than a flat rate means warming has stopped.
“assuming the 30 year climate change period is not just a made up figure.”
30 years has nothing to do with the case. It’s a useful long period to measure a climate norm, but it isn’t about the length of a trend.
“I still argue that the “linear regression” being used is still nothing but curve fitting.”
Has anyone argued it isn’t?
“Time and temperature are not related in any function that I know of”
Then you should learn linear regression. It’s a function describing the relationship between temperature and time, just as any other curve fitting is. It doesn’t mean time causes the rising temperature. But if temperature is rising significantly over time it implies that something is causing the rise, and the best candidate for the cause is not postage rates.
“. . . and the best candidate for the cause is not postage rates.”
I don’t know. Are you sure there isn’t a correlation?
Correlation does not imply causation.
You should tell your comrades that. However . . . .
“Correlation does not imply causation.”
Yet that is the ONLY thing the AGW scammers have to rely on.
A brief correlation between CO2 rise and fabricated surface temperatures.
Well done, you have just totally destroyed the AGW meme. ! 🙂
“Well done, you have just totally destroyed the AGW meme. ! ”
Heh! I think he just realized his stupid error.
“I think he just realized his stupid error.”
I very much doubt he realises much at all… about anything. !
What stupid error would that be? I make mistakes and try to correct them when I do. But in this case all I said is that correlation does not imply causation, something I’ve constantly repeated over the years.
“A brief correlation between CO2 rise and fabricated surface temperatures.”
You’re an idiot. I just can’t tell if your lack of understanding is genuine or a pretense.
Of course the current understanding of global warming is not based just on the correlation between CO2 and temperatures. It’s a hypothesis that’s been developed I’ve decades, long before the correlation was apparent. The fact that there is now good correlation is just one piece of evidence in support of the hypothesis.
CO2 levels increased from the 1940’s to the 1980’s, yet the temperatures cooled by 2.0C during that time.
No correlation between CO2 and temperatures during that time period.
Hansen 1999:
“yet the temperatures cooled by 2.0C during that time.”
Try to come up with some better falsehoods. Temperatures did not decline 2°C. You keep spamming this ancient graph which is produced by someone you keep saying is wrong on everything, only shows US temperatures, and does not show the cooling you claim.
You cannot just pick out the hottest year and the coldest year and claim that is the amount of cooling over that period. You could just as easily claim on that basis that temperatures warmed by almost a degree over the same period.
“Try to come up with some better falsehoods. Temperatures did not decline 2°C”
Can’t you read a chart? The chart clearly shows a cooling of about 2.0C or more, depending on where you want to start.
Are you saying Hansen’s temperature chart is bogus?
You guys are pathetic.
“Can’t you read a chart?”
Better than you it would seem. You need to explain what you mean by 2°C of cooling. I guess you are just looking at the warmest year and comparing it with the coldest year – but that does not mean there has been 2°C of cooling. For that you need to show a trend or look at what average temperatures are doing. over that period.
The red line shows a 5 year mean and that shows temperatures cooling from an anomaly of around +0.5°C in 1940 to somewhere between 0 and -0.5°C by the 1980s. Cooling of at most about 0.8°C, not 2°C.
If you just look at differences in individual annual values, you could just as easily claim the US (and by your logic the world) warmed by 2°C between 1980 and 2000. A rate of warming of 1°C / decade.
By the way, why do you keep showing Hansen’s US graph, but not the global one he produced at the same time?
Why should there be such a discrepancy between US temperatures and Global temperatures?
Because Σ[Ri, 14, 16] / 3 does not equal Σ[Ri, 1, 80] / 80 where Ri is the temperature in region Ri. [Hansen & Lebedeff 1987]
More generally given the sample S it is not necessarily true that Σ[Si, a, b] / (b – a) will equal Σ[Si, 1, N] / N when 1 < a < N and 1 < b < N.
Your response dances around the question. The U.S. covers a number of latitudes and longitudes. It therefore should provide a valid look at what a well mixed specific greenhouse gas like CO2 does to land temperatures. Why doesn’t it do what the so-called GAT says it should be doing.
All you have done is to state a hypothesis but no direct proof of anything.
Here is my hypothesis: Averaging upon averaging upon averaging data streams, while ignoring the variances in the data streams used to calculate a GAT cause a loss of accuracy and precision in the final value. The inherent meadurement uncertainty of the result is so large that the final value is unreliable and not proof that CO2 is anything but a small, small factor.
There it is. The USCRN is the proof that natural variation is still playing a major role and that UHI is also a factor.
All you must do to disprove it, is show, using data, that CO2 effects can differ at various regions of the earth.
“Why should there be such a discrepancy between US temperatures and Global temperatures?”
That was the question Hansen was asking when he produced the graphs. I think the answer was to do with the cooling North Atlantic. But really you shouldn’t expect a small part of the glob to be in lockstep with the rest of the world. There will always be much more variability, and regional factors.
Checking the UAH data since 1979, and there doesn’t seem to be that much difference between the US and Global values. US is warming at a slightly faster rate, so whatever the issue was, doesn’t seem to be such a factor nowadays.
Wow I never knew that. Thanks for the edjumicashun! But that doesn’t apply to CO2 and temperature surely?
It applies to any correlation.
But I suspect the problem here is nobody seems to understand what “imply” means. “Correlation does not imply causation” does not mean “correlation implies there is no causation”. It just means you cannot assume that a correlation necessarily means there is a causation.
Lack of correlation implies non-causation.
Causation implies correlation.
As CO2 has risen, the southern hemisphere has cooled.
How do you interpret that?
“As CO2 has risen, the southern hemisphere has cooled”
It hasn’t.
UAH shows a warming rate of 0.11°C / decade.
But is it caused by CO2? You can’t even claim correlation between temperature and CO2 when your independent variable is time. CO2 isn’t represented on your time series graph.
“But is it caused by CO2?”
You can’t tell just by looking at the correlation – that’s the point. But CO2 seems a more likely cause than US postage rates.
“You can’t even claim correlation between temperature and CO2 when your independent variable is time.”
The point of that graph was to demonstrate the falsehood of the claim that SH temperatures were cooling – that is against time.
You keep forgetting all the times you make this point, and I have to demonstrate you get pretty much the same result if you make CO2 the independent variable. (Not surprising as CO2 has been increasing along with time.)
Here’s the correlation between CO2 and GISTEMP since 1960.
GISTEMP? Why wouldn’t GISTEMP match CO2.
Anomalies aren’t temperature. They are a ΔT, a rate. Show how the CO2 increase actually affects the real global temperature. What do the baselines do when averaged together? Change everything to Kelvin so you have a zero based temperature. Show me a study that has verified that averaged anomalies are duplicated when you average measured temperatures. Show me a study that has actually verified that the anomaly growth is an accurate depiction of the growth of the global average measured temperature.
How many years have you been arguing this tosh, and you still haven’t the first clue about what an anomaly is. Why would it make the faintest difference to the correlation if you used global temperatures rather than anomalies. The anomaly is just the difference in global temperatures from the base, and the base is just a constant.
You seem to have this odd delusion that anomalies a “rate”, yet you never explain what you think they are a rate of.
Dude, do you have a clue about a derivative of a non-linear function? Climate is even described by the IPCC as a non-linear system, i.e., non-linear functions.
Anomalies are someone’s attempt to determine a piece of climate functions that varies around the globe in a non-linear fashion.
Find a study or textbook that even examines this through mathematics and tell where to find it. You are just like most climate scientists, simple averaging must be ok.
Tell you what, a global AVERAGE temperature is an average. That is the central value of a distribution. Tell us the regions that are have above the mean warming.
“Dude, do you have a clue about a derivative of a non-linear function?”
Do I know basic calculus? Yes. Do I have a clue about what point you think you are making? No.
You are either overthinking, or not thinking at all, about what an anomaly is. You seem to think it’s describing the rate of change of something, but never explain how that works or what the rate of change is against. A derivative is dy/dx. What is dx in your imagination?
“You are just like most climate scientists, simple averaging must be ok.”
As I keep telling you, nobody simply averages thermometer readings to get a global temperature. It makes no difference whether you use absolute temperatures or anomalies, you still need to use some form of weighting to the average.
The advantage of using anomalies rather than absolute temperatures is to reduce problems caused by changes to the distribution of readings – but for any one point in time there is no difference between an average of temperatures or anomalies. The average anomaly is just the average temperature minus the average base value.
“That is the central value of a distribution.”
It’s a mean not a median average.
“Tell us the regions that are have above the mean warming.”
Here’s the GISTEMP map for changes in the annual anomaly since 1970. The average is 0.98°C, so anywhere on the map that is dark orange or above has had above average warming.
The derivative being determined is dT/dt. Are you blind.? The temperature average in based on a month of time. A monthly average is T/month. Subtracting a baseline of T/month gives ΔT/month.
Just what do you think the statement that warming or cooling is changing month to month means?
So practically nowhere on earth is experiencing little or no warming? Why then are so many stations showing no warming? Does that not make you have a smidgen of doubt about what that image is showing? Can you pick out anyplace on land in that image that hasn’t experienced warming?
“The derivative being determined is dT/dt. Are you blind.? The temperature average in based on a month of time. A monthly average is T/month. Subtracting a baseline of T/month gives ΔT/month.”
An average is not a derivative.
Rather than keep throwing out insults, you could just explain with an example what you are trying to say. What does this months anomaly of 0.93°C mean as a rate of change?
A monthly average temperature is not a rate of change, it is not in units of °C / month, just °C, and the same for anomalies.
“Just what do you think the statement that warming or cooling is changing month to month means?”
I think it means people are too obsessed with monthly changes. It’s nonsense to say this month was 0.03°C than last month therefor the warming rate was 0.03 / month.
Rates of change are measured over years, and based on statistics, not a meaningless derivative. A derivative is only telling you the rate of change at a give point in time, which is meaningless when the temperature is fluctuating from month to month.
“Why then are so many stations showing no warming?”
Possibly because the man stations are figments of cherry picking and ignoring obvious problems with the data.
Take Tokyo, which WUWT is constantly promoting as somewhere showing no warming for individual months since whatever cherry picked starting year works. What do you get if you look at the annual averages since 1970? You get well over a degree of warming – despite the fact that the station was moved to a cooler location in 2014.
Look at the word “seems”. I don’t recall Newton’s laws of motion having a “seems” to be the case. I don’t recall Maxwell’s equations being a “seems” to describe electromagnetic waves.
A relationship is such that if I give you x=1, you can tell me y=2. Look at your graph. There isn’t a chance that you can develop an accurate functional relationship from that.
I’ll say it again, an anomaly is NOT a temperature, it is a rate of change, a derivative if you will. Averaging ΔT’s makes the assumption that every place reacts with a similar relationship so you can say the average is such and such.
I’ve never seen that addressed. Everyone just takes it on faith that various rates can be averaged and the result is an accurate depiction of how much the global average temperature has risen.
If you accept that, and it appears you do, then 50% of the land stations, and 50% of the ocean should be on either side of the average.
Where are those 50% located?
“Look at the word “seems”.”
Fine – I should have said it seems logical to me that it is more likely that CO2 will affect global temperatures than postage rates. I didn’t think that assertion really needed a detailed proof – but then I forgot the sort of person I’m arguing with.
“I don’t recall Newton’s laws of motion having a “seems” to be the case.”
He may not have used the word, but that’s effectively what he’s saying. You can never prove that these laws apply universally, just that they seem to work in all observed cases. You can state them as axioms but that just means you are assuming they are correct and seeing what conclusions you can draw based on those assumptions.
“A relationship is such that if I give you x=1, you can tell me y=2.”
Bot in this case it’s not. Perfect knowledge does not exist. Best you can say is that y is on average approximately 2.
“I’ll say it again, an anomaly is NOT a temperature, it is a rate of change”
You can say it as many times as you like, it’s still baloney. You can talk about the rate of change of the anomaly, just as you can about the rate of change of a temperature – but an anomaly on it’s own is not a rate of change.
“”””I should have said it seems logical to me that it is more likely that CO2 will affect global temperatures than postage rates.””””
You still don’t understand physical science after all you’ve been told.
The choice is not between which you think makes more sense from a logical standpoint. That is not the issue.
The choice is if a functional relationship between CO2 and temperature exists. Similarly, the choice is if a functional relationship exists between postal rates and temp.
“”””just that they seem to work in all observed cases””””
That is the point. Newton’s laws DO work in the gravity well of earth. They work EVERY time within nonrelativistic circumstances. There is no “seem”. They are proven experimentally. Heck anyone that’s taken physics labs have had to do the measurements and identify why the results didn’t come out as expected. That is what uncertainty is all about.
“”””Perfect knowledge does not exist.””””
Are you saying I can’t measure time to the second and measure mass to the nearest gram and if I do it enough times I can’t calculate acceleration to the 10-⁸th?
“””””but an anomaly on it’s own is not a rate of change.”””””
Anomalies ARE a rate of change. It is a (±T per time), i.e., ∆T -> T/month. You surely can’t think it is an absolute temperature of anything! That’s absurd.
“The choice is if a functional relationship between CO2 and temperature exists.”
No it isn’t. Of course there is not a functional relationship between CO2 and temperature. There are many different factors that effect temperature and the effect of CO2 is not instantaneous. Hence there will always be different temperatures associated with the same level of CO2.
That does not mean there is not a causal relationship. .
“They work EVERY time within nonrelativistic circumstances.”
They seem to work. But it’s an assumption (a very reasonable one) that they will work every time.
“They are proven experimentally.”
You cannot “prove” something works by experiment. Just that you have failed to falsify them.
“Are you saying I can’t measure time to the second and measure mass to the nearest gram and if I do it enough times I can’t calculate acceleration to the 10-⁸th?”
Of course you can’t. And even if you could, it wouldn’t prove the universality of that result.
“Anomalies ARE a rate of change”
So if an anomaly is 1°C what is it’s rate of change?
“It is a (±T per time), i.e., ∆T -> T/month.”
?
Where did the month come from? If the average anomaly for this month was +1, does that mean it’s warming at the rate of 1°C a month?
“You surely can’t think it is an absolute temperature of anything!”
No. I think it’s the difference between two absolute temperatures, with no time involved.
“”””””They seem to work. But it’s an assumption (a very reasonable one) that they will work every time.””””””
You must enjoy exposing your lack of training in the physical sciences. Newton’s laws of Motion don’t just “seem” to work, they do work when used in non-relativeistic circumstances.
It is obvious you have never had to do precise measurements in a physics lab along with explaining the measurement uncertainty that explains your variance with accepted values. Things like the uncertainty in accuracy and precision of a triple beam balance for measuring mass, the uncertainty in a timing device, the uncertainty caused by various friction components, etc.
It is obvious you have never had to design and build an electronic system with multiple stages and various feedback paths that was unconditionally stable. Mistakes can kill people in autos, factories, and real life.
These laboratory courses in upper level classes arent just for fun, they are deadly serious in showing what it takes to achieve reliable, accurately portrayed results in the real physical world where mistakes can kill. “Seem to” is not acceptable.
=================
“””””Are you saying I can’t measure time to the second and measure mass to the nearest gram and if I do it enough times I can’t calculate acceleration to the 10-⁸th?”””””
“””””Of course you can’t. And even if you could, it wouldn’t prove the universality of that result.”””””
Funny how you can state this and then plot a trend of anomalies portrayed as accurate to the one-thousandths digit using data that was only measured to the nearest integer with a large uncertainty.
Do you see the hypocrisy and irony in what you advocate for Global Average Temperatures?
======================
“””””””If the average anomaly for this month was +1, does that mean it’s warming at the rate of 1°C a month?
“You surely can’t think it is an absolute temperature of anything!”
No. I think it’s the difference between two absolute temperatures, with no time involved.””””””
You are joking again, right?
You just said “for this MONTH was +1”, you just used TIME in your explanation! Why can’t you see “+1/month”, i.e., ΔT/time?
Then when you go averaging this with another ΔT that has a different baseline, what do you get really?
How many zero warming stations are needed to offset 1 degree of warming with averages to one-thousandths of a degree. A thousand maybe? 1/1000.
How about to one-hundredths of a degree? Maybe a hundred? 1/100.
No bias though when doing averaging, right?
“Funny how you can state this and then plot a trend of anomalies portrayed as accurate to the one-thousandths digit using data that was only measured to the nearest integer with a large uncertainty.”
It’s a plot. How can you tell how many digits where used in the data, and why do you think it matters. For the re cord my plots have been using UAH and GISS, both of which only give data to the hundredth of a degree and claim uncertainties of around 0.05 – 0.1°C. None of will have much if any bearing on the correlation between the two.
“Do you see the hypocrisy and irony in what you advocate for Global Average Temperatures?”
You say I’m a hypocrite because I use data published to 0.01°C, when I also point out it isn’t possible derive time to 0.000001 seconds based on an average of measurements to the nearest second. Is that what you are seriously claiming?
“You just said “for this MONTH was +1”, you just used TIME in your explanation! Why can’t you see “+1/month”, i.e., ΔT/time?”
You’re really confusing yourself here.
If you take a sum of temperatures measured over a period of time and divide by that time, you are not getting a rate of change, you are getting an average of those values. You sum of temperatures over that month are in units of degree months, and dividing by the number of months gives you value in degrees. It makes no difference if you are measuring the temperature in absolute or relative to some common base value.
If you measure the difference between the start and end value and divide by the time period – then you are getting the average rate of change.
Where you are confusing yourself is in writing the anomaly as a delta (implying a difference), without thinking about what that difference is.
If it was the difference between the temperature at the start of the month and the end of the month you could say that it shows the average rate of change over that month. But here the delta is referring to the difference between the current temperature and the temperature over the base period. You could say it shows the amount of warming or cooling from that base period, but the rate of change would have to be based on the time between the base period and now.
But this is not particularly meaningful when the base period is 30 years and you are comparing it with a single month. E.g. this month the UAH anomaly is +0.93°C compared with the average October temperature between 1991 and 2020. You could take the base as the average value of the mid point – 2005, and say the average rate of warming for October has been 0.93 / 18 years, that is a warming rate of 0.5°C / decade. But it’s meaningless given that next October may give a completely different warming rate.
“””””But here the delta is referring to the difference between the current temperature and the temperature over the base period”””””
I’m not confused. People, including you, treat anomalies as a Δ when you discuss them. The next time you want to say growth or increase/decrease I will remind you that an anomaly is not a rate and as such, you can’t say that temperatures have changed.
“””””But this is not particularly meaningful when the base period is 30 years and you are comparing it with a single month”””””
Funny you should say exactly what I am saying. It is even worse when you average them with other stations whose baseline value is different.
Better yet, you didn’t you address my questions to you? Does averaging anomalies create a warming bias.
“””””How many zero warming stations are needed to offset 1 degree of warming with averages to one-thousandths of a degree. A thousand maybe? 1/1000.”””””
“””””How about to one-hundredths of a degree? Maybe a hundred? 1/100.”””””
“””””No bias though when doing averaging, right?”””””
Saying you are confused was me being generous. You are not making any sense.
An anomaly is simply the current temperature minus the base temperature. If you want to call that a delta that’s fine – it’s the current change from the base period, but it is not a rate of change, and certainly not the rate of change for a month.
You now seem to agree with that, but for some reason think that this means it’s not possible to say temperatures have changed.
“Better yet, you didn’t you address my questions to you? Does averaging anomalies create a warming bias.”
No.
“How many zero warming stations are needed to offset 1 degree of warming with averages to one-thousandths of a degree. A thousand maybe? 1/1000.”
I don’t know what you are gibbering about, or what this has to do with anomalies. If 0.1% of the world warms by 1°C and the rest have no warming, then obviously you would have an average warming of 0.001°C, which would be well within the error of margin for a global average.
“No bias though when doing averaging, right?”
there can be lots of biases in any average. Perhaps if you could spell out your concern rather than talking in these meaningless riddles, perhaps we could get somewhere.
Look at the attached image.
x = 1 is the average of, let’s call it 3 grid cells, each with an anomaly of 0.5°.
x = 2, …, 19 adds one new grid cell at 0.1°.
Now think about what is occurring here. There is a ratio of like 3:24 or 1:8. In other words it takes about 8 cool cells to offset 1 warm cell.
No wonder the anomaly average shows warming! It is a scam. Each cell should be equal when discussing what is going on globally not based on area but on it’s contribution to the whole..
1/8 = 0.13. So as little as ~15% of the land mass in my example may be all that is actually warming.
Is it any wonder that it is so easy to find places that have little or no warming?
Warming should be displayed in a pie or bar graph showing the amount of warming that is occurring on a global basis.
It would help your argument if you could keep the figures consistent.
I’ll use your pie chart as reference. Here you are saying 16% of the earth has an anomaly of +0.5°C, the remaining 84% has an anomaly of +0.1°C – correct?
The mean would therefore be 0.16 * 0.5 + 0.84 * 0.1 = 0.164°C.
This is the mean, not the median or mode. That’s how the mean works. It’s an average of all the data.
“No wonder the anomaly average shows warming! It is a scam.”
Talk about a non sequitur . I’ve still no idea what you think your pie chart proves. Anything you can say about not liking a mean average works just as well in reverse. What if you pie chat showed 1/6 of the earth at 0.1 and 5/6 at 0.5?
And none of this is to do with the use of anomalies. When you are looking at overall change, the difference would be the same if you are using absolute values or anomalies.
“Each cell should be equal when discussing what is going on globally not based on area but on it’s contribution to the whole.”
What cells are you talking about, and why wouldn’t you want to weight them by area? If you mean the grid used in the global mean, then not weighing by area would mean you were giving far too much prominence to the poles. If you mean the two slices of your chart, why on earth would you want to treat each as equal? That would just give you an anomaly of 0.3°C.
“So as little as ~15% of the land mass in my example may be all that is actually warming.”
Could be – but not actually what’s happening. You can easily look at regional values or any map if you want to see how much and where the earth is warming up fastest, and where it’s cooling.
“Is it any wonder that it is so easy to find places that have little or no warming?”
And it’s just as easy to find places with ridiculously fast warming rates. That’s the nature of cherry picking sites, and ignoring any problems with the data.
“Warming should be displayed in a pie or bar graph showing the amount of warming that is occurring on a global basis.”
Please spare us the pie charts. But there’s nothing stopping you producing a bar graph. Here’s one I’ve done using GISTEMP gridded data. I’ve weighed it by area which for some reason you object to. This is for August and I’m using the UAH 1991-2020 base period. Mean anomaly is 0.6°C, but there are some small areas around the Antarctic which are up to 10°C below the base period, and other areas closer to 4°C above.
September is the opposite. The antarctic now has temperatures up to 10°C above average.
The graph –
And if you really want a pie chart, here’s the best I could come up with.
I didn’t figure you would. What does global mean to you? Is the whole globe warming at the average or only a small part?
It really goes to why an average doesn’t properly inform one of what is happening at local areas.
Usual deflection. Rather than explaining any of your claims you start demanding I answer your questions.
So far as I can tell Jim’s claimed:
None of these are ever likely to be explained, without raising more questions.
“What does global mean to you?”
It can mean lots of things. Having the shape of a sphere, something that affects the entire globe, or something that is universal.
Obviously the middle one is most pertinent to the phrase “global warming”, but I wouldn’t take the word too absolutely. Global things rarely affect literally the entire globe. There was “global” war in the 40s, but many parts of the world were not at war, and many more never saw any conflict.
Global warming is specifically about warming the entire globe, as indicated by the global average. But you do not expect every part of the globe to warm at the same rate, or even every part to warm. It’s always been acknowledged that some parts may be cooled due to the changes caused by global warming. That’s one reason why climate change is a better description that global warming.
“Is the whole globe warming at the average or only a small part?”
Of course the whole planet is warming at the same rate, anymore than all prices rise at the average rate of inflation. But that doesn’t mean only a small part is warming. Some places are warming slower than the average some faster.
“It really goes to why an average doesn’t properly inform one of what is happening at local areas.”
And as I keep telling you and your brother – knowing what the average is, does not destroy the data showing regional changes. If you would only make the effort you can easily find data breaking the data down into specific regions, maps showing global anomalies for specific months or longer periods, and in many cases the data grids, giving global coverage.
Yes, I was wrong about that specific point. My general point however is that causation requires correlation. (By which I mean agreement with the hypothesized model whether linear or not). A significant period of time where the observations run counter to the model should reject the hypothesis or at minimum imply that there is a complex system where other factors are more important.
“My general point however is that causation requires correlation.”
Sorry I missed this.
Whilst this is correct in principle – I think you have to be careful top distinguish this from observed correlation. A correlation will exist is there is causation, but it may not always be observable. This can happen either because there is insufficient data to confirm a significant correlation, or because any correlation is obscured by other factors. Hence you cannot assume that just because no correlation is observed, that proves there is no causation.
It’s the old saying “absence of evidence is not evidence of absence”.
Patently False. The lack of correlation most definitely does not imply absence of causation. This is one most echoed falsehoods I see in the blogosphere.
A lack of correlation (R = 0) only implies the absence of linear correlation. It does not imply the absence of general or non-linear correlation and thus a causal link.
Here is an intuitive and obvious counter example to this common falsehood. Consider two variables that satisfy the equation x^2 + y^2 = 1. Obviously the value of x dictates what y can be and vice-versa. Yet R = 0 in this case.
Let me give you a real world example as it relates to UAH TLT. The correlation between TSI and UAH TLT is R = -0.04 which is about as close to zero as you can get (nevermind that it is technically negative albeit only slightly). One might naively and erroneously hypothesize that there is no causal link between solar output and atmospheric temperature which is obviously absurd. However, if we remove (or control for) the influence of other contributing factors like CO2, ENSO, and volcanic aerosols acting on UAH TLT in a non-linear way we see that the correlation between TSI and UAH TLT jumps R = 0.23. Albeit weak a positive correlation does exist. We can no longer falsify the hypothesis that solar output and atmospheric temperatures are independent.
I was not referring to a correlation coefficient bdgwx (assuming a linear relationship). I was referring to cause and effect more generally. If the observation agrees with the hypothesis it MIGHT be due to causation or it might be coincidence. If the observation disagrees with the hypothesis, the hypothesis is rejected.
I will happily acknowledge that there might be a case where there is an effect which is in fact caused by a factor but which is not observable because a more powerful conflicting factor has a countervailing effect. While true, it also implies that the unobservable effect is irrelevant.
Directionally, you can improve the correlation of a GAT v time fit to the data from ~0.25 to over 0.95 by introducing an annual sinusoid and adjusting its amplitude to maximize its R value. This is obvious, but is it an example of what you are referencing?
Actually no. It only implies there is not a single factor, i.e., there may exist a polynomial of 1st degree. Of course there may be a polynomial of various degrees or even more complicated relationships. The various gas laws were discovered in this manner, which lead to the combined ideal gas law.
That is why physical experimental data where factors are held constant (as constant as you can) are needed to identify relationships.
We have already seen that the “acceleration” part of Homer’s statement is basically UNTRUE.
Words like “will soon” are NEVER part of a science paper.
It is just his speculation and fantasy, unbacked by any actual science or measurements.
I can only assume you are IGNORANT of that statement being just mindless speculation.
But that is all AGW really is.. mindless speculation.
Which explains why little children like you fall for it so easily.
Bell ringer just realized he twisted the pooch. Since there must be a correlation between postal rates and temperature, it destroys their whole premise. I couldn’t believe he handed an easy counter to their silly position. So every time Mr. J or Last Nails makes the assertion, I will refer to this nonsense.
“We have already seen that the “acceleration” part of Homer’s statement is basically UNTRUE”
You’ve claimed it’s untrue. As you haven’t shown any understanding of the prediction, but happily admit that there is too much natural variability to say at present, I’m not sure how you think you can prove it’s untrue.
“Words like “will soon” are NEVER part of a science paper.”
And they don’t appear in this paper.
“It is just his speculation and fantasy, unbacked by any actual science or measurements.”
Really? Are you sure that’s not just your prejudice?
” a post-2010 acceleration of global warming will soon be apparent above the level of natural climate variability.
ROFLMAO
So what you are saying is that not even the fictitious post-2010 acceleration is currently apparent above any natural variability.
Can your comments get any more ludicrous, idiotic and self-defeating !!!
I’m sure will continue to try to find ways to display your absolute lack of cognitive functionality. !
“So what you are saying …”
No. What I’m saying is that you are lying about what the article said. Claiming that Hansen is saying global warming is not yet apparent, when it’s actually saying an acceleration in global warming is not yet apparent.
This has been your MO over the last few months. Endlessly misinterpreting or just making up statements, and then claiming some petty victory. I’m just drawing attention to your bad faith arguments.
WRONG.
It is your total lack of basic comprehension that is the problems.
Your lack of coherent logical argument is based purely on your cult-like faith. !
This is you only MO… a mantra-based lack of basic comprehension… your tiny mind twisting everything to suit your pathetic little agenda.
What do you think “will soon” implies.
If someone says they will be there soon…
.. it implies they are NOT there yet.
Try to gain a basic understanding of English before you continue to make a monumental fool of yourself.
acceleration not yet apparent…. Therefore no proof it is happening…
So sad… that you have tried to prove Hansen wrong…
You really tied your tiny little mind in a knot haven’t you, petal !!
You are sounding really obsessed about being called out on this.
“What do you think “will soon” implies”
I think it implies something will happen in the near future. But as always you are trying to distract from your own lies. The issue is not about how soon it is predicted to happen but about you twisting it to imply the “will soon” is about global warming, and not as Hansen is claiming the acceleration of global warming.
“I think it implies something will happen in the near future”
Based on what?? baseless anti-science speculation.
It is a meaningless statement…
A cult religious statement..
You have just said that even the fantasy acceleration is not yet apparent.
So funny that you can’t see how stupid your comments are. ! 🙂
Nice one, Skippy.
Looks like we’re all going to die of global boiling. Again.
I wouldn’t mind a bit, now it’s turned November.
Anything to do with that huge underwater volcano eruption earlier in the year and the vast amount of water it flung into the atmosphere, I wonder?
Not according to spencer and Christie of UAH. They state in their August 2023 Global Temperature Report (see link above):
“appears” isn’t scientifically convincing
“appears”
Seems you don’t understand English.
Well there are 2 ways that amount of water can influence weather or temperature; by suddenly being launched into the atmosphere as if from nowhere and then, after a while, leaving the atmosphere again. Let’s just see what the longer term effects are, shall we?
See if you can comprehend any of this, Fungal Toenail !
The unexpected radiative impact of the Hunga Tonga eruption of 15th January 2022 | Communications Earth & Environment (nature.com)
It is actual science… so I doubt you will understand a single word.
Poor red thumbs.. Measured explanation is just way too much for them to comprehend.
So sadly pathetic. ! 🙂
That is the best and only explanation that I have heard.
That is what the science indicates, and what the data indicates.
The unexpected radiative impact of the Hunga Tonga eruption of 15th January 2022 | Communications Earth & Environment (nature.com)
It was 150 MtH2O. That is hardly what I’d call vast considering there was 13,000,000 MtH2O already in the atmosphere [1] [2]
Just replace atmosphere with stratosphere and then it will make more sense.
Sure, 150 MtH2O is significant for the stratosphere relative to what is already there. But to put that into context since the Hunga-Tonga eruption about 6,500 MtCO2 got added to the stratosphere. 150 MtH2O is lot in relative terms because the stratosphere is dry and thin.
Reference?
My understanding was that the troposphere and stratosphere don’t mix much in the same way the ocean doesn’t mix with the water below the thermocline.
[Diallo et al. 2017]
[Friedlingstein et al. 2023]
It only matters high in the atmosphere which is far less dense. Low atmosphere water vapor is highly saturated for absorption of surface IR.
That’s funny – at the same time you claim that an extra one molecule of CO2 per10 000 air molecules is having a measurable effect on Earth’s climate.
My point which I was hoping would be understood by inference is that some so ready to implicate one molecule per 100,000,000 in several tenths of degree of warming when it is H2O, but scoff at that one molecule per 10,000 can do anything at all when it is CO2. Make that make sense.
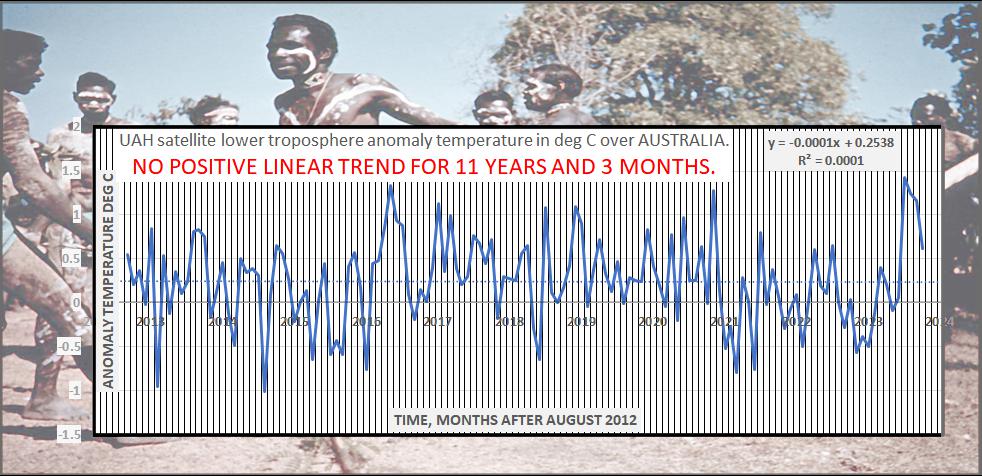
The trend of the localized high peaks in the UAH anomaly data is roughly +0.13 C per decade, which is in alignment with the overall long term linear warming trend of +0.14 C per decade when all UAH data is included.
All it means is that the earth continues to warm at a more or less steady pace. We should not be surprised if the occasional localized high peak is warmer than the previous one by some predictable amount. Therefore it is no surprise that the latest exceptionally high peak, 2023, is warmer by a predictable amount, roughly 0.3C, than was the previous exceptionally high peak, 1998.
What will 2024’s UAH data bring? The answer is ….. whatever it brings.
True up to a point. What’s been unusual this year is the timing of the peak. Usually El Niño effects reach their maximum in the spring of the following year. That’s why this year is seeing so many records broken. August – October do not normally see such high anomalies.
The question is, is this current warming the result of this El Niño behaving in an unexpected way? Or is this the result of some as yet unknown effect which will be in addition to the effects of the El Niño next year?
There will always be anomalies in how and when the temperature anomalies anomalize. It is to be expected in a partially chaotic system.
For myself, my primary interest lies in energy policy and in the data and information used to inform energy policy decisions.
For purposes of energy policy decision making, all this speculation about near-term temperature trends and their possible causes hasn’t changed my opinion that the earth is steadily warming as a consequence of some combination of natural and anthropogenic causes; and that the earth will continue to warm long into the future with occasional pauses here and there along the way.
Time to make a killing in real estate in Canada and Siberia and Scandinavia.
But, strange that so many Americans rushing to hot, steamy Florida.
See you say that and then you completely discount any possible influence from the Hunga Tonga eruption. This warming is an unexpected anomaly and the only difference between this and previous el Nino years was the eruption. I’d say that’s a possibility right there.
“See you say that and then you completely discount any possible influence from the Hunga Tonga eruption.”
Why does everyone here insist on arguing against things I’ve never said? Where have I discounted any influence? I’m specifically saying that if the current warming is not the result of the El Niño, then it must have some other causes. Obviously HT is one possibility. I’m making no assumptions about how likely that is, given I have no expertise in the matter, and the experts don’t know the answer.
Certainly there can be absolutely ZERO human causation of the current temprature transient.
Surely not even you are dumb enough to suggest there is. !!
You have shown no expertise on anything, but that hasn’t stopped you making idiotic comments in basically every post you make. !
Or is it just the effect of transitioning out of the cooling La Nina influence of the past 3 years or so? Maybe the El Nino warming hasn’t registered in UAH yet?
The “Earth” is not warming. Some parts of the surface have increasing surface temperature, some parts have no trend and some parts are cooling. The place and time of most “global warming” is the Greenland Plateau in January. It is trending up at 9C/century. Also gaining in elevation at 17mm per year.
The Southern Ocean has a sustained cooling trend of 0.6C/century. In fact, the entire SH south of 40S has a cooling trend.
“Global warming” is currently hitting land north of 40N. It is the white stuff coming out of the sky. It requires warm oceans to evaporate the water into the atmosphere that peaks in September, gets transported across land in October and drops out as snow in November on any land cooler than 0C. This is what the termination of the present interglacial looks like.
Snowfall records will be a feature in the NH for the next 10,000 years:
https://www.msn.com/en-us/weather/topstories/snowfall-record-set-in-detroit-on-halloween/ar-AA1je3EO
The peak solar intensity over the NH only started increasing 500 years ago. That will continue for the next 10,000 years. The peak temperature across the northern oceans has increased from 22C to 23C in the satellite era. It has a long way to go.
So there is indeed an upward trend in the average surface temperature and is to be expected as the peak solar intensity shifts northward. That trend will continue until the snowfall overtakes the snowmelt again and the land begins to accumulate ice. So far that is only occurring on Greenland due to its proximity to water.
A cooling trend anywhere invalidates all climate models because they can only have warming trends everywhere given that CO2 will keep going up.
I miss the Monckton of Brenchley posts.
So do I. In addition to being highly entertaining reading, the Monckton of Brenchley posts spawn much informative commentary from a variety of differing opinions. Which is the true mission of the WUWT blog.
The pauses were always doomed to be limited. If we ignore the millennial warming underlying all the other natural cycles, the AMO and PDO appear to be the most significant climate factors. If they are both in cool phases you get cooling. If they are both in warm phases you get warming. Otherwise, there’s little trend.
The AMO has been in it’s warm phase since 1995. This means you can get pauses during negative PDO phases but no long term cooling. The pauses would eventually falter. The first pause ended with PDO warm phase starting in 2014.
With the ~30 year AMO cycle due for a change in another couple of years, that’s when the real pauses could kick in. The effect of the current El Nino and H-T eruption should be minimal by that time.
ENSO tends to create peaks/valleys from which pauses can be be set against. Some consider it a major factor. I’m more of the opinion that the warming has come from the AMO/PDO.
Richard, the PDO is not a sea-surface-temperature-measurement-based index like the AMO. The PDO represents the spatial pattern of the sea surface temperature anomalies of the North Pacific, North of 20N. As such, the PDO has no relationship to the sea surface temperatures of the North Pacific and cannot create warming.
Regards,
Bob
PS: If I get the time, I’ll find links to past posts here at WUWT where I explained what the PDO is and isn’t in more detail.
I know it’s only an index. However, it measures changes in atmospheric air flow patterns which certainly can “create warming” via changes in cloud cover. The warming which followed the +PDO phase change in 2014 also correlated to an decrease in cloud cover.
There is no technical reason for his absence. It is likely the start date for the new pause is already behind us. That’s a consequence of how pauses play out. The starting point of the new pause often overlaps a bit with the ending point of the previous pause. It is a phenomenon many of us here have pointed out to Monckton on multiple occasions. He could be promoting the new pause already.
Always an El Nino that breaks the “pause”…
Great that you are agreeing that El Ninos contribute the ONLY warming in the atmospheric data.
Same here, and I really hope his absence isn’t down to poor health. But it is out of character for him to be absent for so long.
Well, I miss Monckton’s posts too. Except the “pause” ones, which were an ongoing insult to our collective intelligence, and only served as an opportunity to remind us of his lordly presence and his ability to juggle numbers to no practical purpose. So I’m heartened by the fact that we can look forward to a few pause-free years.
I always intended to reply to his pauses by generating a few equally meaningless cooling trends from the UAH LT data, but never found the time or the energy to do it. Plus it might have looked like an egalitarian pleb taunting a peer of the realm from the safe distance of a former colony.
Don’t get me wrong; I like his Moncktonship a lot, and he’s an asset to the coming revolution when the oppressed sceptics, the realists, and the real scientists rise up and smash the ruling idiocracy.
I did reply and pointed out it was doomed because the changing orbit has only just started to warm the northern oceans. Just 500 years into a 9,000 year increase in peak solar intensity. This is the summer solstice solar intensity at 44N:
http://vo.imcce.fr/webservices/miriade/proxy.php?file=http://145.238.217.35//tmp/insola/insolaoutlcruch&format=text
It bottomed at 483.7W/m^2 500 years ago and has only increased 0.2W/m^2 so far but will end up at 505.3W/m^2 in 9,000 years. So a lot more warming to come. The lower northern latitudes bottomed a bit early, for example, 30N is up 0.5W/m^2 from its bottom 800 years ago.
I think you are on to something.
Especially when the Southern hemisphere is cooling while the Northern hemisphere is warming.
I don’t see how CO2 or SO2 could cause that.
We’re going to have to start talking about Hemispheric Warming and Hemispheric Cooling in the future, because the Hemispheres are going their separate ways when it comes to temperatures.
Promoters of CO2 and SO2 warming should explain how the Southern Hemisphere in now in a cooling trend in this era of AGW. Does CO2 and SO2 only affect the Northern Hemisphere?
Better to say CO2 warming and SO2 cooling.
The warming impact related to SO2 is (hypothetically) due to a reduction in SO2 aerosols.
If caused by industrial air pollution, aerosols would naturally have a much bigger impact in the northern hemisphere where industry is concentrated—in particular China, Europe, North America. Of course volcanic eruptions periodically occur in either hemisphere.
CO2 on the other hand being much less variable away from the surface ought to produce its (hypothetical) warming more uniformly.
There isn’t an increase in SO2 aerosols to explain the long-term cooling of the southern hemisphere so that is evidence that the CO2 warming hypothesis is busted.
Currently, there is a non-positive trend back to October 2015 in the UAH data.
And from three other months. Your cherry-picking window is getting quite small for the moment.
Again.. you are showing your ABJECT IGNORANCE of the method of calculation.
I didn’t cherry pick anything.
It is a purely mathematical calculation from the data.
Yep. Just as if I looked back over all the months to find the start point that gives the maximum rate of warming, would be purely calculated from the data. You can calculate a lot of things from data, it doesn’t mean they are all meaningful.
Here’s the purely mathematical calculation in context.
ZERO context.
Again.. you have used El Nino steps to produce a linear trend
There is actually a ZERO trend between each of the major EL Nino events.
Your graph is just TOTAL IGNORANCE on your behalf.
But we don’t expect you to understand or fix that lack of comprehension.
And, of course, if we had reliable instrumental data back to the MWP and further, we would see a cooling trend over the last 10,000 or so years.
Had expected a bit of a cool down from last month.
This beats the previous October record (2017) by 0.46°C, and marks the 4th month in a row to set a record for that month.
The top 10 warmest Octobers in the UAH data set are now:
The top eight have all been since 2015.
The so called pause hangs on, now starting in October 2015, but there are only four starting months where any negative trend can be seen.
Seems almost certain that 2023 will be the warmest in the UAH data set, something that seemed almost impossible after the first few months of the year.
See my comment here.
I’m grateful for every week that I can defer ramping up the home heating system.
Longer term, I would hope for a goldilocks era of climate conditions in my locality that would enable mothballing the heating altogether.
50 years of such conditions would be great, because by then we’ll all be getting our electricity from a local SMR at such low cost, nobody will even be talking about the cost of electricity.
(Like the look of confusion / disbelief I got when I asked a taxi driver in UAE how much he paid for gas).
In 50 years I’ll be getting my warming from the ground, closely packed!
#metoo.
Except that I’m donating my carcass to medical research.
Specifically, can an intake of 370 mls of whiskey per week for ~ 25 years preserve the carcass of an old white conservative male in a desiccated state that can be used as a Halloween prop?
“. . . used as a Halloween prop?”
It would be neat to use your skeleton as a prop. It would scare me. I watched “Exorcist Believer.” It was a very slow, scary movie. Bring lots of popcorn–you need to do something with your time during the dull parts.
Yes, but as Hansen said..
…. There is currently no human warming discernible outside natural variability.
I’m sure you are well aware by now that all the atmospheric warming has come at El Nino events.
Just keep lying. I’m sure there are many here gullible enough to believe you.
Keep DENYING what he said.
DENIAL is all you have. !
I’m sure NO-ONE here is stupid enough to believe you..
… (except your mate with the Fungal Toenail)
They can all READ and UNDERSTAND… something your cult-like denial does not allow you to do.
Could you give the exact quote you are referring to, along with evidence that he actually said it. Using his exact words and quoting the entire context.
Then we can agree both that he is wrong.
But in the mean time all you have is a paraphrase of what someone thinks he is saying in the paper
Which you have deliberately taken the partial sentence “…global warming will soon be apparent above the level of natural climate variability”, omitting the preceding words “post-2010 acceleration of…”.
Rather than accept you took it out of context, you have doubled and redoubled down. Telling the faithful here that Hansen has claimed that global warming is not yet apparent, when the passage is clearly saying the predicted acceleration is not yet apparent.
This new paper predicts that a post-2010 acceleration of global warming will soon be apparent above the level of natural climate variability.
Tell me, how can an acceleration of anthropogenic warming ”soon be apparent” if no one knows what the ECS is? Models?
Give us a break for Christ sake.
You’ll have to take it up with Hansen. It’s his theory.
“It’s his theory.”
NO.. it is mantra based speculation. !
Absolutely no way it gets anywhere near being a theory.
Heck, his little fantasy of “post-2010 acceleration of global warming”
… isn’t even apparent above the level of natural climate variability.
He says it “will be soon”…
… but that is a meaningless anti-scientific prediction.
That is what you are trying to defend… a meaningless anti-science exercise in crystal ball gazing..
.. and you are TOO DUMB to realise it. !
“This new paper predicts”
MEANINGLESS and irrelevant.
“post 2010 acceleration”
Provable UNTRUE… so stop LYING.
“global warming will soon be apparent above the level of natural climate variability”
This implies that currently it IS NOT apparent above natural variability.
The “will soon” part is also just a speculative guess, and does not belong in a scientific paper.
Sorry if English is really hard for you, and basic comprehension is an anathema to you.
I can’t fix your ignorance… and I doubt anyone else can either.
“Provable UNTRUE… so stop LYING”
You are really getting desperate. How am I lying, I’ve literally just quoted the article? I make no comment as to it’s accuracy – I’m just calling out your bad faith misquoting of it.
“This implies that currently it IS NOT apparent above natural variability.“
You can always tell when people know they have lost the argument round here. They start repeating their lies in bold or all caps.
Once again you are taking a single phrase “acceleration of global warming” and splitting it up to imply it’s only talking about the “global warming” part, and not the “acceleration of global warming”.
“Sorry if English is really hard for you, and basic comprehension is an anathema to you.”
And then resort to patronizing insults. And this from someone who pretends not to understand what the word “of” means.
You are demented.. !
Zero comprehension… just petty mindless trolling in a desperate attempt to hide your ignorance of what was written.
Double down, triple down….
… and just keep sinking further and further into your fetid sewer of mindlessness and ignorance.
Acceleration of global warming ???
Hansen says it not yet apparent above natural variability..
That is what you keep telling us he said..
Your level of cognitive malfunction is totally hilarious :
Please keep going ! 😉
Stop panicking.
All you have to do is accept that the article says that acceleration of global warming is not yet above the level of natural variability, and then we can all agree on that.
Trying to pretend it says that global warming is not apparent is an obvious falsehood, and lashing out like this when someone points it out does your cause no good.
I’m not sure where you and bnice each stand on this point. Could you each repeat your point another couple dozen times without modification so that we can be sure?
The increase of anomaly aloft and the decrease of anomaly at surface indicates negative feedback process dominant in October.
Another month and another record. Odds are now favorable that the Monckton pause will come to an end by December if not next month. November only needs to come in at 0.44 to end the pause.
The 13m centered average is now 0.38 and just shy of the 0.39 peaks in 2016 and 2020. If November comes in at 0.58 or higher then 13m record will be broken as well.
November and December only need to average 0.20 C for the annual mean in 2023 to hit to 0.40 C and break the previous record of 0.39 C set back in 2016. This is more likely than not now.
The 36m and 12m Earth Energy Imbalance (EEI) from CERES holds steady at +1.5 W/m2 and +2.0 W/m2 respectively. So we have both a record high temperature and a record high EEI. This is highly suggestive that while 0.93 C may be a top in the short term it is nearly certain that it too will be eclipsed eventually in the long term. Of course, considering that UAH TLT lags ENSO by 4-5 months there is a chance (albeit with diminishing odds) that we have not yet seen the short term peak either since the ENSO region is still warming.
Be careful what you wish for. I’m also certain the pause will end soon, but not so sure it won’t eventually enjoy a rebirth. Will a La Nina to take hold after the current El Nino? Will the H-T effects subside quickly? When will the AMO start its expected phase change?
I’m not wishing for anything. And I can guarantee you there will be a rebirth of a pause. In fact, as I’ve stated many times already it is likely we already in the new pause. How do I know this? Because 100% of all months in the UAH TLT record are contained within a pause of a significant length.
Yes.. Thanks for admitting we get a “pause”, or rather a ZERO-TREND period, between El Nino events
Perhaps you do have a capability of seeing what is real
Apart from those El Ninos event… UAH is all PAUSE. !
bdgwx,
The “pause”, Monckton style, is at 11 years 3 months for the lower troposphere over Australia. The current “peak” now has 4 successive months of decline from the top. Illustrated elsewhere in this article.
The mechanisms and measurements described by Ric Will above seem rather better than stuff involving CO2.
Geoff S
The whole global ΔT concept as implemented is questionable. As people all over keep posting stations that have no warming, one has to start asking where is the growth occurring. Averaging rates based on non-constant baselines is not a good way to get an idea of what is occurring. At best, 50% of the rates are below the figure and 50% are above, assuming a normal distribution. Has anyone seen the 50% above the mean posted anywhere?
I’ll take my temperature analysis from the US Climate Reference Network. I don’t worry much about the anomaly graph with the exaggerated Y-axis. I look to my right and the global temperature is 57.32 degrees. Ho hum. Not too much to worry about. I prefer about 85 degrees personally.
USCRN is good if you want to limit your analysis to the CONUS only. You may be surprised to know that USCRN has a warming rate of 0.30 C/decade. That is higher than the 0.23 C/decade trend from UAH over the same time period. Not that it means anything since the UAH graph above is the global average and USCRN is the CONUS average.
That is no statistically significant difference between UAH UAS48 trend and USCRN trend.
The range of UAH USA48 data is much larger than UAH global
The trend error range of UAH Global is wholly contained within the trend error range of USCRN
Your statement is meaningless.
Make that 85.325 degrees!
You’re limiting actual precision. It should be 85.3249999999.
Here is additional evidence suggesting that the recent increase in global temperatures is not primarily caused by CO2:
In the Arctic, temperature trends have not mirrored those of the rest of the world. Temperatures in the Arctic, even after the peak during the 2015-2016 El Niño event, remain significantly higher than current temperatures. Although there was a spike in August, it has since declined. Such spikes are not uncommon in the Arctic, and there have been numerous anomalies in the past that either matched or surpassed the anomaly observed in October. If CO2 were the primary factor responsible for these temperature changes, we would expect Arctic temperatures to have also exceeded the levels seen during the recent El Niño peak.
Makes perfect sense, the Arctic generally responds differently than the Antarctic.
The HT eruption is likely the cause of the anomalies. For someone to attribute this to El-Nino or CO2 they may as well just say that it just happened for whatever reason. El-Nino does not perturb Antarctic Sea Ice in swings that have never been observed before by a wide margin. And it makes perfect sense that the Arctic did not experience these temperature anomalies.
That will come next year.
Hunga-Tonga had no more effect than a zit on an elephant.
Right, you completed a sentence, congrads.
Give science a try, it works.
Tonga eruption increases chance of temporary surface temperature anomaly above 1.5 °C | Nature Climate Change
It’s interesting that the increase over September is only 0.03 given the ‘strong’ El Niño. See the ENSO forecast and it seems the El Niño will be neutral by autumn 2024. Short – compared to the very long La Niña we’ve just had. Pause renewal? Holocene cooling? Ice Age?
There will definitely be a pause renewal. As Bellman, myself, and others have pointed out 100% of the months in the UAH record are contained within a long term pause. In fact, it is likely that the starting point of the new pause is already behind us. We just have to be patient and wait for the Monckton method to confirm it in the coming years.
You are talking gibberish again.
Get your understanding straight.. then try again. !
If you agree with the bellboy, you are demonstrably WRONG. !
But yes, we do agree that UAH is one big pause , apart from El Nino events
There is absolutely zero evidence of any human CO2 warming in the UAH data.
“There is absolutely zero evidence of any human CO2 warming in the UAH data.”
Even the high priest of the AGW cult, Homer Hansen, agrees with this statement.
What scares me is the realization that what is being predicted basically says that natural variation has “hidden” a large warming. Think about what the consequences would be if no CO2 warming existed as the CAGW folks insist.
The result of no warming would be, using round numbers, 1°C of COOLING! In other words, we would be back into the throes of the Little Ice Age!
Do the CAGW folks understand what they are saying?
Nope.
Good, I like a bit of warmth.
The “Year Without a Summer
The “Year Without a Summer” that followed the April 1815 volcanic eruption of Mt Tambora was the northern hemisphere summer 0f 1816 – over a year after the eruption. The Tonga submarine eruption on January 15, 2022 seems to be the cause of the ongoing UAH temperature spike; another example of abnormal effects may be the unusual auroras being mentioned on the Spaceweather website. The culprit may well be the massive amount of seawater that was shot into the stratosphere.
Since 1979….
Is less than the blink of an eye
Interesting fact…the average blink time is about 0.2 seconds. As of midnight last night about 7,074,864,000 blinks could fit into the period from 1/1/1979 to 11/3/2023.
Not as interesting as you seem to think, unfortunately.
Still don’t see any standard deviations from all the averaging of averages…
You’d think we were back in high school doing simple arithmetic averaging with integers.
What’s the consensus about the latest indications from the SYHOTFW* sources?
(* Stick Yer Head Out The F—-n Window)
Nice day here in Wokeachusetts- while driving around- I kept looking out the window trying to see the “emergency”- couldn’t find it.
I wrote to our city council after they endorsed a “climate emergency”.
I haven’t received a reply to my letter asking if they’d already called 911 on behalf of our city, or should we property tax payers do it independently.
An emergency is when:
A trivial increase of temperature is not an emergency. It is what it is. It ain’t no emergency. If the “climate scientists” and the media only discussed climate reality without the drama, they wouldn’t bother me so much.
Who cares? I have gone the better part of my life not knowing about a ‘global temperature’. What is it? Does it really mean anything?
It means something if you are an electrical grid engineer, if everyone enjoys typing online, that is.
Warming in a 2.56 million-year ice age is not saying very much.
About 20% of the land is either permafrost or covered by glaciers.
Unless you are attempting to unravel cause and effect.
The unexpected radiative impact of the Hunga Tonga eruption of 15th January 2022 | Communications Earth & Environment (nature.com)
Are you okay with Sellitto et al. 2022 using libRadTran? I ask because libRadTran says that the radiative forcing of GHGs (including CO2) is consistent with the canonical estimates. [Bellouin et al. 2020] Either way Sellitto et al 2022 describe the water vapor radiative forcing as slightly positive with a small warming effect.
I don’t understand how the WUWT meter moves around 14.1oC regularly, but the UAH temperature has risen so much?
UAH is lower troposphere, not surface.
This story has been demoted down the site at record speed, lol!
Normally there’s 4 hours between articles. This one was posted 9 hours ago and already there have been 3 new articles, including 2 in the last hour.
Bury the awkward news as fast as possible!
The other day I asked if you ever get embarrassed by the crap you write.
Apparently not. Good for you!
You truly are DEMENTED, aren’t you Toenail. !!
You constantly invent puerile little conspiracies in your tiny little mind.
How do you live through each day if you are not already locked in a padded cell !
“. . . locked in a padded cell !”
You should back off from this. Most alarmists persist in a padded cell, because they don’t want to hurt themselves banging their heads against the cell wall.
Too late … most already have brain damage !
The global temperature has now risen by a remarkable 0.97 in 9 months!!!
I strongly suspect that this rise is due to a transition from La Niña to El Niño conditions but on top of the an increased amount of absorbed SW radiation.
Over the last year or so the amount of absorbed SW radiation has gone up by a whopping 1.25 Watts/m2 (Hansen et at 2023). Using the non feedback planck value of 0.3K/W/m2 this gives a warming of roughly 0.4K. See image below
These recent high satellite temperature readings are therefore expected with the two above mentioned mechanisms.
One may ask why has the earth has been absorbing more sunlight?
The recent Hansen et al 2023 paper “Global warming in the pipeline” thinks it is due to decrease in shipping aerosols. Yes in the key shipping areas in the Atlantic and North Pacific supports this. There has been an increase of on average of 3 W/m2 in the two areas. See below figure.
However this only represents 11% earths surface corresponding to only 0.33 W/m2.
A better and more obvious explanation is a decrease in clouds. One cannot assume that the globe has constant cloud cover year to year as the earth has a dynamical climate system!
Loeb et al 2018, show a large decrease in low clouds between 2013 -2017 which see diagram below corresponded to an increase in absorbed solar radiation. This explains why temperatures jumped in that period of time. If you were to compare 2013 and 2017 both ENSO neutral years, 2017 was warmer because of less clouds and more absorbed solar radiation.
In conclusion it is obvious me that the recent “post hiatus” warming is due to a natural decrease in clouds especially low clouds, which more solar radiation is absorbed. The oceans then warm and release heat to the surface and troposphere.
The causation to me can only be one way. I am now about to light the fire here in this chilly 12C weather and await for my lovely wife to come home from her work. I will say today is cold because it is cloudy and she will understand. But if I said it was cloudy because it is cold today then she will think I am a bit strange 😉.
References;
Hansen et al 2023, “Global Warming in the Pipeline”
Loeb et al 2018 “Changes in Earth’s Energy Budget during and after the “Pause” in Global Warming: An Observational Perspective”
Reduction in aerosols and the shortwave feedback.
That’s part of it. Anyway, Loeb agrees with Hansen et al. 2023.
As a result of the shortwave feedback [Loeb et al. 2021]
The newest pause is stuck at 1 month.
It takes a major El Nino to break a pause, and once the transient subsides, we start a new pause, or cooling.
It is all PERFECTLY NATURAL, with no sign of any human causation.
How is it 1 month? Isn’t it ~100 months? It was 101 months through September value.