It’s by far the most important scientific question of our age: Do human emissions of CO2 and other such “greenhouse gases” cause significant global warming, aka “climate change”? Based on the belief that an affirmative answer to that question is a universally accepted truth, our government has embarked on a multi-trillion dollar campaign to transform our economy by, among other things, eliminating hydrocarbon fuels from electricity generation (without any demonstrated workable plan for the replacement), outlawing the kinds of vehicles we currently drive, suppressing fossil fuel extraction, banning pipeline construction, making all your appliances work less well, and much more. Express any doubt about the causal connection between human activities and climate change, and you could very well get labeled as a “climate denier,” fired from your academic job, demonetized by Google or Facebook, or even completely ostracized from polite society.
But is there actually any real proof of the proposition at issue? In fact, there is not.
I had two important posts on this subject back in 2021: one from January 2, titled “Causation Of Climate Change, And The Scientific Method,” and the other from October 28, titled “‘The Climate Is Changing And Human Activities Are The Cause’: How, Exactly, Do We Know That?” Those posts covered the basics of how causation is generally established under the scientific method. Those posts also reviewed certain articles published at the time that gave good reasons to doubt the truth of the proposition that human greenhouse gas emissions are a main driver of significant climate change. Go to those posts for discussions of and links to the 2020/21 articles that I reviewed at the time.
The reason for today’s post is that a couple of important new articles have come to my attention that further make clear that the proposition that human activities, particularly “greenhouse gas” emissions, are causing significant climate change has not been proved and, based on existing data, cannot be proved. I’ll provide links and summaries, and let you draw your own conclusions as to the significance of these new articles.
But before that, let’s review one more time the basics of how causation is extablished under the scientific method. This is from my January 2, 2021 post:
We start with the basic maxim that “correlation does not prove causation.” Instead, causation is established by disproof of all relevant alternative (“null”) hypotheses. Everybody knows how this works from drug testing. We can’t prove that drug A cures disease X by administering drug A a thousand times and observing that disease X almost always goes away. Disease X might have gone away for other reasons, or on its own. Even if we administer drug A a million times, and disease X almost always goes away, we have only proved correlation, not causation. To prove causation, we must disprove the null hypothesis by testing drug A against a placebo. The placebo represents the null hypothesis that something else (call it “natural factors”) is curing disease X. When drug A is significantly more effective at curing disease X than the placebo, then we have disproved the null hypothesis, and established, at least provisionally, the effectiveness of drug A.
And yet somehow these principles don’t apply in the field of climate science. Instead, all the inside clique of the climate science community have decided to agree that the new way to prove causation is to show really, really good correlation with the preferred hypothesis, in which case subjecting the proposition at issue to a test of invalidation against a null hypothesis can be dispensed with. The climate science community calls its system for establishing causation “detection and attribution” studies. The basic idea is to come up with a model (i.e., a hypothesis) that predicts global warming based on increased greenhouse gases, and then collect data that show a very close match between what the model predicted and the data. Correlation with the model predictions is the claimed proof of causation. There are hundreds of such studies in the climate literature. My January 2, 2021 post linked to a classic of the genre, a 2018 IPCC-sponsored article written by a collection of some 36 co-authors who constitute a virtual “who’s who” of the insiders of the climate science cult (e.g., Michael Mann, Phil Jones, Tom Wigley, Ben Santer, etc., etc., etc.). The title is “Detection of Climate Change and Attribution of Causes.” Key quote:
There is a wide range of evidence of qualitative consistencies between observed climate changes and model responses to anthropogenic forcing, including global warming, increasing land-ocean temperature contrast, diminishing Arctic sea-ice extent, glacial retreat and increases in precip- itation in Northern Hemisphere high latitudes.
Just get yourself enough “qualitative consistencies” with your hypothesis and proof of causation will be yours!
The authors of the two new papers beg to differ. First, we have a paper by John Dagsvik and Sigmund Moen of Statistics Norway, dated September 2023, titled “To what extent are temperature levels changing due to greenhouse gas emissions?” This paper is particularly significant because it has been issued by a governmental agency — the government statistical agencies being otherwise all in lockstep in support of the human-caused global warming narrative. Excerpt from the Dagsvik and Moen paper (page 5):
At present, there is apparently a high degree of consensus among many climate researchers that the temperature increase of the last decades is systematic (and partly man-made). This is certainly the impression conveyed by the mass media. For non-experts, it is very difficult to obtain a comprehensive picture of the research in this field, and it is almost impossible to obtain an overview and understanding of the scientific basis for such a consensus (Koonin, 2021, Curry, 2023). By looking at these issues in more detail, this article reviews past observed and reconstructed temperature data as well as properties and tests of the global climate models (GCMs). Moreover, we conduct statistical analyses of observed and reconstructed temperature series and test whether the recent fluctuation in temperatures differs systematically from previous temperature cycles, due possibly to emission of greenhouse gases.
And the conclusion of Dagsvik and Moen (from the abstract):
[W]e find, . . . that the effect of man-made CO2 emissions does not appear to be strong enough to cause systematic changes in the temperature fluctuations during the last 200 years.
A good deal of the discussion in Dagsvik and Moen covers various deficiencies and inadequacies of the existing temperature data series — inadequacies that make it impossible to draw conclusions from existing data about causation of temperature increases from human greenhouse gas emissions. Here is one comment on the data from page 10 that I find particularly significant:
For all three surface air temperature records, but especially NCDC and GISS, administrative changes to anomaly values are quite often introduced, even for observations several years back in time. Some changes may be due to the delayed reductions of stations or addition of new station data, while others probably have their origin in a change of technique to calculate average values. It is impossible to evaluate the validity of such administrative changes for an outside user of these records.
For more than you will ever want to know on that subject, see my thirty part series “The Greatest Scientific Fraud Of All Time.” Bureaucrats altering the data to support their preferred narrative have rendered the data completely useless for any legitimate public policy purpose.
A second important new paper is from Antonis Christofides and co-authors dated September 26, 2023. They introduce their paper with a long post of that date at Climate, Etc. titled “Causality and Climate.” The part of the full technical paper relating to the climate science application can be found at this link. If you go to that last link and try to read through it, you will find technical math that will quickly have your head swimming, even if you are a quasi math geek like myself. However, their fundamental point as to causality in climate science is not very complicated: if you plot recent temperature increases against increases in CO2 in the atmosphere, it’s the temperature increases that come first, and the CO2 increases follow. Thus, if there is causality, it must be that the temperature increase is causing the CO2 increase, rather than the other way around.
Here is the key chart from the post at Climate, Etc.. The authors present it as a quiz: look at the chart, and the explanations, and without any further mathematical analysis, draw a conclusion as to the direction of causation:

From the technical paper:
[T]he surprising finding [is] that, while in general the causal relationship of atmospheric T and CO2 concentration, as obtained by proxy data, appears to be of hen-or- egg type with principal direction 𝑇 → [CO2], in the recent decades the more accurate modern data support a conclusion that this principal direction has become exclusive. In other words, it is the increase of temperature that caused increased CO2 concentration. Though this conclusion may sound counterintuitive at first glance, because it contradicts common perception (and for this reason we have assessed the case with an alternative parametric methodology in the Supplementary Information, section SI2.4, with results confirming those presented here), in fact it is reasonable. The temperature increase began at the end of the Little Ice Period, in the early 19th century, when human CO2 emissions were negligible; hence other factors, such as the solar activity (measured by sunspot numbers), as well as internal long-range mechanisms of the complex climatic systems had to play their roles.
I would make this comment as to both the Sagsvik and Christofides work: They both are using the only available data, which is data emanating from government sources that have been tampered with and altered. However, the important point is that even that data would appear to refute, and certainly does not prove, the endlessly repeated claims of impending climate doom from human CO2 emissions.
What we really know is that the rush to ‘control the climate’ is not working out as planned for those with their snouts in the trough. From CNN business news today:
Mercedes-Benz shares fell Thursday as it reported lower profit and revenue and highlighted pricing challenges in the electric vehicle space. Chief Financial Officer Harald Wilhelm described the EV market as “pretty brutal space,” Reuters reported.
It comes as some traditional automakers sell EVs for less than regular combustion-engine cars — despite higher production costs.
AND:
Shares of Siemens Energy tumbled more than 32% on Thursday afternoon after the company sought guarantees from the German government.
The wind power giant made headlines earlier this year, when it scrapped its profit forecast and warned that major setbacks at wind turbine subsidiary Siemens Gamesa could drag on for years.
Command economies (centrally planned) have never faired well. Bureaucrats are never as smart as they think they are. Free markets will outdo them Everytime.
In the rush for equality, bureaucrats end up hurting the poor that they wanted to make equal! History DOES repeat itself!
Absolutely true. Command encomies invariably generate economic calamity and pain for the populace. Mao’s ‘Great Leap Forward’ springs to mind, among others.
The next step will be a climate-centered command economy based on AI. There will be no arguing with the pronouncements of the digital deities whose software is written by academics.
By the way, it’s been a serious problem for some time but there seems to be no popular realization that every government comes to an end and no one knows when that event will arrive. Here is an example. In this simpler era a solution was easily found. Now, when the inevitable does arrive, the new bosses, whoever they may be, will have a complete digital record of the entire population to do with as they please. The Nazis and Soviets could only have dreamed of such a circumstance. The immense data centers being constructed are the temples of AI. The monks working with the information will have an unknown control of millions that very likely won’t be a positive for the ordinary citizen.
Agreed! Just think “pushing on a rope”.
For this, and several other reasons, I advise people in economic discussions to avoid Marx’s term “capitalism” (or “capitalist”) which they frame as pejorative, and instead talk about a free market economy as contrasted to one central planned.
(Whether a government’s purpose is to “provide” rather than “protect” is a separate issue.)
Capitalism is society’s way of telling people what to make.
Free Market economy is society’s way of telling people what to make.
(thanks George)
A free market economy is society’s way of informing people what it would benefit them to make.
A free market economy allows people to change their minds!
Absolutely.
I just looked for a simple explanatory graphic on google images that illustrate how a free market works, i.e. –
A NEED
> A PRODUCT / SERVICE THAT SOLVES THE NEED
> A WILLING SELLER OF THE SOLUTION
> A WILLING BUYER OF THE SOLUTION
> A PAYMENT EXCHANGE THAT IS ACCEPTABLE TO BUYER & SELLER
I didn’t see any simple graphics that illustrate this process. 🙁
Didn’t see the part about whether the need conforms to the “values” of some private organizations who loudly lobby the government to regulate those needs they disagree with.
Mainland China has done well since the US moved much of its large manufacturing there.
Bureaucrats self interest is to feather their nests not to solve societal problems that would make themselves obsolete. Creating problems is how budgets increase.
If Climate Change were a FACT and not a SCAM, those pushing Renewable Energy and even the Elites would demand that that the money be spent on Nuclear Power and not on the abyss of “Renewable Energy.” It would take the entire GDP of all countries on Earth to reach “Net Zero.” Think how RICH the Elites will become and the squalor the lower middle class and poor will live in if Net Zero continues.
The battery car market is already saturated. Most of the buyers who are going to down money already have (with the possible exception of corporate fleet buys).
Unfortunately facts don’t matter where command economics rule. In the UK, car makers will shortly be fined for failing to produce a mandated percentage of EVs in their mix.
In other words they will be fined for not making products that customers don’t want. It beggars belief!
a little simplistic – it is car buyers, of all sorts of cars, that are being fined/punished for not buying EVs
They, the car buyers, are the only source of money here and (ever expanding) Government is the sink.
The car companies are (merely) the tax collectors, doing the Governments bidding (haha ‘Bidenning’) = now being composed entirely of self-centred hypocrites and gutless liars
It does beggar belief but politicians will eventually have to wake up to reality. Sunak seems to be moving slowly in that direction and I think Starmer is pragmatic enough to change. (Miliband isn’t bright enough so will have to go)
Starmer will spin like a weathervane until he settles on a direction with the most votes. Then he’ll be off again. Milliband is a useful idiot so they’ll keep him around on the fringes then wheel him out just to get shot at. Rayner’s cunning enough to use Starmer as cover in a deeply misogynistic party so may survive the longest, but only at the others expense. Most of the others are 2-dimensional caricatures that will come and go with little impact except for Emily Thornberry. She was rightly feared by the conservatives as the only competent one of the lot and Labour, true to form, refused to have a female leader then exiled her from the front benches. If they get into power it’ll be a catastrophe but entertaining – like a slow motion car crash throwing bodies and wreckage all over the place.
The thought of Angela Rayner as Prime Minister fills me with more horror than words can express…
Go woke go broke.
Ford third quarter results just in, ouch!
Its “Model e” electric vehicle unit lost $1.33 billion from July through September.
Said the company will be delaying about $12 billion in previously announced EV investments. Demand has been lower-than-expected for the vehicles amid increasing raw material and labor costs as well as pricing pressure caused by EV leader Tesla.
Nice article. Thanks for doing the research to find these papers.
It is hard to convince folks of only correlation in time, and not very good correlation at that. You can show that U.S. postal rates correlate also and all you get is a blank stare.
“it’s hard to convince folks”
Yes, convincing folks is the issue. But the mechanism of warming preceding co2 increasing is our everyday experience. Open a cold beer. Now open a warm one. Which one fizzes most?
“The ocean contains about sixty times more carbon in the form of dissolved inorganic carbon than in the pre-anthropogenic atmosphere (~600 Pg C). On time scales <105 yrs, the ocean is the LARGEST inorganic carbon reservoir (~38,000 Pg C) in exchange with atmospheric carbon dioxide (CO2) and as a result, the ocean exerts a DOMINANT CONTROL on atmospheric CO2 levels"
https://acrobat.adobe.com/id/urn:aaid:sc:US:530fb383-c24e-4f5f-972e-e094f47a3494
Yes. The last time I looked, carbon sinks were growing at roughlythe same rate as atmospheric emissions, despite the increasingly unconvincing claims that CO2 sinks were approaching saturation.
Even if all the atmospheric increase is due to humans, the sinks are keeping pace with an expected lag time which means that, yes, atmospheric levels will rise. The human CO2 goes straight into the atmosphere but takes a little longer to find it’s way into the ocean depths.
But it is instructive to do the thought experiment “What would happen to atmospheric CO2 concentration if human emissions went to zero overnight?”
The sink rate is now much greater than it was in pre-industrial times. Is that also going to drop back to a pre-industrial rate overnight? I don’t think so.
This is actually a knife to the heart of the cAGW mantra. It means that if humans switched to nuclear power rapidly, then CO2 concentrations would fall rapidly.
For these people, there is nothing worse than a solution that might actually work. That tells us want we need to know about their motivations.
Anthropogenic emissions of CO2 were 36.8 gigatonnes (Gt) in 2022. If all the CO2 remained in the atmosphere forever, a 1 ppm increase corresponds to about 8 Gt of CO2 (by mass balance). So, the CO2 emissions in 2022 would result in a 4.6 ppm increase in CO2 concentration if there were no sinks.
Actual CO2 concentrations at Mauna Loa have been increasing at a rate of about 2.4 ppm/yr over the past 13 years, meaning that about 2.2 ppm/yr (17.6 Gt/yr), or 48% of the human emissions, are removed by the sinks.
What are the major CO2 sinks? Absorption by the oceans (particularly during cold seasons) is one, and Henry’s Law would suggest that the absorption rate is proportional to the atmospheric CO2 concentration, although this varies with ocean surface temperature.
Photosynthesis is another major carbon sink. Many experiments have shown that increasing CO2 concentrations in the air increases plant growth rates, which increases the consumption rate of CO2 by plants.
If the CO2 absorption rate by sinks is linearly proportional to CO2 concentration in the air, then the absorption rate would catch up to the emission rate when the CO2 concentration is 4.6 / 2.2 = 2.1 times the current concentration, or about 882 ppm. If the emission rate is equal to the absorption rate, the CO2 concentration would level off at this concentration, with little further change.
This would result in plant growth rates more than double what they are now, which could lead to a doubling of the world’s food production, which would be a tremendous boon to a growing population. Why should we be afraid of this?
Well I for one am not afraid of it, Steve56.
Since I wrote the above post, I have also chanced upon some data I have been interested to know since ~2013.
I invite you to look at the third panel of the figure in this link and tell me what you think:
Around that time I read a paper (I think Levin was one author) reporting Delta 14C measurements in Switzerland. It showed atmospheric Delta14C approaching the original pre-bomb spike levels. The curve approximated a single order exponential decay, as expected in a simple system.
I think they asserted that this bomb-effect was now largely gone (Agreed) and that human emissions of ‘cold’ fossil fuel emissions would now dominate the Delta 14C atmospheric measurements.
But this means that if humans are adding an extra ~3% annually of ‘Cold’ carbon to the atmosphere, then the Delta 14C should be falling BELOW pre-bomb spike levels by about 3% annually. (The left hand scale in the figure is not even %, it is ‰, ten times smaller.)
As the above reference shows, it has not. It has still followed the exponential decay towards zero.
To me this shows that human CO2 is very rapidly entering a carbon sink which is far larger than the atmosphere.
I wish Ferdinand Englebeen still commented on these blogs as I valued his opinions highly, even when I didn’t agree.
Michael, Ferdinand is still active and has commented extensively here:
https://judithcurry.com/2023/09/26/causality-and-climate/
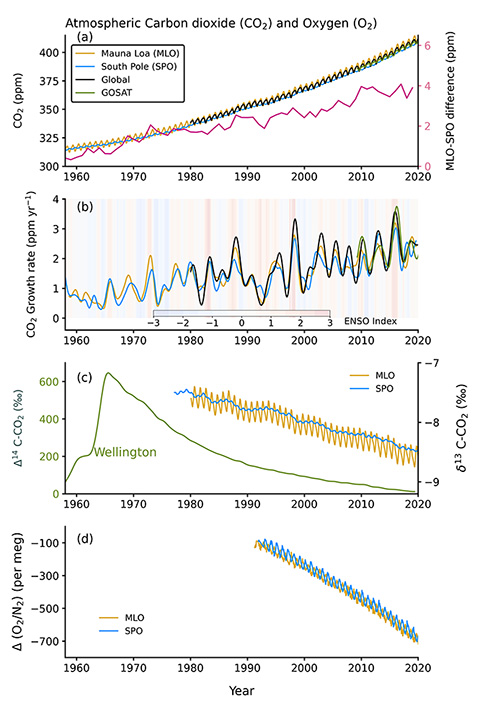
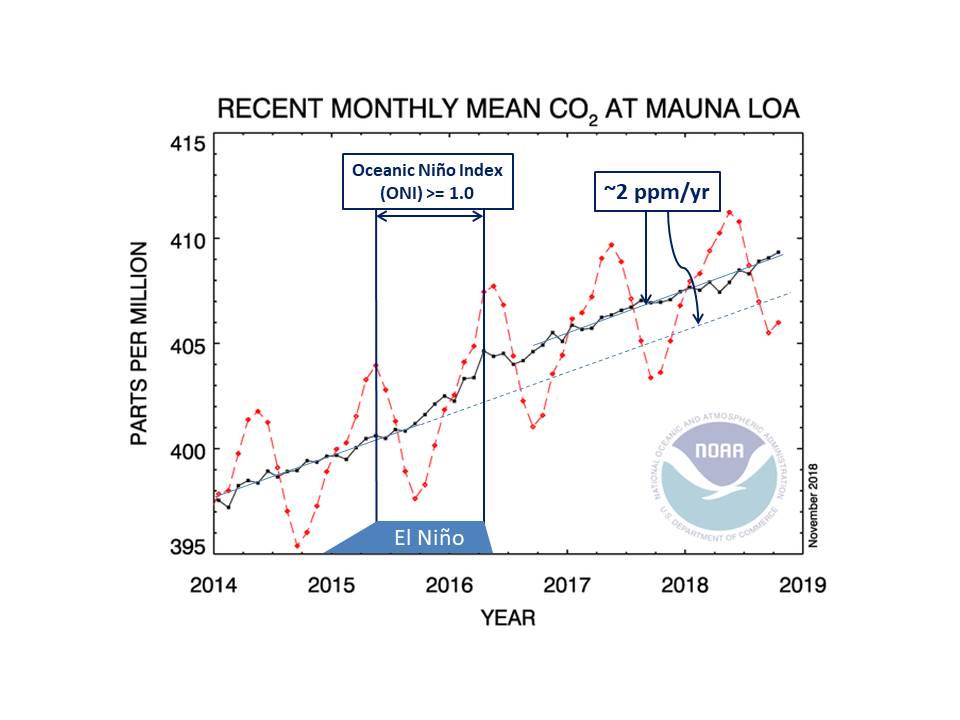
One of the issues that is often missed in these discussions is that the observed relationship between temperature and CO2, as indicated by panel b above, is not with atmospheric CO2 concentration but with the rate of CO2 growth, which roughly doubles during a very strong El Niño. See, for example (plot from NOAA, ONI data and rate indications added by myself):
Of course, we cannot expect to derive a mathematical correlation of an average temperature directly with a rate of growth. We are looking at different, but related, symptoms of changes in oceanic fluxes associated with El Niño-Southern Oscillation (ENSO). As these fluxes change, the surface temperature changes and, separately, CO2 fluxes are changing.
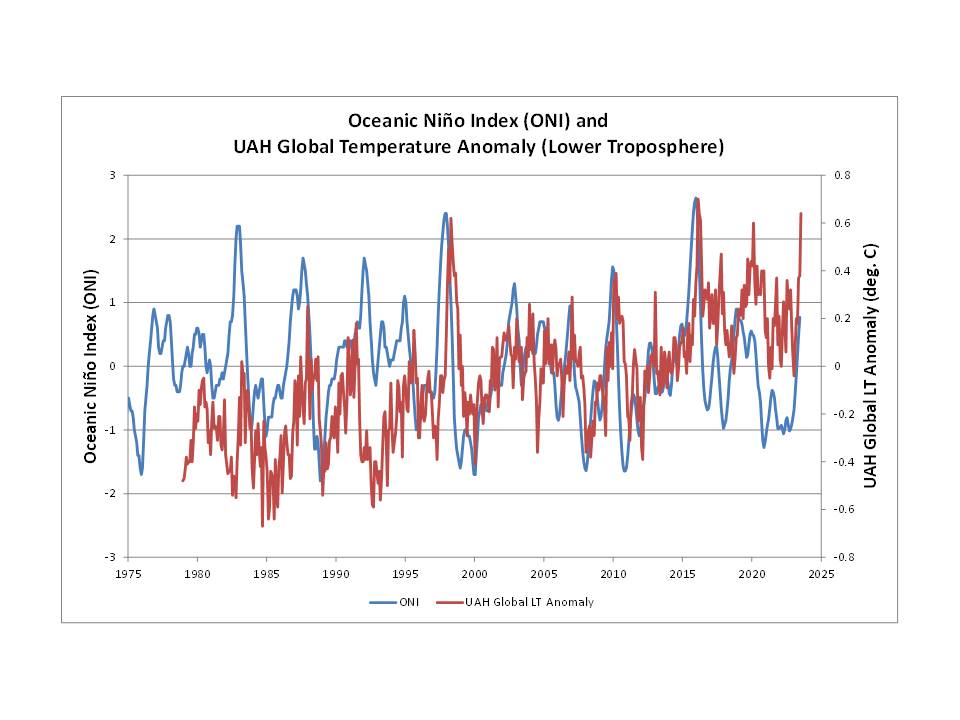
I am sure that you are aware that ONI is based solely on sea surface temperature (SST) anomalies in the Niño-3.4 region in the equatorial Pacific Ocean and that warming or cooling in that region almost always leads to warming or cooling in average global temperatures, the exception being the result of major volcanic eruptions such as Pinatubo. The relative cooling linked to La Niña events results from an increased contribution from deeper upwelling cold (nutrient-rich) waters which are attenuated during El Niño events. These SST changes precede changes in global temperatures and in atmospheric CO2 growth (the latter shown in the plot above):
Note that UAH anomalies are based on a single 30-year base, whereas ONI uses a ‘rolling’ 30-year base which removes any long term trend in the data. The UAH data include longer term ‘trends, which actually look more like steps …
Despite the above oceanic data reflecting the driving force in short term atmospheric CO2 growth variations, the ‘climate science’ view is that the CO2 changes are the result of ENSO effects that lead to decreased or increased removal of anthropogenic CO2 by the terrestrial biosphere sink (e.g. droughts in the Amazon). However, there is a problem. During strong La Niña events (and Pinatubo), the 13C/12C ratio of atmospheric CO2 is flat or even increases, and yet atmospheric CO2 is still increasing, albeit at a lower growth rate. This is not consistent with an anthropogenic source. I will add a more detailed comment on the 13C/12C ratio at the bottom of the current comments. I have not studied the 14C data, so cannot respond on that issue.
Who comes up with these numbers and why should we believe them?
They are estimated figures, based on what statisticians believe is the number of man-made things emitting CO2 and the amounts they believe that they emit. As you can imagine, there is an awful lot of guessing going on!
I’ve been surprised not to see mention of the first paper on WUWT before now (or did I miss it?).
What is shown in the second paper is hardly new. I had a post here on WUWT years ago demonstrating that changes in CO2 lag temperature. I’m sure it has been pointed out at other times as well.
First paper was noted two weeks ago but not discussed here:
Weekly Climate and Energy News Roundup #571 • Watts Up With That?
Thanks.
“Do We Really Know That Human Greenhouse Gas Emissions Cause Significant Climate Change?”
In a word, no. But the uncertainty is their lifeline. And it’s a real fit of hubris that makes such a claim with nothing but models to back it up.
Time is the key variable. Once earlier on in the fabrication of the climate crisis the mantra was a single weather event is not evidence of climate change…
“Weather and climate are different; climate predictions do not need weather detail.”
https://skepticalscience.com/weather-forecasts-vs-climate-models-predictions.htm
But now, magically, single weather events are evidence of climate change (Friederike Otto has made a living out of attribution studies…)
“How climate change worsens heatwaves, droughts, wildfires and floods”
https://www.bbc.co.uk/news/science-environment-58073295
Now even a light breeze is caused by climate change. By my reckoning they – the alarmists – have done a full 180.
Of course they have done a 180. Couldn’t make any money off the old paradigm.
Uncertainty is what proves their unquestionable conclusions to be pseudoscientific fraud. The human forcing is lost in the noise of a chaotic system where the scale natural variability dwarfs CO2’s effect. Because we lack the grid cell resolution to measure the complex interactions “we don’t know” is the correct scientific conclusion
The claim was made nearly 200 years ago. They’ve had 200 years to find the smoking gun what dun it. Q: What have they got? A: Nothing. The null hypothesis says CO2, and other radiatively active gases do NOT cause climate change. This judge finds the defendant innocent as charged. Case dismissed, as the prosecution presented no evidence.
1. Tom Shula. The behaviour of the Pirani gauge refutes the greenhouse gas conjecture. Convection – not radiation – is the major heat transporter in the troposphere.
2. Gerhard Gerlich & Ralf Tscheuschner. Basic physics refutes the greenhouse gas conjecture.
3. The Laws of Thermodynamics, Le Chatelier’s principle, and empirical science, refute the greenhouse gas conjecture.
4. Reality and data refute the greenhouse gas conjecture.
5. The pro-Greenhouse gas cult took all the research funding but contributed nothing to understanding the climate. Pseudo-science is harmful to society, the individual, and planet earth.
Planck’s Theory of Heat Radiation – For example, if we let the rays emitted by the body fall back on it, say by suitable reflection, the body, while again absorbing these rays, will necessarily be at the same time emitting new rays, and this is the compensation required by the second principle.
Nobody seems to ever discuss what this means in terms of climate.
Net radiation flux is determined by temperature difference.
CO2 does NOT alter the atmospheric temperature gradient… so cannot alter the net radiative flux.
People (particularly climate “scientists”) use this “net flux” term a lot, but as someone who’s been studying physics basically since birth, two things about it bother me. First, photons don’t really “flux” in the same way that macroscopic liquids like water do. They sort of permeate the universe as a potential energy field propagating as waves, waiting for the chance to do some work. Second, “Net” implies the existence of the corresponding “gross” quantity, and what is “Gross flux”? I suspect that this idea of “radiant flux” was invented by the climate “scientists” to confuse non-physicists (including themselves) into sweeping the critical difference between “energy” and “power” right under the carpet. And I suspect it was invented by people who still think of photons as being basically tiny bullets.
So I think we should avoid both “net” and “flux” and stick to the actual fundamental physics terms: “radiant energy” measured in Joules, or indeed in degrees (emitted by every object above absolute 0) and “radiant power” measured in Watts (developed between two objects based on both their temperatures, as you said, obviously only from the hotter one to the colder one, and also depending on their emissivities/absorptivities and a constant multiplier etc).
“Convection – not radiation – is the major heat transporter in the troposphere. “
Balloon data shows the atmosphere always remains in thermodynamic equilibrium under the gas laws, with an absolutely linear energy gradient wrt molecular density.
This confirms the statement quoted above.
And real greenhouses stay warm by disrupting convection–not just trapping radiation. Convection is the planet’s natural air-conditioner.
“. . . the atmosphere always remains in thermodynamic equilibrium under the gas laws . . . .”
I would not make this statement. By gas laws, do you mean the ideal gas law too? My professors would remind us regularly that the ideal gas law only applies to ideal gases.
The best greenhouses can control the temperature using roof venting..
These still block radiation.. but allow some convection.
that the ideal gas law only applies to ideal gases.
Suggest you listen to this analysis.
Seriously! Over an hour. My attention span isn’t that long.
Thermodynamic equilibrium: a system is in thermodynamic equilibrium if the entire system is at the same pressure, at the same temperature, and at the same state throughout. Obviously, the atmosphere isn’t. I don’t know what they mean by thermodynamic equilibrium, but it’s not the definition in standard use.
An ideal gas is composed of infinitesimally small particles that have no inter-particle forces. Real gases do not have this property. For a real gas to start behaving like an ideal gas, it must be at a very low pressure and at a very high temperature.
Sorry, but I don’t agree with the video. I think they are on to something, but their definitions are loony.
Have you ever flown through a thunderstorm? I have–several times. Heavy icing one minute; St. Elmo’s Fire the next. I also have flown through clear air turbulence that would rattle your teeth, not to mention the entire plane. It’s not exactly equilibrium.
“a system is in thermodynamic equilibrium if the entire system is at the same pressure, at the same temperature, “
No. It is in thermodynamic equilibrium if PV=nRT is maintained.
“No. It is in thermodynamic equilibrium if PV=nRT is maintained.”
That is not the rule. It’s also false because real gases don’t exactly behave as ideal gases.
To quote a thermodynamics book: “A system is in equilibrium when there is no possibility for it to do work when it is isolated from its surroundings.”
An isolated system will tend towards equilibrium and at equilibrium delta S equals 0. By the way, the second law only applies to isolated systems.
My thermo book says that air, N, O, H, He, Ar, Ne, Kr, and CO2 can be treated as ideal gases with an error of less than 1%.
That seems close enough.
Apparently, my Windows 11 likes to make my mouse pointer jump around. So I inadvertently responded to my own comment.
I repeat: Does your thermo book use the ideal gas law to define thermodynamic equilibrium?
Also, I noticed that your list doesn’t include H2O. Why is that? Is it because water vapor doesn’t obey the ideal gas law? The region where the ideal gas law seems to give less than 1% agreement, is quite limited. It fails badly when you leave that region.
The ideal gas law does better with monatomic gases. An ideal gas is basically monatomic. Most of the gases in the atmosphere are diatomic. Indeed, the failure of classical physics to describe the heat capacity (bad term) of diatomic gases was another reason why quantum mechanics was a success.
If the ideal gas law is so great, why do they come up with other equations like the Van der Waals equation? And there are even more elaborate equations.
I say again, my professors said the ideal gas law only applies to ideal gases. You use it with the possibility that your results are wrong.
I investigated this for myself several years ago. Absent other parameters, increased pressure does cause a temperature at the bottom of the gravity well, i.e., the surface. The problem is how it affects individual pieces of the atmosphere. There is certainly no equilibrium over any length of time
One of the things in Bnice2000’s video that I liked was the comparison between the total wattage due to radiation effects and the amount of power required with convection. If I remember correctly, it’s something like 2 watts to 2500 watts. It’s much ado about nothing.
I’m not a chemist, but a system is in thermodynamic chemical equilibrium if at constant pressure and temperature, the Gibbs function is at a minimum. That is, dG = 0 at constant temperature and pressure.
Does your thermo book use the ideal gas law to define thermodynamic equilibrium?
“Sorry, but I don’t agree with the video.”
The analysis is very straight forward.. What is not to agree with !
“ It’s not exactly equilibrium.”
Yet the analysis shows that it is.
Getting to that stage is what causes all the ruckus.
The trendologists won’t like this, expect a lot of noise and whining.
They’re Norwegians so they’re obviously in the pay of that country’s offshore oil industry. And they eat that disgusting lutefisk.
Oh yes, you raise a very grave point.
I googled it- found:
I’ll pass.
They also eat the wonderful sursild. Herring pickled in onions served with real butter on a dark rye bread.
To they take the skin off first?
I can’t be doing with pickled herrings with the skin still on.
Otherwise, it can be wonderful.
Skin on.
Lutefisk has a good entry on Wikipedia, that unlike the climate stuff there, seems to be well done. I lived in a Northern Idaho community for a while and those of Norwegian ancestry would have a gathering where a traditional meal was prepared. Lots of food and good times.
In the future, folks will have to party with non-alcoholic beverages and crisp grasshoppers.
On the other hand the Norwegians could point out that they are the EV ‘capital’ of Europe and companies such as VW are ceasing to sell ICEVs in Norway from 2024.
The slight drop in Arctic sea ice since the extremes of the LIA, and 1979, has allowed much sea life to return to the Arctic…
… probably even the Lutefish !
No, they do not. Next stupid question.
Cause and effect can be difficult to unravel sometimes, but in the climatic CO2 / Temperature paradigm, it is a slam dunk that atmospheric CO2 levels are merely a result of temperature and not a cause. The level of stupidity and or malice in climate science is astonishing.
Good article. There are multiple ways to show that attribution of reported warming to human emission of GHGs is unsound.
We know what the longwave emitter looks like from space, in one band of wavelengths from which a substantial part of the static warming effect of incremental CO2 arises. Those visualizations help us readily grasp that the claimed effect of non-condensing GHGs simply cannot be isolated for reliable attribution. It also helps us understand dynamic self-regulation in respect to what GHGs do.
The plot attached here shows the band 16 part of the spectrum and its significance to the claimed warming effect of a doubling of CO2.
More here at this recent video. The text description on Youtube is also pasted below.
https://youtu.be/Yarzo13_TSE
“Are emissions of non-condensing greenhouse gases (GHGs) such as CO2 a risk to the climate system? Watch from space to see whether the concept of a radiative heat “trap” explains the observed result.
This time-lapse video captures 7 recent days of hourly images generated by NOAA from high resolution full-disk radiance data from the GOES East geostationary satellite for Band 16.
NOAA calls this the CO2 Longwave IR (infrared) band. It is centered at a wavelength of 13.3 microns, at the edge of the “atmospheric window” part of the infrared spectrum. The “brightness temperature” color scale for visualization is such that the radiance at 50C on the scale (red) is 13 times the radiance at -90C (white.) It is in this narrow band of wavelengths that a significant part of the claimed static warming effect of incremental CO2 concentrations is computed.
So what? The emitter output is obviously not that of a passive radiative insulating layer. The motion of the atmosphere is a response to absorbed energy and to the rotation of the planet. These dynamics change everything about where to expect the energy involved in the static warming effect (i.e. the GHG “forcing”) experienced at the surface to end up. The formation and dissipation of clouds dominates the overall result, and the overturning circulations at local, regional, and global scale produce highly variable emitter outputs over time and location. It is all strongly self-regulating as the motion delivers just enough absorbed energy from the surface to high altitude and from the tropics to the poles to be more easily emitted to space as longwave radiation.
The atmosphere is the authentic model of its own performance as an emitter and as a controller of longwave emission from the surface. What do we see and learn from watching it perform? The visualization helps us grasp that heat energy cannot be made to accumulate on land and in the oceans to harmful effect by what increasing concentrations of non-condensing GHGs do in the atmosphere. And for whatever warming has been experienced and measured down here, the minor effect of increasing GHGs cannot be isolated for reliable attribution.
So as I see it, is there risk of harmful warming from GHGs? No. We can see from space that it doesn’t work that way.
[Edit 8-23-2023 The color scale NOAA uses to convert “brightness temperature” for the visualization is given here.
Brightness temperature itself is computed by NOAA from the radiance data, using an equation and coefficients from the user manual for the imager. The radiance at 50C “brightness temperature” (red) is 13 times the radiance at -90C (white.) Radiance is the strength of the flow of energy being emitted from the planet and sensed at the satellite in this band.]”
very lovely – what did they use for an Emissivity figure..
Please tell me it was not from some unspecified substance radiating at 89GHz, as Willis pointed us to recently
Earth radiates from its atmosphere = something made from various and assorted gases.
The Emissivity figure for those things is very low to start with and varies enormously with temperature and pressure = something the atmosphere has ‘well covered’
The most notorius gas being Water Vapour (WV) which has a very high emissivity figure. Thus, even very very modest amounts of WV change the amount of energy being radiated at any given time/place by huuuuge amounts and on every timescale imaginable, from seconds through millennia
PS 89GHz corresponds to a substance at a temperature of 1.5Kelvin, or 2.5 Celsius colder than the microwave background.
How does that relate to anything on Planet Earth?
Thank you for your reply. The NOAA images in the video originate from directly measured radiance values converted to “brightness temperature” following an empirical formula which is documented in the user manual. The color scale is then used simply to convert this computed “brightness temperature” value for visualization pixel by pixel. I don’t see how emissivity differences or uncertainties matter to the point of my post.
is it any wonder why the color scale for such visualizations is centered on 0 degrees Celsius (~273K)?
This offers a clue as to the average emission temperature of the atmosphere observed from space. it really is that simple. 13.3 microns is designed for this purpose.
Why does the atmosphere choose this emission temperature? Is there anything special about ~273K? hmmm
The 10.3 µm – “Clean” Longwave IR Window Band, will read slightly warmer, however. Here we have contributions of atmosphere and surface. Averaging up band 13 is yielding an average about 278K.
These 10.3 micron region spectra are right smack in the “window” region, suggesting we cannot be observing gaseous emission. This is the temperature of everything except the gas, observed from space.
Atmospheric emission temperature 273K looking down; Bulk emission temperature 278K looking down.
These are both quite special temperatures.
278K is a temperature resembling an effectively “blackbody” emitter at 340 Wm-2. I have checked this via SB. it is resembling quite closely the solar irradiance, yes?
This is much like a virtual Earth without atmosphere would look like from radiometric POV, no?
How is it that bulk emission temperature stays the same, but emissivity is reduced when introducing atmosphere?
The only explanation is that the reflected portion via albedo is exactly and precisely matching the reduced emissivity.
T_e in classic textbook really should be taught as 278K.
The 255K virtual “effective temperature” T_e is introducing a reflectivity (of atmosphere and so-on) [0.3] while all this reflection and so-on exhibits no co-variation whatsoever with emissivity?? That is an un-real and selective launch pad.
Referencing in classical textbook, emissivity is the opposite of reflectivity. Quite simple, really.
Four our T_e we cannot introduce this reflectivity 0.3 without also introducing our emissivity 0.7. That is the appropriate launch-pad. We can’t have one without the other in our elementary foundations.
A 0.3 reflectivity (albedo) must in any classic sense be associated with an emissivity about 0.7. There is no way around that.
278K bulk emission at 0.7 is giving us about 240 Wm-2 according to SB
This is associated with a reflectivity 1-0.7 = 0.3 (albedo).
No need to confuse matters. 255K is rendered quite meaningless.
Here is a plot of radiance vs “brightness temperature” using the formula in the user manual for the satellite’s imager. It is from this formula that I determined the radiance at 50C “brightness temperature” (red) to be 13 times the radiance at -90C “brightness temperature” (white.)
The only reason I even mention “brightness temperature” at all is because of the color scale NOAA uses to depict the detected radiance. It is helpful that the color discrimination is continuous from high to low radiance values so we can see more of what is happening with motion and with the formation and dissipation of clouds.
Ever notice that clouds are indicative of the surface temperature. Attached shows cloud over ocean at 5C and 26C. No prize for identify which one is 5C. In fact, ocean surface cannot sustain more than 30C because the resulting clouds block enough sunlight to just sustain that temperature.
If you want to confirm that the left image is over water you will find the a video at this link that shows a 24 hour period on a rock in the middle of the Southern Ocean:
https://www.antarctica.gov.au/antarctic-operations/webcams/macquarie-island/
Ever wonder why we get clear sky when we are on a water planet. What stops the atmosphere from reaching a fully saturated state often observed when ocean surface is less than 15C.
Convective instability is the driver of Earth’s weather and climate. It is a vital atmospheric process that garners little attention from a climate perspective. The most powerful convective towers occur over 30C ocean warm pools. That is all they can get to. But these are the engines of the global circulation that give rise to the intertropical convergence zone that follows and connects these powerful convective processes generating up around 50W/m^2 over the warm pools to drive all the global circulations.
As a complement to this important article by Francis Menton, I would like to show this simple diagram exhibited in ICSF – Clintel lecture in September (https://www.youtube.com/watch?app=desktop&v=gvEE0IWg-Xs) that shows the renewables’ green argument where correlation does not necessarily imply causation, making the conclusions, derived from true premises —thus assumed as true—, to become false if there is no cause-effect relationship between conclusions and premises, causing the entire argument to become non-valid.
The climate science community calls its system for establishing causation “detection and attribution” studies.
The Church attributed all sin to Satan.
CO2 is the new name.
“Bureaucrats altering the data to support their preferred narrative have rendered the data completely useless for any legitimate public policy purpose.”
Here in Wokeachusetts, when I discuss or rant about forestry policies- I don’t use the word “bureaucrats” – instead, I only use “burros”. They don’t appreciate it. 🙂
You can lead a burro to water, but you can’t make it think.
burros=donkeys=jackasses=Democrats
Some basic points:
1: About 2% of the free CO2 is in the atmosphere, the other 98% in the ocean.
2: The solubility in water is driven by temperature.
3: This equilibrium produces a buffered situation for CO2 in the air.
Thus if the ocean temperature does not change, and we add 50 tons of CO2 to the atmosphere, 49 tons of it will go into the ocean leaving an additional ton left in the atmosphere.
Conversely, if we take 50 tons of CO2 out of the atmosphere, the ocean will release 49tons, leaving only a ton less in the atmosphere, again providing ocean temperatures remain constant.
Thus given that around half the human-caused CO2 adds to the atmosphere each year, the majority (about 96%) of the additional CO2 in the air must be naturally-produced by a temperature-change or by something else.
The only reasonable explanation here is that the ocean is heating on average, and releasing that extra CO2 we see in the atmosphere. The data above showing that the CO2 changes lag the temperature change should thus be expected. The lags look to mainly be due to the ocean currents, thus taking some time before some volume of water gets back in contact with the air and can thus exchange CO2 to reach equilibrium levels in each.
If extra CO2 in the atmosphere caused a significant heating, then we’d have a positive feedback situation with a narrow range of unstable equilibrium. Looking at historical temperatures against CO2, this is untenable and we’d by now either be a snowball or a Venus.
That leaves us with natural causes of the temperature change, but we don’t know what they are. If we don’t know why it happened the last times (MWP, Roman warm period, Ionian climate optimum, etc. at around 1000-year intervals) then we also can’t predict why this warm period happened, and we can’t predict when it will end, and to pretend you can predict future changes is unscientific.
If we do achieve Net Zero CO2 emissions, it’s basically going to make very little difference to the amount of CO2 in the atmosphere. 96% of that additional CO2 is naturally-produced, after all. It also won’t measurably affect the temperatures or the weather. We can’t control the climate, except by changing where water evaporates and thus drives the weather, thus changing the irrigation status or what’s growing (trees, other crops) will change the weather, but mostly that won’t be predictable either.
Net here is that we have little control on CO2 levels, and even less control on climate. It is however useful to have more CO2 to improve agricultural yields. It’ll also make life easier in future if we have plentiful and cheap energy to be able to deal with whatever the weather throws at us, given that we still can’t predict it with any certainty more than a few days ahead.
Please provide proof or links to a study that proves 98% of ‘man made’ CO2 goes into the ocean. The number appears to be too pat to be real and, as far as I’m aware, contradicts what we know of the oceans and processes.
Richard – it’s been a bit of data from a long time back, so I had to search for it. See https://worldoceanreview.com/en/wor-1/ocean-chemistry/co2-reservoir/ for a reference to the mass of CO2 in the ocean:
“The ocean, with around 38,000 gigatons (Gt) of carbon (1 gigaton = 1 billion tons), contains 16 times as much carbon as the terrestrial biosphere, that is all plant and the underlying soils on our planet, and around 60 times as much as the pre-industrial atmosphere, i.e., at a time before people began to drastically alter the atmospheric CO2 content by the increased burning of coal, oil and gas.”
Dissolution of CO2 in water is pretty fast, but will only happen at the surface. Thus the ocean currents moving water between the sea-bottom to the surface will affect the time it takes to reach an equilibrium.
Also see https://earthobservatory.nasa.gov/features/OceanCarbon for measurements of (some of) the rates of CO2 absorption, and that the results were somewhat surprising.
NASA are a bit more nuanced on the boundary layer between the surface and the deep ocean, and some of what they call deep ocean will have currents and thus be part of the Carbon cycle too. If there are fish there, there must be Oxygen too and CO2. If there’s Oxygen there, I’d expect that that water must have been at the surface at some point.
Thus the 1:50 ratio may not be exact, but it’s somewhere in the right ballpark. Though human CO2 production (somewhere around 3-4% of the natural emissions according to the IPCC, though the natural emissions are estimates and we’ve found a few more undersea volcanoes since then so could be wide error-band) has increased, the rate of increase in the Mauna Loa data has not really matched human emissions that well.
Though it’s common to propose that the Earth is in thermodynamic equilibrium or that other processes are in equilibrium (and I’ve implied that here, too, for brevity), they aren’t. Conditions are always changing and the system will always be moving towards an equilibrium as being the lowest potential energy. It’s why we have weather, after all.
It remains, though, that if the temperatures at the places in the ocean that CO2 is dissolved and evolved (because of the local temperature and thus where the equilibrium would lie) that the majority of extra human CO2 would be absorbed by the ocean. If extra CO2 caused a significant temperature rise, then the temperature rise would lag the CO2 rise. As it is, the CO2 rise lags the temperature rise. Thus it’s pretty certain that the ocean temperatures rose first, and outgassed CO2, and there’s really very little we can do about that. Luckily this change is beneficial. Turn it the other way round, and if the ocean cools and absorbs more CO2, and we’ve got a problem, Houston….
Problem, of course, is that we don’t know why the temperature started rising after the Little Ice Age (around 1750 or so), long before humans started to burn significant amounts of coal or oil. It took around 200 years onwards from that (1950) to get past 300ppm CO2 in the air. We don’t know why it got cold in the LIA either.
Yeah, I was afraid of that. It appears to be a purely theoretical hypothesis based on limited laboratory experiments and models. You did note, I expect, the repeated use of words such as ‘could’ or ‘may’ rather than a definite or absolute statement of fact? There is a lot of handwaving and ‘climate science’ explanations throughout; it doesn’t come across as a robust, scientific study at all, I’m afraid. If they have continued to study this in the field (or ocean, as it were) and have firmed up their vague notions into definite observations and actual supported evidence then I would be interested but, as it stands, I think I’ll pass, sorry.
“proof” only exists in mathematics and logic. Everything else is evidence which can be countered with more persuasive evidence. The real problem arises when faulty methodologies are used to produce “evidence”.
Ridiculous article. The basis of the scientific claim that CO2 drives warming is not a mere correlation between global temperature and CO2 concentration (though such a correlation indisputably exists), the basis is the scientific understanding of the physics of the atmosphere and energy.
Moreover, the article’s attempt to show temperature change preceding CO2 change is patently absurd – no scientists has ever argued that the annual CO2 cycle is driven by anything other than temperature change. What scientists say is that the long term observed increase in the global mean temperature is being driven by the long term increase in atmospheric CO2.
Why does this site seem content to proliferate misinformation? Should a platform claiming to be dedicated to scientific skepticism be more critical of the content it hosts?
Seems pretty conclusive
Unfiddled data doesn’t lie
Thanks for posting a random graph with no data sources. Here is a better one:
Looking forward to the mental gymnastics you’ll contort through to rationalize this away.
What magic happened c. 1960? The correlation before then is poor. Looking forward to the mental gymnastics you’ll contort through to rationalize this away.
The stronger CO2 forcing gets, the more the system looks like it is being driven by changes in CO2 concentration, that’s pretty straightforward.
“looks like”
This AlanJ’s version of science… LOL !!
Using data specifically adjusted to match the rise in CO2.. so that it “LOOKS LIKE” !!!
I bet UAH doesn’t correlate with CO2.
No it’s not. What magic happened after c. 1960 that didn’t happen if we look back over past millenia?
He can’t – the hoax is based on false flags and dodgy, tampered with data
Showing correlation?
What else ya got?
Hey Alan,
do another one for the last 300 years….
You complained about Energywise’s graph not having data sources. The graph clearly is marked “CO2 Coalition.” However, when I go to the link for Mauna Loa CO2 that you provided, nowhere do I see a graph or table providing CO2 forcing, which is what you display. Would you mind explaining that little discrepancy?
It’s calculated from CO2 concentration as:
From Myrrh, et al., 1998. Thanks for calling it out, I should have provided that citation.
So , more basic anti-science… based on assumptions and conjectures.
So funny. !
The net result of that forcing is called evaporative cooling.
AnalJ can’t even get the name correct.. so funny !
Its models all the way.. and the absolutely idiotic assumption that “clear sky” means no water vapour.
How did this ever get passed by peer-review ??
Oh wait .. its “climate non-science”
Thanks, Alan. Nick mentioned forcing vs CO2 in an earlier thread, but I’d misplaced the formula.
Do you have a similar equation to relate temperature change to forcing change?
Using:
NOAA temperature data https://www.ncei.noaa.gov/data/noaa-global-surface-temperature/v5.1/access/timeseries/
Mauna Loa CO2 concentrations https://gml.noaa.gov/ccgg/trends/
and Law Dome CO2 reconstructed CO2 concentrations https://www.ncei.noaa.gov/access/paleo-search/study/9959
to give a dataset back to 1850, and charted in Veusz,
I get the following regressions of average temperature anomalies vs forcing (above 280 ppm)
Ocean: -0.24 + 0.43 forcing
Combined: -0.36 + 0.59 forcing
Land: -0.63 + 0.94 forcing
500ppm will give a forcing of 3.1 M/m^2
560 ppm will give a forcing of 3.7 W/m^2
There is an interesting narrow temperature spike centred around 310 ppm for both Land and Ocean data series. That occurred in the mid-1940s.
The temperature was also quite a bit above the trend line around 280 – 290 ppm. The combined effect is to flatten the Land and Combined trends.
Modifying this to give forcing above 140 ppm gives the same slope, and the following constants
Ocean: -1.8
Combined: -2.5
Land: -4.1
Channeling my inner Asimov, well this is interesting.
Splitting the data set into pre-1950 and 1950 on, and using the forcing above 280 ppm as above
1850 – 1949
Ocean: -0.10 + 0.03 forcing
Combined: -0.27 + 0.36 forcing
Land: -9.63 + 1.10 forcing
1950 – 2022
Ocean: -0.30 + 0.47 forcing
Combined: -0.48 + 0.67 forcing
Land: -0.86 + 1.09 forcing
This may well just be an artefact of splitting a noisy data set after a peak. Picking an earlier break point (lower CO2 concentration) such as 1936 (309 ppm)would have given a negative slope for the earlier period and shallower slope for the later period.
Actually, the ocean temperature trend seems to be positive over 300 ppm.
But why is the ocean trend negative below 300 ppm? What caused the 310-315 ppm peak in both land and ocean?
That was a typo, sorry.
It should be
Land: -0.63 + 1.10 forcing
Ha ha ha,
Your reply was useless since they are not close to the starting points at all with the two charts he posted and that it was many decades long contradiction in the second chart that you chose to ignore.
You really need to be more honest in your replies.
They can’t – honesty would require them to confront the hoax
No contortions required – your cobbled together graph, looking like it was spliced together on a ZX Spectrum, using an average of 102 IPCC CMIP5 model runs in 32 groupings is as phoney as the whole alarmism bilge
CO2 levels increased following the industrial recovery from WW2, but, temperatures fell – it really is that simple
Again, you’re not providing any data sources, so it’s impossible for us to even begin a rational discussion of the information the graph is presenting. None of the data in the graph I provided is from model results, which you can easily verify because I provided the sources.
It is impossible for AlanJ to be part of a rational discussion..
… that is because he is a brain-washed anti-science zealot.
Still using data he KNOWS is mainly urban warming and agenda-driven mal-adjustments….. why ??
I wonder what he gets from supporting this CON/SCAM/HOAX that wants to destroy western society?
He never has answered that question
So are you saying the graph posted by Energywise – which shows global temperatures falling for over 30 years as co2 rose linearly – is wrong?
No, the general picture of a decline in global temperature from around 1940 to around 1970 is perfectly consistent with the data I provided above, but the particulars of the graph are pointless to talk about without knowing the data source.
CO2 forcing prior to ca. 1950 or so was not particularly strong, and was not the dominant driver of observed trends in the early 19th century. You can see that as concentration continued to increase and forcing continues to grow that the trend in temperature tracks CO2 more and more closely after that point. You can see that pretty clearly in fig 9.5 from the IPCC AR4:
Edit: Above should say “early 20th century”
Again. ASS-umption driven models.
There is NOTHING REAL about either graph !
So why this?…..
WRONG.. The graph you provided is from corrupted modelled surface data… (what do you think the “adjustment” routines are, if not a model.)
Your myopic fixation on CO2 ignoring other variables is the source of your delusions. At least 16 peer reviewed papers have documented a reduction in clouds during the modern warm period. The increase in solar radiation reaching the surface was far greater than the human forcing. Never mind that you have causality backwards.
https://www.mdpi.com/2413-4155/5/3/35
That is NOT “global temperature.”
It is a mal-adjusted fabrication from data that is totally unsuitable for gauging temperature change over time.
Correct. It shows 2000 as being <> 0.5 degrees warmer than 1960. Complete made up bullshit from corrupted surface readings. The radiosonde graph I posted shows that to be the case.
That graph is a lie.
The fact that a completely different dataset showing a different thing exists does not make a lie of the dataset I provided earlier. That isn’t how reality works. Your radiosonde data shows a pronounced warming trend anyway, the early half is below the zero line and the later half is above it.
GISS is NOT a data set..
It is a fabrication from sites that are totally unfit for any climate purpose whatsoever… manically adjusted by a FAKE agenda.
Sure it does. Radiosonde agrees with satellite. Yours doesn’t.
Well whoopty do! I provided that graph to disprove the accuracy of yours. The other two graphs you provided above are exactly the same.
That’s good, because satellites and radiosonde are measuring a different thing than surface air temperature. I don’t know why you believe they would all be identical.
It doesn’t disprove the accuracy of anything, it’s just another dataset. But it does show significant warming.
We don’t know either the “global temperature” or the “CO2 forcing” prior to 1880 (as if we knew either then, but I’ll carry on). What I see is the CO2 line acting like a trailing average to temps. The big temperature spike from 1930 to 1945, and back down again to 1955 is represented in the CO2 line as a plateau. When temps finally start climbing again after 1980, CO2 catches up and follows.
AlanJ;
Your graph shows increased warming 1930-1960, but no increase in CO2 emissions, which NEGATES your theory.
As Richard Feynman said “It doesn’t matter how beautiful your theory .is,……if it doesn’t agree with experiment, it is wrong.
It doesn’t negate the theory in any way whatsoever, because the theory does not suggest that CO2 is the only variable that can affect temperatures, particularly in the early 20th century, when CO2 forcing was small. It suggests nothing more than that CO2 did not drive the spike, but no one ever said it did.
What theory? You mean the anthropogenic co2-warming hypothesis?
Alan J.
What DID drive the spike was a decrease in atmospheric SO2 aerosol levels due to decreased industrial activity during the depression years, and a stalled heat dome over the mid-west. With less SO2 aerosol pollution, temperatures naturally rise because of the cleaner air.
This is the cause of ALL of the modern warming,since 1980, due to global Clean Air activities to reduce industrial SO2 aerosol pollution. There is ZERO warming from CO2, and it is provable..
All conjecture, show proof.
AlanJ:
O.K.
https://doi.org/10.30574/wjarr.2023.19.3.1996
You weren’t embarrassed to post that, even a little? The “paper” contains nothing but conjecture. The author claims that aerosol pollution decreased ergo this decrease is the cause of 100% of observed warming. Asinine.
What else have you got?
AlanJ:
NOT very bright, are you?
Let me explain: When millions of tons of dimming SO2 aerosol pollution are removed from the atmosphere over the course of years, the cleansed air increases the intensity of the incoming solar radiation striking the Earth’s surface, causing increased warming.
No conjecture involved. Just a fact that has been proven over and over, but one that has totally escaped your feeble reasoning.
CO2 continually goes up while the temperature goes up and down.
The geological climate of the Earth is a 2.56 million-year ice age named the Quaternary Glaciation.
The Earth is in a warmer but still cold interglacial period that alternates with very cold glacial periods. That climate won’t change until there is no natural ice on the Earth.
The Grand Solar Minimum has already started and NOAA forecast that the Sunspot Number will start dropping in 2025 and continue dropping until at least 2040 when their forecast ends.
The tropics are still warm, the Arctic and Antarctic are still cold, the rainforests are still wet and the deserts are still dry. The phony “climate change” that is all the rage is just the weather which is always changing.
This recent study shows that the cold weather we have every year causes about 4.6 million deaths a year globally mainly through increased strokes and heart attacks, compared with about 500,000 deaths a year from hot weather. We can’t easily protect our lungs from the cold air in the winter and that causes our blood vessels to constrict causing blood pressure to increase leading to heart attacks and strokes.
‘Global, regional and national burden of mortality associated with nonoptimal ambient temperatures from 2000 to 2019: a three-stage modelling study’
https://www.thelancet.com/journals/lanplh/article/PIIS2542-5196(21)00081-4/fulltext
This study from 2015 says that cold weather kills 20 times as many people as hot weather and that moderately warm or cool weather kills far more people than extreme weather. Increased strokes and heart attacks from cool weather are the main cause of the deaths.
‘Mortality risk attributable to high and low ambient temperature: a multi-country observational study’ https://www.thelancet.com/journals/lancet/article/PIIS0140-6736(14)62114-0/fulltext
Please provide proof. Not a fancy chart showing a false correlation, not an opinion piece as an appeal to authority, nor a study of model output showing more false correlations but an actual scientific study proving the causative process that causes CO2 to increase temperatures globally, over a wide range and all year round. Thank you.
Here you go:
https://www.rsc.org/images/Arrhenius1896_tcm18-173546.pdf
You didn’t answer the question just a cut and paste answer is the best you can do, and it doesn’t counter his statement anyway.
You 12 years old?
I think the reference I provided was highly relevant and extremely suitable. If you think we need to build on the reference with additional citations I would be happy to help you with that. But perhaps you could start by actually contributing to the discussion in some kind of productive or meaningful way first.
“I think the reference I provided was highly relevant”
Yes, it shows the idea of CO2 warming in the atmosphere is based on very WONKY science and baseless assertions.
Can’t even get the dimension correct in his equations.
LOL,
Once again you didn’t answer his question.
You are not impressing me with your continual failure to support your claim with stupid evasions.
“But perhaps you could start by actually contributing to the discussion in some kind of productive or meaningful way first.”
That’s hilarious coming from AlanJ…
… who has never posted a productive or meaningful post in its whole time here.
Its only contribution is baseless gibbering, and petty attempts at distraction.
I’m sorry but Arrhenius’ laboratory work, which he later refuted as incorrect by the way, only provides observations of emissions spectra. I asked for the causative process (in the real world, not a laboratory) that causes CO2 to behave the way you seem to think it does. You have given me nothing.
I didn’t realize that laboratories exist outside of the physical realm! Very interesting.
But in seriousness, that is a gross misrepresentation of Arrhenius’ work. He relies on observations of how energy moves through the atmosphere and through gases of varying compositions, and how this exchange of energy influences the near surface temperature. His calculations were rudimentary, but pioneering. Later work incorporated much more robust observations of emission spectra for the atmosphere, such as the work of Manabe and Wetherald in 1967. These same principles are applied to studying stellar evolution, but somehow this application is quite uncontroversial to the contrarian set.
We’re not being pushed as taxpayers to stump up $trillions to deal with some allegedly harmful effects of stellar evolution though, are we?
So just as long as science doesn’t conflict with your political beliefs you have no issues with it? Oops, I think you said the quiet part out loud.
CO2 at the temperature and pressure we have in the atmosphere has an emissivity of almost zero. How does it do what you claim?
Here are the results of laboratory experiments showing that.
If I am not mistaken, this graph only shows the curves down to about 300K, most of the atmosphere is colder than this. This doesn’t seem to hold much relevance.
HAW HAW HAW HAW HAW HAW HAW HAW HAW, you don’t understand the chart.
Who is paying you to be this stupid?
But, y’know, I’m sure you’ve got some really stellar take you’ll share with us all forthwith.
Hey this foo Faw who first stated this stupidity,
Notice you didn’t correct your error because you have no idea what chart is talking about that is why people are laughing at you because you STILL do not understand the chart.
Better for you to drop your embarrassing ignorance.
Since I can’t read your mind, you need to actually use your words and explain what the error you think I’m making is, instead of being patronizing and speaking in innuendo. Thanks.
LOL
You still show zero indication you understand the chart since you don’t explain it as it is.
You MUST be 12 years old cutting science classes.
No, SunsetTommy, use your big boy words. If you think I’m wrong, explain why. That’s how grown ups talk to each other.
Total emissivity of CO2 in the atmosphere is around 0.0017
This is as close to zero as whatever..
Please cite, chapter and subsection, exactly where in any IPCC report it is claimed that carbon dioxide in the atmosphere is a “nearly blackbody system.” I’ll wait.
Your quoted passage contains no attempt whatsoever at quantification, “negligible” is not a useful term.
What a petty little cop-out.
You are an ignorant twat !!
The fool still doesn’t know what the emissivity of CO2 is.
“If I am not mistaken”
Which you invariably are…..
AlanJ lives in a little glass jar.. explains a lot of things. !!
Arrhenius found that CO2 was a radiatively active gas.
That is the sum total of that paper..
Everything that followed was unproven conjecture.
You PRETEND to be a scientist… but you can’t see that.. WOW !!
He also said it was good for the planet.
What observations were these in 1880?
Ha ha ha….,
You are running around in circles avoiding his original question.
I don’t think you have the answer thus evade and hope he forgets.
“I didn’t realize that laboratories exist outside of the physical realm
OMG !!! the AlanJ idiot thinks an enclose glass jar represents the atmosphere.
How much more of his IGNORANCE can he show us !
You continue to live in 19th century science. The rest of us moved on and discovered the cooling effect of the water cycle. All you get from the energy estimated in that old science is more precipitation.
No proof of the effect of CO2 in the atmosphere in that link… pure conjecture.
Unless you think the atmosphere is a pressurised jar.
Did you know that according to Arrhenius, T⁴ is a dimensionless number . (see equ 4)!
Then they have missed the solar energy impact on photosynthesis and respiration.
Fair enough. I should say the annual CO2 fluxes are driven by the annual seasonal cycle, not specifically by temperature (but because the annual seasonal cycle is immediately correlated with temperature, annual CO2 fluxes are preceded by the annual temperature cycle).
We’re laughing at you
ROFLMAO.. at AlanJ.. the poor manic anti-science zealot.
The annual seasonal cycle is spuriously correlated with temperature, but is really driven by the availability of light levels high enough to drive photosynthesis. With sufficient light, plants can grow if the temperature stays above freezing.
That’s all fine and well. I’m responding to the post, which shows that CO2 lags the annual temperature cycle. The article is claiming that this conclusively proves that CO2 does not drive temperature change. I am saying that not one single person has ever suggested that CO2 forcing drives the annual temperature cycle. Hopefully this is clearer for you.
Haw haw haw, you are at least a dozen published papers behind that long established that CO2 lags temperature over long-time scales.
Here is a nice chart showing that CO2 doesn’t move with large temperature swings during the interglacial period based on GISP2 data,
LINK
What a peculiar graphic. The scale on the CO2 axis is too small to see much detail, but the x-axis between each series is misaligned. GISP2 ends in 1855, so bringing it up to present day would look like this:
But ultimately, you’re showing temperatures for single location in Greenland, not even the entirety of Greenland itself, much less the entire planet. It’s all very silly, and of course you know it, because you’re not stupid, you’re just relying on other people being stupid. So predictable.
Funny how CO2 is well mixed and provides uniform forcing all over the earth. Funny how insolation is uniform all over the earth by averaging. Funny how every station is not a valid sample of what is happening on the globe. Maybe, just maybe, your preoccupation with correlating CO2 and temperature will never prove causation.
CO2 is well mixed and does provide uniform (global) forcing, insolation is not uniform nor is it averaged – the earth is a rotating sphere, each weather station provides a valid sample of the global temperature. I have no preoccupation with correlating temperature and CO2, the two correlate as a consequence of the physics, it is unsurprising and expected.
Funny how all the radiation diagrams calculate “back radiation” based on an average insolation. Makes you wonder why the poles warm faster due to CO2.
If you are referring to energy budget diagrams like this one, they are just balancing the net fluxes into and out of the system, not considering how the incident sunlight is distributed around the planet. The incoming solar radiation figure of 340 W’m^2 already factors in the fact that only the component of sunlight normal to the surface is absorbed. It is not an average, but the net flux.
Yes, CO2 follows temperature.
That is the physics.
There is no real physics that says CO2 causes warming.
bnice2000
But there is overwhelming evidence that decreased amounts of SO2 aerosol pollution in the atmosphere will cause temperatures to rise.
The chart is correct as it was 100% based on the GISP2 data which are available in the link and that warmist/alarmists for many years have claimed that CO2 levels in the air is nearly uniform all over the planet.
Your desperation is evident since you trying to create a false narrative while I posted a genuine chart based on the available data that you didn’t counter.
Greenland Ice Sheet Project 2
On 1 July 1993, after five years of drilling, the Greenland Ice Sheet Project Two (GISP2,) penetrated through the ice sheet and 1.55 meters into bedrock recovering an ice core 3053.44 meters in depth, the deepest ice core thus far recovered in the world. With the completion of the GISP2 drilling program and a companion European ice coring effort (the Greenland Ice core Project (GRIP), located 28 Km to the east) a new era in paleoenvironmental investigation has been opened. These records are of extreme significance to our understanding of environmental change because they not only provide the highest resolution, continuous, multi-parameter view produced thus far but as importantly the two records can be used to validate each other(e.g., dating, presence of events, length of the environmental record, presence or lack of discontinuities), the only such experiment of this magnitude in ice core research.
In late 1988 the Office of Polar Programs (OPP, formerly the division of Polar Programs), of the US. National Science Foundation (NSF) officially initiated GISP2. It was developed as the first in a series of integrated studies, administered by OPP under its Arctic System Science (ARCSS) program, an initiative focusing on environmental change in the Arctic.
LINK
The data aren’t the problem in the chart, it’s how they were plotted. GISP2 ends in 1855, so it needs to be plotted with the correct dates on the x-axis. And, again, CO2 drives global-scale temperature change, your chart shows temperature swings for a singular point location in Greenland.
“And, again, CO2 drives global-scale temperature change”
RUBBISH.. That is a scientifically unsupportable garbage statement..
Fit only for a nil-educated, mindless AGW cult zealot.
Your 1855 whine is a STRAWMAN argument since the point of the chart I posted was about large temperature swings and a flat to nearly flat CO2 line which is shown in BOTH charts by the way which YOU keep ignoring.
You ignored what the GRIP group stated:
It’s not a straw man whatsoever, the chart ends in 1855, it doesn’t contain the modern warming period, and isn’t aligned with the CO2 concentration series plotted alongside it. That’s an error that needs to be corrected. That you don’t like it does not mean it isn’t a valid point to make.
The more important point is that the chart only shows Greenland temperatures at a single point location in Greenland, it doesn’t show global-scale temperature change.
WRONG.
The bottom of the uptick is around 1900.
Mann’s Hockey Stick and Pages 2K prove that to be the case.
You are producing childish MISINFORMATION yet again..
… in a puerile attempt to cover your cult agenda.
The ERROR is in YOUR mind.
You just refuse to face reality.
HA HA HA HA HA,
You are again ignoring the previous 10,000 years in the chart to whine about the 1855 cutoff date which doesn’t change the point that for those 8,500 years CO2 hardly changes while large temperature swings are evident.
The main reason for the 1855 cutoff date is because that is where the forming ice is no longer closed for data use, it is clear you are an ignorant blowhard trying to salvage your non argument bullshit.
Once again you ignored this:
You are one stupid ignorant kid.
I’m pointing out an error in your chart. You and Bnice are the ones making a big deal about it and prolonging your humiliation instead of acknowledging the error and moving on.
The quoted section is irrelevant – I agree that the GISP cores are important paleoclimate archives, that does not change one single thing about the fact that GISP2 is a single core reflection a single location in Greenland, it is not a global temperature record. CO2 drives global scale change, it does not drive point-level variability.
The Antarctic Ice core shows a similar CO2 range between 260-280 ppm for most of the same time frame that GISP2 does as clearly shown in Javiers post LINK
While temperature changes doesn’t match with CO2 changes at all in EITHER Ice core data bases.
WRONG.. what a pitiful attempt to deny reality.
One of the AGW cultists providing misinformation again.
We know we can rely on AnalJ to be moronically stupid.
CO2 doesn’t “drive” anything .. Except plant growth.
Hopefully this makes reality clearer for you, AJ.
The theory of the physics involved is the basis of the models that is then the basis of the correlation. And Menton pointed out the data sets used to derive that correlative interpretation have been compromised. It is not simply the theory in question but the actual data used. Menton says the data are compromised – not merely that there is the problem of correlation.
And he’s right.
Yes. Menton is right.
“Why does this site seem content to proliferate misinformation?”
It doesn’t.. it counters your idiotic misinformation posts as soon as you make them. !
“What scientists say is that the long term observed increase in the global mean temperature is being driven by the long term increase in atmospheric CO2.”
This is arrant balderdash.. based only on a short term correlation.
There is no scientific evidence for the statement.
Please to posting MISINFORMATION. !
CO2 has been anti-correlated for most of the Holocene.
Fixed the error and reposted – thanks for the heads up bnice
Javier provides a very similar graph here..
https://wattsupwiththat.com/2023/10/25/holocene-climate-change-in-the-arctic/#comment-3807080
typo… 2nd last line…
…message to AlanJ
Please STOP posting MISINFORMATION.
Your graph ends in 1855, not the modern day, so “the modern warming” is not present on it (nor is the modern industrial CO2 increase as you can see).
But you make a general point that is not wrong, per se, just not relevant. CO2 forcing over the Holocene has been low, and it was not the primary driver of the temperature trend across this period. Due to human activities, CO2 forcing is increasing rapidly, and it is driving a long term increase in the planet’s temperature. These facts can coexist peacefully.
No the warm forcing of CO2 at the 430 ppm level is negligible and gets less and less as it accumulates a reality you keep overlooking.
It’s a change in concentration that produces forcing – each doubling producing about 3.7W/m^2. Referring to the forcing “at” a specific concentration is not meaningful. CO2 did not vary much over most of the Holocene, so wasn’t applying a substantial forcing. It has increased rapidly by a large amount since the industrial area, and this has produced substantial climate forcing.
LOL.. this mythical forcing that has NEVER been observed or measured anywhere on the planet
Your putrid little cult religion is based on FAKERY from the quicksand foundations up
That is a tiny number you fall on the sword with as you left out something that dwarfs it into a minor warming effect that isn’t much above noise level.
You left out the TOTAL GLOBAL AVERAGE DOWNWELLING
which is around 508 W/m2
LOL
Downwelling radiation is not a forcing, a forcing is an energy imbalance at the top of the atmosphere. You seem to be very angry about… something, and are just lashing out me randomly with no clear disagreement actually being raised.
You seem to be very stupid. AnalJ.
You should follow the science, instead of what your cult leaders say.
That way you wouldn’t look so perpetually stupid.
Your graph ends in 1855
WRONG. the bottom of the uptick at the end is around 1900
Or are you saying Mickey Mann was wrong and his hockey stick is bogus !
It’s not, the GISP2 ice core top is dated at 95 years BP (“Present” being 1950 for radiocarbon dating). Mann’s 1998 reconstruction comes up to 1981. You should probably actually research these things before writing “WRONG” in all caps.
You poor sorry little cultist..
DENIAL of the Mann Hockey stick.
DENIAL of Pages2K.
Both of which show the bottom of the uptick being around 1900.
Are you now a HERETIC to the AGW cult
STOP YOUR DELIBERATE LIES and MISINFORMATION.
You are making a complete FOOL of yourself.
Oh dear, bnice. It doesn’t have to be this way, it really doesn’t. No one is forcing you to embarrass yourself all the time. You’re just choosing to do it, over and over again. From the NOAA:
Continued DENIAL of Mickey Mann and Pages2K
So sadly PATHETIC. !
How does it feel to know you have just PROVEN both Mickey Mann and the Pages2K graphs are FAKE. 🙂
Doing a great job there, fool !
Well, because I’m not an absolute imbecile, I understand that any scientist using the GISP2 record will know that the record extends only to 1855, and that includes Mann and the scientists involved with PAGES. But perhaps you have a different understanding for… reasons.
“These facts can coexist peacefully.”
Only in the mind of the brain-washed ignorant AGW zealot.
And no, they are NOT facts…
… there is no evidence that CO2 drives global warming
You have proven that by your complete inability to produce any.
“ CO2 forcing over the Holocene has been low,”
There’s that moronic meaningless “forcing” term again.
Your whole post is just arrant NONSENSE from start to finish.
Even if you take the word “forcing” as having any meaning.
The forcing, according to actually absorption measurements (as opposed to theory of log forcing), levels off at around 280ppm.
You really do have to stop just believing all the CRAP mantra BS they have been feeding you… and look at the actual science.
Do you have that capability?. almost certainly NOT !
What AlanJ is saying is that humans could not possibly have been the cause of the uptick at the end of the GISP 2 graph.
Well done, .. you got something correct. !
It really is hard to keep YOUR LIES straight and aligned.. isn’t it !
No, the science is not settled by a long way – fact
CO2 is the gas of life – fact
We are CO2 deficient – fact
Our current atmospheric level is around 418ppm – fact
Plants need 800-1300ppm for optimal growth – fact
A recent study showed CO2 increases follow temperature increases – fact
Meanwhile, some are making a fortune from the unsettled mess
https://www.netzerowatch.com/deceiving-public-over-cost-of-energy-transition/
Except for the physics that you and the rest of climate cult ignore. Climate pseudo-science ignores the effects of saturation and the atmospheric boundary layer. When these are factored in all you get is a little more precipitation from doubling CO2.
This is exactly why Miskolczi found a constant opacity. It is also why there is no tropical hot spot. Finally, it is why we can only see CO2 changes preceding temperature changes in the recent study.
Edit: “preceding” should be following.
“. . . we can only see CO2 . . . .”
For a second there, I thought you went full Greta.
What is “patently absurd” is your suggestion that the GAT has a significant annual temperature change! The Earth doesn’t work that way. At any one instant, Earth surface temperatures vary somewhere between -40F and 100F, with a calculated GAT very close to 57F To claim that very slight changes in GAT over the course of a 12 month period are sufficient to “drive” anything is balderdash.
Do human emissions of CO2 and other such “greenhouse gases” cause significant global warming, aka “climate change”?
The use of scare quotes here are greatly appreciated and serve as a reminder that they should always be used when referencing these intentionally misleading terms. Wikipedia states that scare quotes “may indicate that the author is using someone else’s term…, they may imply skepticism or disagreement, belief that the words are misused, or that the writer intends a meaning opposite to the words enclosed in quotes.”
The “Greenhouse Effect” is a complete misnomer, as CO2 does not restrict convectional heat like a greenhouse, and thus there is no such thing as “Greenhouse Gases”. “Climate Change” is merely a transparent rebranding effort to disguise failed arguments promoted by “Global Warming” hoaxters.
Scare Quotes should always be employed when writing about these topics and Air Quotes utilized whenever speaking about them.
Even “Climate Change” is a misnomer. There is no climate that is actually changing. The deserts are still dry, the rainforests are still wet, the polar regions are still cold and the tropics are still warm with the temperate regions between warm and cold.
I beg to differ, although in a pedantic way.
There are hundreds, if not thousands, of identified regional locality climates around the globe, all with their own characteristics, idiosyncrasies & cycles based on the weather patterns, geography etc that dictate what their climates conditions present.
These locality climates can certainly be changed through land clearing etc.
Even worse, “climate change” is used in language as though it were a force that causes change in the weather. If ever a term was backward, that is one.
“Climate Change” is a made up term because “Greenhouse Effect” sounded pleasant and “Global Warming” promised ripened tomatoes.
Scare quotes? You are referring to “quotation marks” perhaps?
Most style manuals suggest only using double quotation marks for actual quotes. To highlight a word or phrase, it is suggested using single quotes or italics.
I realise that but I’ve never heard of anything called scare quotes before, I was curious.
Do We Really Know That:
1 Human Greenhouse Gas Emissions Cause Significant Climate Change?
2 DDT cause thin egg shells?*
3 Aerosols cause Global Cooling?
4 Sulfur dioxide and nitrogen oxide cause Acid rain?
5 Halocarbons caused the Ozone Hole?
6 Second hand smoke causes lung cancer?
These scares have been going on for a long time.
*Great illustration: Chicken & Eggs (-:
You don’t have to search too far to find articles like this:
The Myth that DDT Caused Egg Thinning and Depletion of Eagles
The Wall Street Journal
I like Dr. Brignell’s definitions. They still stand up quite well.
https://www.numberwatch.co.uk/vocabulary.htm
” universally accepted truth “
One does not easily discredit the “truth” of a cult.
See the Wiki entry for Harold Camping. He predicted Judgment Day (aka Rapture) with many followers believing. At least 3 dates were forecast without results. One failure should have been enough (see Einstein), but it took three before disillusionment settled on his followers.
Back to the first problem: Selectively Re-Emissive Gasses are not a “greenhouse” they’re a thermal rectifier.
NASA’s JPL website states,
“Climate models that include solar irradiance changes can’t reproduce the observed temperature trend over the past century or more without including a rise in greenhouse gases.”
Doesn’t this assume that the climate models correctly account for all relevant phenomena? How do they know this since there is no climate record independent of that used to empirically “tune” the models that can be used to test the models?
The method of exhaustion assumes there are a finite, known number of alternatives.
https://climate.nasa.gov/causes/
Well, I’m absolutely certain that correlation DOES prove causation!
Eating ice cream makes it hotter – we see this every year, year after year! People stop eating so much ice cream and we get cooler weather – that’s why it’s cool! And when people start eating more ice cream, the weather gets hotter! QED. And for further proof, we see this happening in BOTH the Northern and Southern hemisphere!
At least that’s what the left says…
The right is silent on the subject. Maybe they have invested in EVs and the like.
No they quietly invested in ice cream.
As the native Americans say, “It’s going to be a tough winter, the white men are cutting a lot of wood.”
or we might just use a little common sense – first the world had a mini ice age that ended in 1850 or so and most people with any common sense would think that a little warming after the end of an ice age would not only be appropriate, but actually good for mankind and the planet
second the vast majority of CO2 in the atmosphere is naturally occurring (each of the earth’s 7 billion humans emit 2 lbs. everyday not to mention trillions of animals doing that as well – then there are wildfires and volcanoes erupting) – CO2 comprises about 4 one hundredths of 1% of the atmosphere which means that beside being a trace element in the atmosphere, man’s industrial and transportation activities amount to something like 1 one hundredth of 1 % of the atmosphere; and it defies all common sense to believe that changing the atmosphere by 1 one hundredth of 1% would have any effect on the weather let alone the climate
finally a former head of the UNIPCC stated that the goal of the environmental movement is more about the destruction of capitalism than the climate – so this is all just another attempt by communists to take over the world
There is about one CO2 molecule per 5 million water molecules in the oceans and that one CO2 molecule is warmed by the land which isn’t very warm at all. How they claim CO2 is warming the oceans is beyond me.
This has been used to create command economies., i.e., government control by bureaucrats. Can anyone tell me of a place that this has ever succeeded?
In the mind of progressives. 🙂
When WUWT started it was filled with scientific/technical posts refuting the AGW theory with a few claiming it was a political ploy. I don’t see how anyone can attribute rising global temperatures to anything other than natural selection today but we keep trying to convince people that their theory is wrong based on science rather than politics. It won’t work. The propaganda is too strong and effective because of MSM control. I don’t know what the answer is but we need to change our approach to convincing people that the “science” is anything but based on decades of data rather than the current weather.
Forget about the science all together. It might never be totally explained. Concentrate on the economics. How more than the total of the world’s wealth will need to be confiscated in order to achieve nothing. Everyone’s standard of living will revert to a neolithic level. Humanity will be held prisoners in an ideological penitentiary. This is unprecedented in world history.
A very long time ago, a guy in (ancient) Greece started Climate Science.
All did was wonder why night-times were clear and windless but within 2 hours of the sun coming up, the sky became cloudy and it got windy.
What really got him wondering was what that process went into exact reverse within 2 hours of sunset
Bring it forward in time to modern primary schools and children are told about the similar process, especially noticeable on a beach or near the sea.
Kiddies are imprinted with The Knowledge that an onshore breeze starts blowing in the morning because:
“When the sun comes up, The Land warms up faster than The Sea and because warm air rises, the breeze blows in from the sea to replace what lifted into the sky”
Anybody could but nobody does, put a thermometer in contact with The Land and see for themselves what utter total garbage that is.
OK, the effect still happens so what makes it happen.
Plants make it happen, or trees especially.
It is that The Sun ‘wakes the trees up‘ and they start photosynthesising, sucking in CO₂
Also, the sun heats the leaves on the trees and they warm very quickly – which is great because it speeds the chemical processes involved.
But every molecule of CO₂, (because of the affinity that water and CO₂ have for each other) is pulled into the tree with a load of surplus water which the tree doesn’t need.
So the tree ‘dumps’ the extra water, which has been heated in the leaves by the sun.
Now the crazy bit, that warm water vapour is extremely bouyant because of the low molecular mass of water relative the other atmospheric gases and it races skyward, sucking/dragging the other gases with it.
And that is the cause of the onset of onshore breezes in the morning – the trees did it.
Other plants too but they simply don’t have the immense grunt that trees do.
And of course, that water vapour takes an immense amount of heat energy (NOT Temperature) up with it into the sky.
Thus, the ground/land is cooler than it would otherwise be.
But that process depends on the trees having an adequate store of water to call upon from the ground/soil beneath them – so what happens if there is neither any trees nor any store of water for the ones that are there.
Two things:
Attached is a screenshot from Meteoblue, showing their best calculation of Soil Moisture Content at the time Storm Babet was ravaging the UK (about Oct 15)
Can anyone envisage plumes of moist air rising off Europe, as opposed to the UK?
And when plumes of warm moist air rise into the sky, they make rain.
Can you picture Babet in that picture?
She’s screaming at you out of that picture and trying to get you see ‘The Observed Climate Change’ and its direct cause.
it is because the CO₂ in the atmosphere should have been, and was 50+ years ago, in the soils of Europe and retaining/storing immense amounts of water – which would have simultaneously cooled Europe’s summer long heatwave and have deflected Babet
And made UK’s summer less of the washout that it was.
So the CO₂ is not the cause, it is an effect – so to ‘solve’ climate change, we need to establish how and why the (organic) Carbon stored in Europe’s soils was removed
Reformed ex-climate alarmist: “There is no climate crisis, no consistent correlation between CO2 and Earth’s temperature; at times CO2 was 1300% of today, and we were stuck in cold conditions… There is no foundation to the climate scare—it’s based on models that don’t work.”
It never fails to amaze me how scientifically illiterate “climate scientists” are about basic science (chemistry, physics, biology, math, etc.).
Such as the author’s point that the data prove that warming preceded atmospheric CO2 increases. Like DUHH!!!
Here’s the basic science that the warmunists ignore:
The world’s oceans store about 50 times the mass of carbon than is contained in the atmosphere. Pretty simple calculation based upon measurements of the concentration of dissolved CO2 in seawater extrapolated across the known volume and mass of the oceans.
And it is also well known and proven that the solubility of CO2 in water is a function of temperature. For instance the solubility in water at 7 deg C is 1.331 on a volume of gaseous CO2 to liquid H20 basis, while at 17 deg C it drops to 0.956. That is a reduction in solubility of CO2 in water of 0.375 or 28%. Or 2.8% per deg C sensitivity. Of course there are other factors that affect how much carbon off gases from seawater, both chemical and physical, besides temperature. But the “bottom line” is that warmer oceans release more CO2 gas by a very significant amount given the huge identical in the volume and mass of carbon in the oceans vs that in the atmosphere.
Apparently the warmunists believe that microbe on the flea on the end of the dog’s tail is wagging the dog … and not the (rather obvious) other way around.
“In other words, it is the increase of temperature that caused increased CO2 concentration.”
Or rather that temperature changes usually seem to precede CO2 concentration changes, and that which comes later cannot cause that which occurred earlier. (Or least for those of us who choose to live in an Einsteinian Universe on a practical day to day basis.)
Good luck trying to tell that to Steven “kinetics-can-tell-you-nothing” Mosher.
There are some other arguments that could be made with data, but I no longer feel inclined to help catastrophists over their own inadequacies.
The more I dive into my studies of classic scientific practice and the established scientific method, the more I become convinced that science absolutely demands PEDANTRY.
That is, consistent precision in the application of science tenets, practices and treatments.
Which is why such principles as the null hypothesis and correlation does not equal causation exist.
Otherwise, scientific rigor is discarded, and everything is concluded on the basis of conjecture.
(oops – did I just describe the alarmist version of climate science?)
We have substituted arm waving for rigorous logic and verifiable facts.
We’ve known for decades from ice core samples that they have causation backwards. Recent papers with high resolution modern measurements leave no doubt. Harde 2023 is another one showing this.
https://www.researchgate.net/publication/373256379_Science_of_Climate_Change_About_Historical_CO2-Data_since_1826_Explanation_of_the_Peak_around_1940
False narratives and outright lies are often based on false assumptions. “Consensus” climate science is a house of cards with zero empirical support in the real world. Multiple lines of empirical evidence show it to be preposterous nonsense.
Americans can accelerate the next glacial period by driving battery-powered cars.
If Francis Menton believes that in order to prove causation (i.e. man-made CO2 emissions cause increasing temperatures), it needs to be tested against a “null hypothesis”, then the only “placebo” would for the entire world to stop burning fossil fuel. Some alarmists in the West might try to impose this on Europe or the USA, but unless somebody can convince China to go “net zero”, we will never see the “null hypothesis”.
Which means that causation will never be proven.
An alternative is to use the models, based on the current paradigm, to make predictions. If temperature and precipitation are not within at least 10% of what actually happens, then the models have failed the test of utility. The Scientific Method then requires the model be rejected, or at least modified.
“Our current atmospheric level is around 218ppm – fact”
I hope it is a LOT higher than that… that is close to plant starvation
… did you mean 418ppm
Yes, well spotted bnice, thank you
It is far more impossible than that. As we know CO2 is about 400 PPM right now. We know that humans emit almost 5% of the annual emissions.
That means that the 95% of the CO2 doesn’t cause anything, but the 5% of THAT, which is human emitted, is said to cause the warming.
That implies that only 20PPM of CO2 in the atmosphere is responsible for climate change. That is one CO2 molecule per 50,000 ‘other’ molecules in atmoshpere.
It is so preposterous that I’m totally amazed that so many smart people with a math background don’t see that. It doesn’t pass the sniff test.
Speaking of EV’s…here in Oregon, it snows. But as the EV market increases, gas tax revenue decreases. Now, ODOT, Oregon Department of Transportation is saying they have to cut back on snowplow operations because of budget cuts – and they are funded with gas tax money.
Very nice.
Very faint spots on the solar disk.
I know it does not have any direct influence on the energy balance.
The proof is simple. Look at the output of climate models and they show the globe warming everywhere. That is what is supposed to happen if CO2 is a driver of global energy uptake. The data reveals that some places have sustained cooling trends and some places have no trend. Some warming trends have been apparent for centuries.
All the current warming and cooling trends are following the changes in peak solar intensity. Believe it or not, the sun drives climate and Earth’s orbit drives most of the temperature change but humans are certainly impacting local climate. Urban heat. More or fewer trees. Air stilling from wind turbines.
OK, let’s say CO2 has a significant effect on (very slightly) elevating the world’s temperature, so what? There’s been simply no significant negative effects. https://wattsupwiththat.com/2021/04/25/wheres-the-emergency/
Christofides and coauthors mislead using the same mathematical trick as Murray Salby did long ago. From their 2020 paper:
“We note that differencing is of very common use in economics literature (e.g., [4,5]). In particular, for the [CO2] it proposed taking the logarithm before differencing (something resembling techniques used in economics [5]) and thus the time series that were correlated were Δ𝑇 and Δln[CO2], where the differences are taken over 12 months. By studying lagged correlations of the two, the study asserted that, while both causality directions exist, the results support the hypothesis that the dominant direction is T → CO2.”
Sounds reasonable, but here is the trick: human CO2 emissions have been approximately exponentially increasing over the past few decades, leading to an exponential increase in atmospheric CO2. By taking the logarithm of CO2, they convert the exponential into a straight line increase. By then taking the differences, they convert the linear increase into a constant offset. And finally, they analyze this with the correlation, cross-covariance, and other functions that all begin by _subtracting off a constant offset_. All told, their process is perfect designed to make the human CO2 emission disappear.
This leaves only the real, but much smaller effect of short term temperature changes influencing CO2. Because they have neatly subtracted off the enormous long term trend from their analysis, they give the impression that these tiny month-to-month fluctuations are the dominant effect.
But it’s only dominant because they have specifically designed their process to make human emissions invisible.
I can’t speak to the other papers mentioned in the OP, but everything by Christofides follows this same methodology, which makes all his papers worthless.
Francis. Happily, some people were onto these matters years ago.
….
Probable-Possible, my black hen,
She lays eggs in the Relative When.
She doesn’t lay eggs in the Positive Now,
Because she’s unable to postulate How.
F. Winsor & M. Parry, quoted by Jeff Masten in “Epistemic Ambiguity and the Calculus of Risk: Ethyl Corporation vs. Environmental Protection Agency,” South Dakota Law Review, 1976.
….
How extraordinary! … The richest, longest-lived, best-protected, most resourceful civilization, with the highest degree of insight into its own technology, is on its way to becoming the most frightened.
Aaron Wildavsky, political scientist, University of California, New York Times, 1979.
….
In “The Apocalyptics” 1984, Edith Efron.
In my view, Efron’s book is required reading about bureaucratic scare campaigns. It lays out the modus.
Geoff S
Climate is chaotic so it will behave in an unpredictable way whether CO2 is added or not. Basic thermodynamics/ Boltzmann limits possible warming. The big fear generated is sealevel rise but there’s no way of predicting whether precipitation will increase over Antarctica and Greenland to counteract possible melting or not. The only sensible way forward is to deal with issues when they arise with adaptation. One adaptation will be is to prepare for fossil fuels to run out over the next hundreds of years. Certainly no panic needed at present.
This is quite a long comment so I have split it into two parts. Part 1:
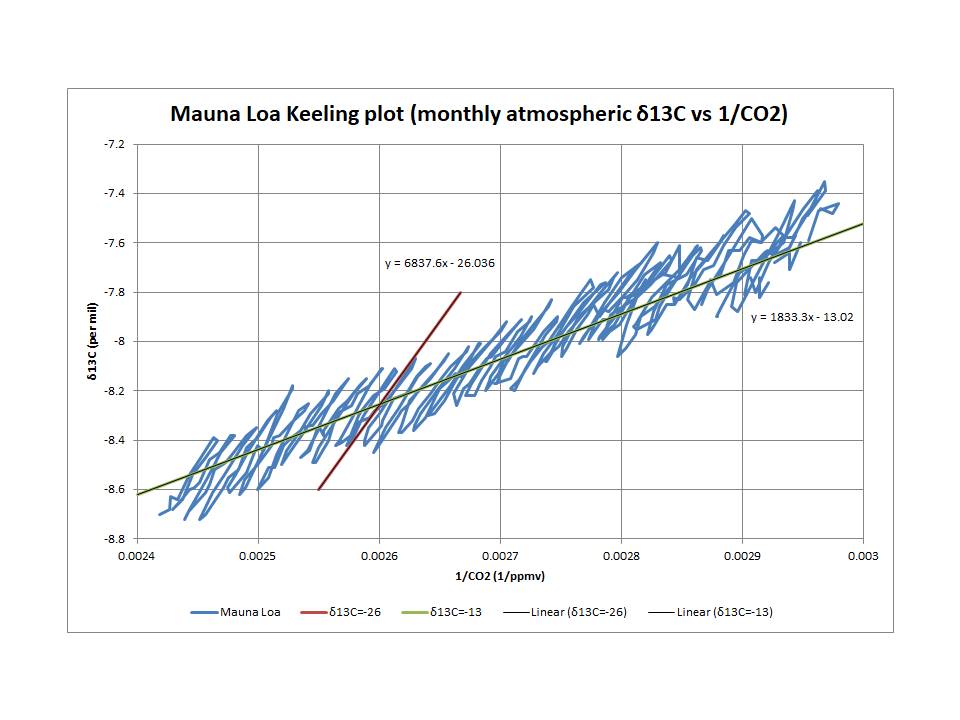
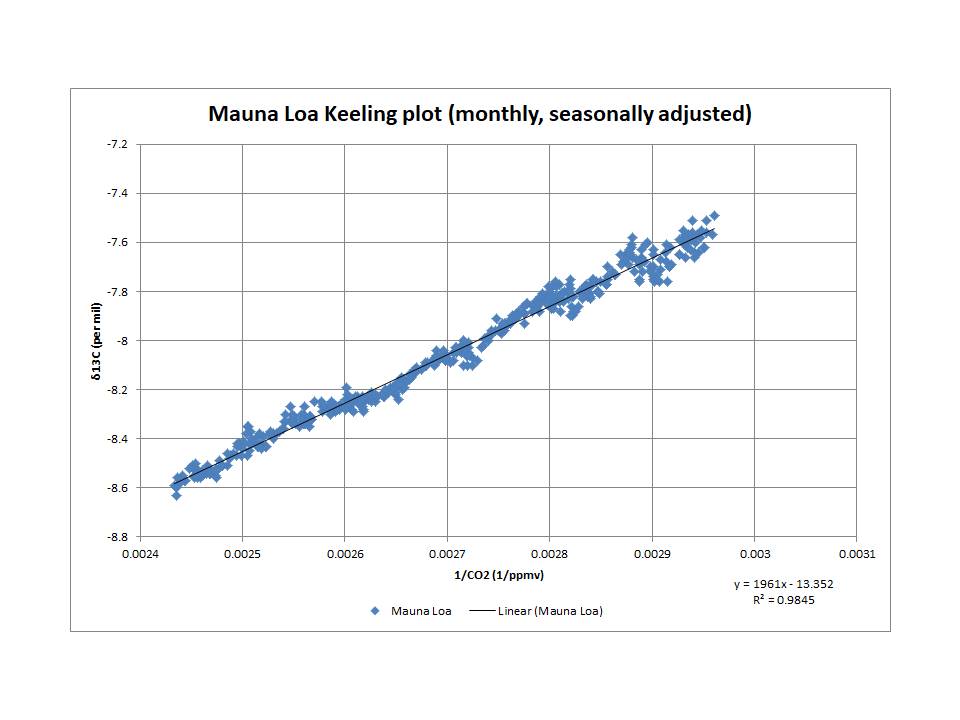
Thank you for the post and for highlighting several relevant papers. These discussions of atmospheric CO2 growth often highlight mass balance arguments, but usually ignore the value of isotope data which, in the case of stable isotopes, must individually satisfy mass balance considerations. Before I get into detail, however, it may help some readers if I add a brief description of Keeling plots as well as a simple explanation of δ13C, which initially may seem very strange – how can a ratio be a negative number?
Put simply, the δ13C of a CO2 sample is the difference between the measured 13C/12C ratio and the 13C/12C ratio of a fixed standard, expressed in per mil (‰) terms. Thus, a negative δ13C means that the sample has a lower 13C/12C ratio than the standard. The units of ‘per mil’ mean per thousand, so exactly the same as if expressed as a percentage (per hundred) but multiplied by 10. So, for example, a δ13C of -13‰ means that the sample has a 13C/12C ratio that is 1.3% lower than the 13C/12C ratio of the standard. This is very neat mathematically, because it can be treated just like the actual ratio, provided any equations are consistent in their application and it is widely used in the scientific literature in this way.
The other general point is that both 13C and 12C are stable isotopes, which means that both must separately satisfy mass balance principles. The presumption regarding total CO2 rather than 12CO2 for mass balance is OK, as it comprises 98.9% of total CO2, but it is not OK to invoke a model that fails to achieve mass balance for 13CO2. The mass balance equations for 13CO2 lead to a very useful plot known as the Keeling plot, where δ13C is plotted against the reciprocal of atmospheric CO2.
First, here is a fairly good reference (pdf) on Keeling plots including the basis as set out in the relevant mass balance equations: Kőhler et al (2006). The basic concept is that a linear relationship between 1/CO2 and δ13C indicates a constant value for the δ13C of the incremental CO2 and this value is given by the intercept of the plot. Figure 1B in the Kőhler paper shows the data for the Law Dome ice core going back to 1750 and provides an intercept δ13C of -13.1‰ with an R squared of 0.96.
The following two Keeling plots are based on direct atmospheric observations at Mauna Loa downloaded from the Scripps CO2 program keeping in mind that, given a linear relationship, the intercept of the linear fit is indicative of the average net δ13C of incremental atmospheric CO2.
This plot shows both the seasonal cycle and long term trend. We are clearly dealing with (at least) two distinct trends. As such, we should not attempt to fit a linear relationship to the underlying data points. We can, however, highlight the approximate value of the two major trends. The red and green lines drawn over the data are not curve fits, but they are indicative of the true value, which shows that the annual cycle reflects a δ13C of about -26‰, consistent with it primarily reflecting the terrestrial biosphere, whereas the longer term trend reflects a δ13C of incremental atmospheric CO2 of about -13‰, much higher than variations in the biosphere or for fossil fuels (circa -28‰ according to NOAA).
The second plot is with the seasonal cycle removed (removed by Scripps). This provides a strong linear relationship reflecting the long term growth in atmospheric CO2 with an intercept of -13.4‰ and an R squared of 0.98.
According to my analyses, the equivalent values for two other observatories are:
Point Barrow: -13.2‰ and an R squared of 0.96.
South Pole: -13.0‰ and an R squared of 0.99.
Part 2:
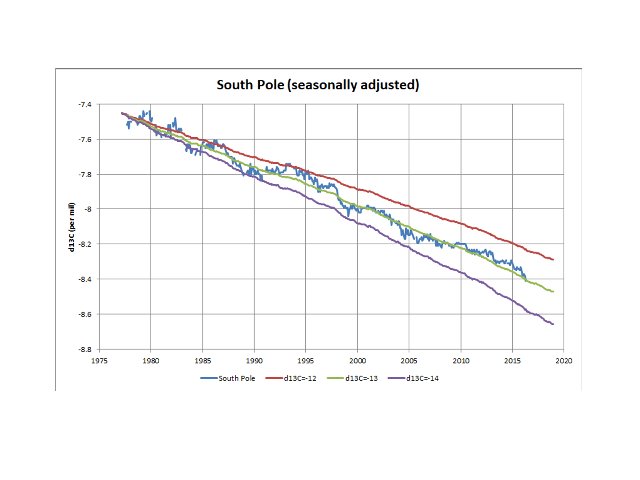
Finally, here is a plot of atmospheric δ13C with time, also highlighting what the trend would look like if the incremental CO2 had a consistent δ13C of -12‰ or -14‰. This confirms the longer term trend (beyond fluctuations due to ENSO variations and Pinatubo). See, in particular, the rapid drop in δ13C associated with the 1997-1998 El Niño and the ‘flat’ trend immediately following this, associated with the subsequent La Niña event.
Note that the measurements at the South Pole (since about 1977) provide almost exactly the same net δ13C for the incremental atmospheric CO2 as the Law Dome data show (since about 1750). The implications of this observation are potentially very significant. It strongly implies a single source (or a constant relationship between multiple sources, which must be highly unlikely) for all the incremental atmospheric CO2 since circa 1750, but a source that is also directly affected by ENSO changes and major eruptions. Models that are based on, or reflect, significant changes in source/sink relationships over time beyond the short term variations that reflect ENSO/Pinatubo need to be reconsidered in the light of this information.
Ferdinand Engelbeen often shows the following plot and has stated elsewhere (at Climate Etc.):
“And that humans are the main cause of the CO2 increase can be seen in the fast drop of the 13C/12C ratio in both atmosphere (ice cores, firn, direct measurements) and ocean surface waters (coralline sponges):
http://www.ferdinand-engelbeen.be/klimaat/klim_img/sponges.jpg”
No, this plot provides no direct proof of humans being the “main cause” based on the “fast” drop in the 13C/12C ratio. What this plot shows is further evidence for a single source of additional atmospheric CO2 since about 1750 with an average net δ13C value of -13‰, a much higher 13C/12C ratio than the value estimated for fossil fuels at around -28‰. The scale of atmospheric δ13C (far left scale) is linear, whereas atmospheric CO2 (right hand scale) is expressed as the reciprocal. The excellent alignment of the trend in δ13C with the trend in 1/CO2 is entirely consistent with a constant net δ13C based on the same mass balance principles on which the Keeling plot is based. We can even determine that value directly from the plot by comparing scales.
(-7.57*345 + 6.48*286)/(345-286) = -12.9‰
CO2 values of 345 and 286 ppmv are derived from the reciprocals of 0.0029 and 0.0035 respectively and the equivalent δ13C values of -7.57 per mil and -6.48 per mil are those on the far left scale that align with these reciprocal points; the calculation itself is based on the 13C mass balance.
So, I repeat, “Models that are based on, or reflect, significant changes in source/sink relationships over time beyond the short term variations that reflect ENSO/Pinatubo need to be reconsidered in the light of this information”.
The plot linked in Ferdinand’s quote is not showing up so here is a version direct from the original paper:
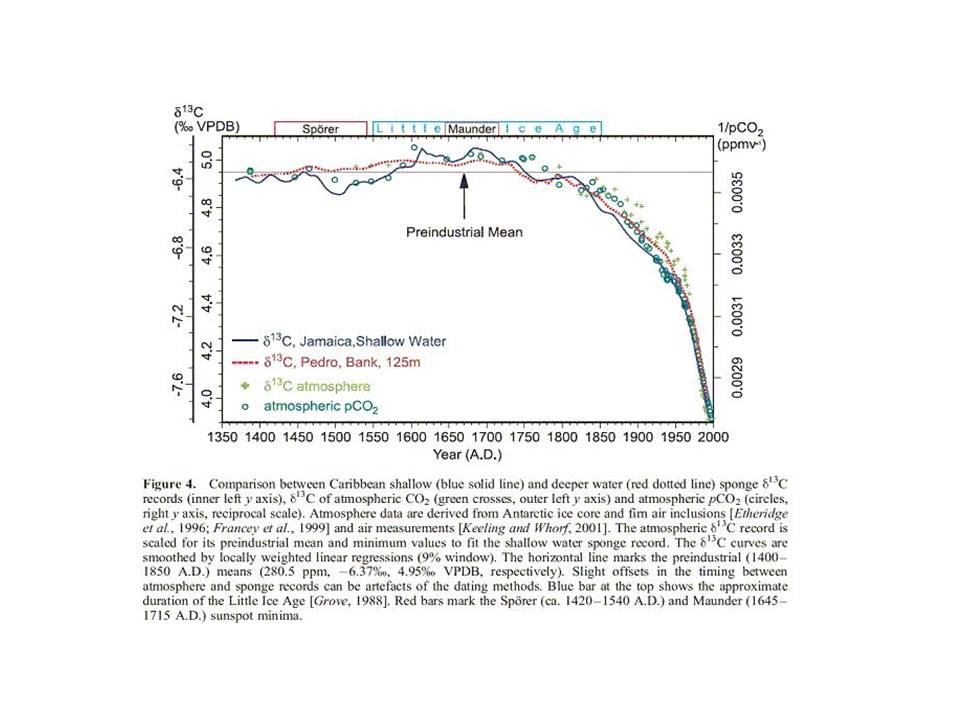
Over on Francis Menton’s Manhattan Contrarian blog, MC reader ‘g’ says this: “Let’s stop arguing and take sensible measures to stop climate change. Why are most deniers in other fields?”
Here is my response to MC reader ‘g’:
For purposes of discussion, let’s define ‘climate change’ as a steady increase in global mean temperature occurring on decadal time scales, whatever its causes might be.
The earth has been gradually warming for at least 150 years, possibly for as long as 300 years. More recent warming is happening at a bit faster rate, but not as fast as the climate models predict.
That said, if you are truly concerned about a steady rise in the earth’s global mean temperature over time, a reliable means for quickly stopping that steady rise in GMT lies in what is called solar geo-engineering through solar radiation modification (SRM).
Solar geo-engineering using SRM can quickly produce a 2C reduction in the earth’s global mean temperature by means of injecting 80 million tons of sulfur dioxide annually into the stratosphere.
SRM as a remedy for climate change is easily done in comparison with the time and cost of Net Zero, but only at considerable risk from unintended environmental consequences.
OK ‘g’ and all others who say we should just get on with it. If you are truly concerned about the steady rise in the earth’s global mean temperature, whatever its causes, then you will support using solar geo-engineering through SRM as a quick and effective remedy, regardless of any unintended collateral damage it might cause.
The failed tropospheric hotspot prediction of all climate models show that dangerous water amplification is not taking place. This failed prediction disproves AGW.
“. . . dangerous water amplification is not taking place.”
Pan evaporation is decreasing which also goes against the water amplification narrative.
What caused previous warnings MWP, RWP, etc. Where is the proof the same mechanism is not responsible today?
ferdberple;
A very good question!
The previous warmings were due to a very low incidence of volcanic eruptions, with the result that most of the time the atmosphere was free of dimming SO2 aerosol pollution, resulting in the incoming solar radiation striking the Earth’s surface with increased intensity, and thus causing . more warming.
For the RWP, VE!4 and higher eruptions averaged ~8/century, and the MWP ~11/century (for the 20th century, there were 78 eruptions).
And the SAME mechanism is occurring today, with decreasing SO2 aerosol levels in our atmosphere due to global “Clean Air” and Net-Zero efforts.
See: “Net Zero Catastrophe Beginning?”
https://doi.org/10.30574wjarr.2023.19.3.1996