From Dr. Roy Spencer’s Global Warming Blog
The Version 6 global average lower tropospheric temperature (LT) anomaly for June 2023 was +0.38 deg. C departure from the 1991-2020 mean. This is statistically unchanged from the May 2023 anomaly of +0.37 deg. C.

The linear warming trend since January, 1979 remains at +0.13 C/decade (+0.12 C/decade over the global-averaged oceans, and +0.18 C/decade over global-averaged land).
Various regional LT departures from the 30-year (1991-2020) average for the last 18 months are:
| YEAR | MO | GLOBE | NHEM. | SHEM. | TROPIC | USA48 | ARCTIC | AUST |
| 2022 | Jan | +0.03 | +0.06 | -0.00 | -0.23 | -0.12 | +0.68 | +0.10 |
| 2022 | Feb | -0.00 | +0.01 | -0.01 | -0.24 | -0.04 | -0.30 | -0.50 |
| 2022 | Mar | +0.15 | +0.28 | +0.03 | -0.07 | +0.22 | +0.74 | +0.02 |
| 2022 | Apr | +0.27 | +0.35 | +0.18 | -0.04 | -0.25 | +0.45 | +0.61 |
| 2022 | May | +0.17 | +0.25 | +0.10 | +0.01 | +0.60 | +0.23 | +0.20 |
| 2022 | Jun | +0.06 | +0.08 | +0.05 | -0.36 | +0.46 | +0.33 | +0.11 |
| 2022 | Jul | +0.36 | +0.37 | +0.35 | +0.13 | +0.84 | +0.56 | +0.65 |
| 2022 | Aug | +0.28 | +0.32 | +0.24 | -0.03 | +0.60 | +0.50 | -0.00 |
| 2022 | Sep | +0.24 | +0.43 | +0.06 | +0.03 | +0.88 | +0.69 | -0.28 |
| 2022 | Oct | +0.32 | +0.43 | +0.21 | +0.04 | +0.16 | +0.93 | +0.04 |
| 2022 | Nov | +0.17 | +0.21 | +0.13 | -0.16 | -0.51 | +0.51 | -0.56 |
| 2022 | Dec | +0.05 | +0.13 | -0.03 | -0.35 | -0.21 | +0.80 | -0.38 |
| 2023 | Jan | -0.04 | +0.05 | -0.14 | -0.38 | +0.12 | -0.12 | -0.50 |
| 2023 | Feb | +0.08 | +0.17 | 0.00 | -0.11 | +0.68 | -0.24 | -0.12 |
| 2023 | Mar | +0.20 | +0.24 | +0.16 | -0.13 | -1.44 | +0.17 | +0.40 |
| 2023 | Apr | +0.18 | +0.11 | +0.25 | -0.03 | -0.38 | +0.53 | +0.21 |
| 2023 | May | +0.37 | +0.30 | +0.44 | +0.39 | +0.57 | +0.66 | -0.09 |
| 2023 | June | +0.38 | +0.47 | +0.29 | +0.55 | -0.36 | +0.45 | +0.06 |
The full UAH Global Temperature Report, along with the LT global gridpoint anomaly image for June, 2023 should be available within the next several days here.
The global and regional monthly anomalies for the various atmospheric layers we monitor should be available in the next few days at the following locations:
Lower Troposphere:
http://vortex.nsstc.uah.edu/data/msu/v6.0/tlt/uahncdc_lt_6.0.txt
Mid-Troposphere:
http://vortex.nsstc.uah.edu/data/msu/v6.0/tmt/uahncdc_mt_6.0.txt
Tropopause:
http://vortex.nsstc.uah.edu/data/msu/v6.0/ttp/uahncdc_tp_6.0.txt
Lower Stratosphere:
http://vortex.nsstc.uah.edu/data/msu/v6.0/tls/uahncdc_ls_6.0.txt
It’s cooling where I live.
The January through June data trend agrees.
Makes you wonder what the surface stations, mostly located within UHI’s, are actually measuring doesn’t it? Curious.
Yup. Cooling trend since February 2016. The strong El Niño of 2020 didn’t break it and the current one is also unlikely to do so.
Agree- especially since the PDO (Pacific Decadal Oscillation) continues to cool.
For this to be the warmest year in the UAH record, the next six months will have to average an anomaly of 0.59 C.
The record is 0.39 in 2016. Unadjusted for the new baseline, the 2/16 anomaly was 0.83 C, hottest month in UAH data.
Then it must be cooling everywhere…
Why?
Because it’s cooling where Scissor happens to live, and that’s all that counts in Scissor-land. It’s the old ‘look out your window – that’s all there is’ mentality.
Very stupid; very resistant to change.
“Very stupid; very resistant to change.”
FN lives in a house of mirrors… very introspective of him.
Has been brain-washed with the quaint anti-science of the AGW agenda.. and cannot see anything outside it.
You are a proponent of broadcasting propaganda.
A global average lumps everything into one amorphous ball. It is neither a measurement nor a description of anywhere one earth. It leads to the prediction that everywhere is warming as touted in the press.
The “global” temperature that is usually discussed isn’t even a real temperature, although CAGW adherents treat the GAT as if it is one.
It is supposedly the statistical mean of growth in temperature. What does a mean mean? That half is above and half is below, assuming the distribution is normal. It is not only reasonable but a mathematical certainty that some are cooling and some are warming.
I’ll bet you can’t look up and quote here the statistical parameters of standard deviation, skewness, and kurtosis of the GAT distribution that would let people guage the distribution!
Lastly, look at the graph. How do you think the anomaly sinks back to the baseline after a warming month? COOLING you dummy! Don’t be a trendologistwho can’t interpret data correctly.
Yes, it has been since the 2016 El Nino.
It’s always cool where I live.
It’s the hottest…. evah
Even though it’s barely managed above 20C
Catastrophic 2 day heat wave on the way. Prepare. You might want to look for a short sleeve shirt.
We live in hope…
The winter woollies are still on stand-by – they haven’t been put away.
Ooooooh, No. Can’t do that. Must stay inside.
Incidentally, it makes me laugh every time I hear of a climate loony claiming the Sun has nothing to do with climate change. “It’s all man’s fault”.
In which case why is Bill Gates wanting to put a giant solar shade in space to shelter the planet from the Sun?
Because Bill could – if he were allowed…
Be a nice little earner that – put up a massive sunscreen then get paid to roll it back on request! Dr. Evil would be proud!
Acthually, that is the problem as I see it. I think it is called unanticipated problems. Does anyone trust climate scientists to calculate the right amount of “stuff” to put us in a “Goldilocks” temperature without going overboard? The other problem is that we can expect both cooler summers and colder winters. Not a good prognosis for the food supply is it?
By Pete, if CO2 won’tcooperate and cause mass starvation then we (the government) will do it!
We really live in an insane world where the fanatics trying to save the world want to block the Sun by filling the sky with SO2 pollution and rip up rural areas to put up flimsy turbines and panels, and cover the landscape in electrical cables and towers.
We’re in a heat wave here in Woke-achusetts. I don’t mind- they haven’t yet taken away my air conditioners yet. If they try, they’ll have to break my hands to get them off these wonderful machines. 🙂
Freons have been banned. Now they’re coming after hydrofluorochloro compounds. You’re alright as long as your AC doesn’t develop a leak or need a new compressor.
Wait for it: yesterday CNN placed our planet on Thermal Armageddon Death Spiral notice because of the “hottest day ever recorded”. Oops. Turns out they meant records only from 1979 and from some questionable source. Never mind.
Doesn’t matter, this is enough info for the propaganda machine to run with.
It is. The Wimbledon orange moron’s were quoting it as they were led away in handcuffs. They don’t really care – they got a good ‘appearance fee’ anyway.
Yep. Broadcast everywhere by the parrots.
It spreads fast. One of my local tv channels just mentioned the “hottest day evah!” propaganda on their weathercast. They did mention that the number was derived from computer models. So I’ll give them one for that, and the Chief Meterologist chimed in and said the climate always changes, and it’s cyclical !, and to not get too worked up about it. The Chief got it right, so that saves me the trouble of writing a nasty weather-related letter to my local tv station. 🙂
Wow, there’s still hope left in this world! Please let us know if the Chief Meteorologist mysteriously disappears or other suspicious activity.
RON, You mean this one
https://www.cnn.com/2023/07/05/world/hottest-day-world-climate-el-nino-intl/index.html
which is completely different than the information actually gathered DAILY from tens of thousands of weather stations and published here on WUWT AS WELL.
https://temperature.global/
CNN is lathering at the mouth and soiling its collective self at a mere 1°C difference between now and 1979 – in spite of all the development (cities full of concrete and asphalt) and ~30% more CO2 and an emerging El Nino.
There certainly seems to be a correlation between the switch to windmills starting around 1991 and the (relatively minor) warming since then, there seems like a secondary rise around 2008 when Teslas started shipping – any self respecting climate scientist should be jumping on this and demanding that we act now …… /sarc
Shytor, you don’t need the sarc tag, your comment is as good as any of the CAGW theories.
Or the theory that the clean air regs have cleared the skies of SO2 and other real pollutants and so the Sun can better heat the Earth.
so why are all the US papers screaming that June was the hottest month ever in the history of the world
The papers you reference are propaganda outfits whose goal is to push the approved narrative, facts and truth be damned.
Lying with statistics 1:01 Module A: Averaging
Max temp = 30 Min temp = 0, Average = 15
Max temp = 29.9 Min temp = 0.2, Average = 15.1
here’s a game for you. check the weather forecast for any city in the US using wunderground. If the current temp seems abnormally high try clicking “change station” to bring up a list of alternate temp readings. In my experience they always pick the highest reading, sometime with farcical results, such as the whole winter one year giving 99F as the temp because a station had broken.
Story tip?
Bjorn Lomborg returns to The Brendan O’Neill Show to discuss his latest book, Best Things First. Bjorn and Brendan discuss the simple, smart and radical ways we can transform the developing world – and the Western fads that are holding the world’s poorest back.
https://www.spiked-online.com/podcast-episode/how-to-win-the-war-on-poverty/
Using the Manabe type hypothesis, the lower troposphere average temperature should be increasing at the same rate as the near surface.
So, something is going horribly wrong.
Manabe depicted the shifted temperature profile of CO2 doubling to be in parallel with initial profile. That’s how this is all supposed to work.
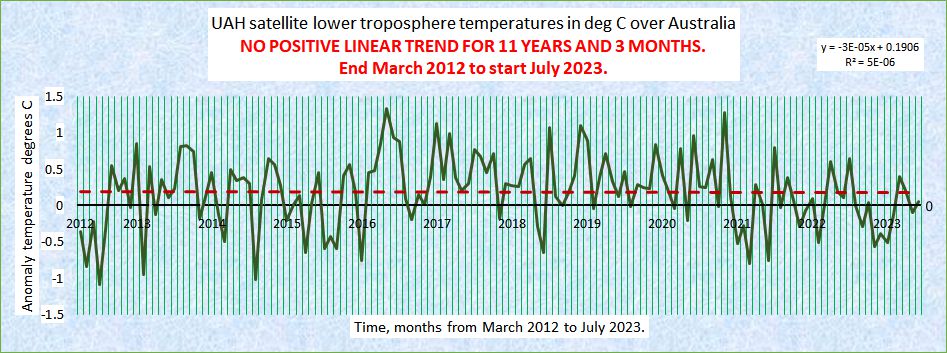
Over Australia the “pause” Monckton style lengthened by 2 months to 11 years and 3 months.
One wonders why so little of this pattern is discussed by those promoting global warming. They seem to think that the CO2 causes global warming but that the pause happens when natural factors decrease it.
Which natural factors might that be?
Australian temperatures are a big part of southern hemisphere data. Why do they have such a different pattern to the rest of the world? We are told that the well-mixed gas CO2 exerts a pervasive, global, steadily increasing effect on temperatures. Does it? Geoff S
Blokes in Australia have been working harder to reduce climate change and it is obviously working. Put another shrimp on your banned barbies to cool them off.
Sherro01:
Thanks for the graph!
Is there a site where I can find graphs like that for different countries or world regions?
Zip,
The idea is to make them yourself. If you do not know how to get the data and make the graph, maybe you should not get too involved with the topic. Geoff S
Only Australia and the USA are country-specific in UAH.
nsstc.uah.edu/data/msu/v6.0/tlt/uahncdc_lt_6.0.txt
bnice,
I amtold that one goes to KNMI explorer and selects an area.
Not tried it, just sayin’.
Geoff S
Over the entire UAH record 1978 – 2020 the planet definitely warmed but not uniformly and the increasing CO2 concentration must have been one factor amongst others known and unknown.
The trend over a relatively short period for a relatively limited geographic area doesn’t mean much.
”increasing CO2 concentration
mustmay have been one factor”There is no evidence that CO2 could be part of the slight but highly beneficial warming.
Chris,
The Australian data are a big part of southern hemi temperatures used in global reconstructions. Much if the SH is water with no/few observations, so extrapolation and infilling is widely used for gloibal land+ocean guesswork. The contribution from Aussie data is then rather larger in effective area than just its land mass. Geoff S
Story Tip: Nation Wide Insurance no longer writing new auto and property casualty insurance. Premium to claims ratio 2nd worse in industry. Partially blaming “ climate change” and (a) hurricane . Hmmm I wonder if having so many urban areas and cars burned to the ground by wokesters had anything to do with it. Might warrant some research.
I also find this disturbing in that Insurance companies are suppose to be a bastion of financial stability ( annuities parts of retirement portfolios etc)
This is funny…
Now scientists say climate change is making us BLIND
Climate change may be speeding up the rate of blindness, a study suggests.
https://www.dailymail.co.uk/health/article-12271005/Now-scientists-say-climate-change-making-BLIND.html
They’re confused. I bet they have hairy knuckles.
I bet the Guardian brings out a braille edition soon!
Don’t worry. I’ll only drive my SUV until I need glasses.
Ooooh! Great one.
Al Gore wrote of UV causing blind rabbits and fish in Patagonia way back in 1985 or so, book Earth in the Balance. Geoff S
From the article…..
This is the quality of science at the moment.
Another quote….
”Over 50% of all published papers are complete and utter garbage”
And the reporter doesn’t bother to ask why more CO2/global bullshit would cause more UV to get through? And what about the banned CFCs, and all the spf sunglasses and the fact that people mostly huddle inside airconditioned places their grandparents would have died for? How does that lead to more UV exposure?
All the hype about the ‘hottest day on record’ is undoubtedly based on faulty thermometers. Some goes for all of these records being broken around the world. The surface temperature records should not be used; they’re completely useless.
How reliable is the data shown at https://climatereanalyzer.org/clim/t2_daily/ ? They’re claiming that this year’s average global temperature is the highest ever. Of course, the site doesn’t mention why the year is hotter (like do to Nino/Nina, etc). I don’t know if this is worth as a “story tip”, but your site does a great job of debunking climate hysteria.
Last year and 2021 were La Niña years. This year is El Niño, with warmer than average water off Peru and Ecuador.
UHI, bad sites and Leftist ideologues with their fingers on the adjustment scales. They still haven’t gotten their grasping fingers around radiosondes, UAH6 and, now, NOAA STAR so they just ignore them. The alarmists’ contortions to explain the trend difference is getting desperate. And don’t dare mention to them the UN IPCC CliSciFi climate models’ tropospheric Hot Spots.
This is likely to be a strong El Niño, a big release of heat in the store-and-release cycle.
https://www.cpc.ncep.noaa.gov/products/analysis_monitoring/lanina/enso_evolution-status-fcsts-web.ppt
Eventually we’ll breach the warmest-ever-since-the-LIA point. For real.
Prepare for more – much more – warmest hysteria. Lots of warmest-ever stories. Wall-to-Wall. 24-7.
The Left dominates the major institutions in America – public, ngo, and many mega-corps. They only lack sufficient public support to implement their massive plans. They hope this hysteria will give them what they need.
Much depends on how this plays out.
Second warmest June in the UAH record and not even fully into El Nino conditions yet. Even then, UAH typically has a 3-5 month lag on temps.
The game’s over guys and you lost. Reality has prevailed, as it is wont to do.
What did you win?
The argument.
TFN,
Arguments need two parties with different views and a platform to debate them. When was the last serious debate that you heard and who won it? Geoff S
Well, it’s a long time since I heard a serious argument from people who say it’s not warming. Used to happen all the time here at WUWT. Not any more.
Nowadays it’s silly excuses to explain ‘why’ it’s warming, with ‘anything but CO2’ high on the agenda.
Of course it’s CO2. Open your eyes.
Your IPCC says –
Why don’t you present your conjectures here TFN?
https://www.ipcc.ch/site/assets/uploads/2018/03/TAR-14.pdf
“Of course it’s CO2.”
In your feeble brain-washed mind only.
Did you know there is no evidence at all of CO2 warming in the UAH atmospheric data.
Every time you have shown a trend, it is because of El Nino event.. so nothing to do with CO2.
Your evidence is totally lacking of any scientific validity whatsoever.
a serious argument”
Well if you will walk around with your fingers in your ears, and a blindfold on.
El Nino warming only.
No evidence of CO2 warming.
It is a long time since you presented a serious argument otherwise.. in fact.. NEVER.
“it’s not warming”
WOW, you nearly got part of your sentence correct… an accident ?
No, it is currently COOLING
It was not warming from 2001-2015, and not warming much if any from 1980 -1997.
TFN,
Look, I just posted a graph showing no UAH warming over Oz for the last135 months, so I guess that puts me in the class of a person arguing that there is no warming. Sort of.
A year ago WUWT published my 3 part article on Uncertainty in temperature measurement. That had a series of debates about what one can infer from customary temperature measurements. Then, the other day, Pat Frank gave us more T uncertainty studies, to which I wrote that I agreed with him.
https://www.mdpi.com/1424-8220/23/13/5976
Pat wrote, inter alia, that –
“LiG resolution limits, non-linearity, and sensor field calibrations yield GSATA mean ±2σ RMS uncertainties of, 1900–1945, ±1.7 °C; 1946–1980, ±2.1 °C; 1981–2004, ±2.0 °C; and 2005–2010, ±1.6 °C. Finally, the 20th century (1900–1999) GSATA, 0.74 ± 1.94 °C, does not convey any information about rate or magnitude of temperature change.”
That is a rather strong assertion, which is not in conflict with my own work on Australian measurements over the years since I started into a hard scientific analysis of global warming in 1992.
Your turn, TFN, what is your debate in response?
Geoff S.
You know what the response will be. Either nothing or a claim that all measurement uncertainty cancels, especially in the final anomaly calculation.
No one denies warming. However, the amount is debatable and the cause has never been satisfactorily explained.
So no prize then?
No. Nobody wins.
You are certainly always a loser.
“The game’s over guys”
Jumping the gun a little bit, aren’t you?
If you are of the view that the observed warming trend is just part of a natural cycle then, statistically (even with the notoriously cool UAH), you may be on thin ice… so to speak.
In my view, it’s too much warming in too little time to be a coincidence. Something is up.
I agree with you, FN – something is most definitely up. What we disagree on is what that something is – you look at the temperature record and think something must be driving it, I look at the same temperature record and think someone must be adjusting it. Even you must admit that using contaminated sites, arbitrary adjustments and changes to historical data is absolutely not best practice for scientists?
“EVEN YOU MUST ADMIT THAT USING CONTAMINATED SITES, ARBITRARY ADJUSTMENTS AND CHANGES TO HISTORICAL DATA IS ABSOLUTELY NOT BEST PRACTICE FOR SCIENTISTS.”
Well said!
“it’s too much warming “
LOL, FN is scared of a measly degree or so of warming. PANIC, PANIC !!!
Warming he wouldn’t even know existed if not for urban and airport thermometers.
Current global temperature is still way below most of the last 10,000 years.
LIA was the coldest period in those 10,000 years..
Thank goodness for that tiny amount of warming. !
The problem is all in your chicken-little mind! That’s what’s up.
Only fools are certain about a scientific matter.
“If you thought that science was certain – well, that is just an error on your part.”
― Richard P. Feynman
Thanks for cementing your reputation as fool. And no, there is no way back from here. You will ever thus be regarded.
To be regarded as a fool by commenters on a WUWT message board is truly a compliment.
Thank you.
Regarding Richard Feynman,, give your brain a wash here.
Yes, we are well aware you like being the fool. ! (as if you had any choice, anyway)
The village idiot contest will be yours next time… keep trying. !
So I take it you disagree with the quote above?
To be regarded as a fool by commenters on a WUWT message board is truly a compliment.
Oh, the wit is just breathtaking!
Science is the belief in the ignorance of experts.
Since then I never pay attention to anything by “experts”. I calculate everything myself.
Have no respect whatsoever for authority; forget who said it and instead look what he starts with, where he ends up, and ask yourself, “Is it reasonable?”
We’ve learned from experience that the truth will come out. Other experimenters will repeat your experiment and find out whether you were wrong or right. Nature’s phenomena will agree or they’ll disagree with your theory.
“The exception tests the rule”, or, put another way, “The exception proves that the rule is wrong.”
That is the principle of science. If there is an exception to any rule, and if it can be proved by observation, that rule is wrong.
It is not unscientific to make a guess, although many people who are not in science think it is.
The thing that doesn’t fit is the thing that is most interesting.
– – – – –
Religion is a culture of faith; science is a culture of doubt.
Our freedom to doubt was born out of a struggle against authority in the early days of science. It was a very deep and strong struggle: permit us to question — to doubt — to not be sure. I think that it is important that we do not forget this struggle and thus perhaps lose what we have gained.
I can live with doubt, and uncertainty, and not knowing. I think it’s much more interesting to live not knowing, than to have answers which might be wrong. … I don’t feel frightened by not knowing things, by being lost in the mysterious universe without having any purpose — which is the way it really is, as far as I can tell. Possibly. It doesn’t frighten me.
– – – – –
I would rather have questions that cannot be answered than answers which cannot be questioned.
You have no responsibility to live up to what other people think you ought to accomplish.
I’m smart enough to know that I’m dumb.
There is a computer disease that anybody who works with computers knows about. It’s a very serious disease and it interferes completely with the work. The trouble with computers is that you ‘play’ with them !
Man you just dug your own grave. I took a screenshot of your comment. In February, we’ll see who has the ‘last laugh.’
I tremble with anticipation,,,
Well, trembling anyway, in abject fear of a degree or so of highly beneficial warming
Chicken-Little lives, in the guise of a Final Nail.
Chicken-Little was essentially witless, too!
The problem is that the catastrophe is always ten years in the future. Food shortages, mass migration, flooded coastal cities, widespread species extinction — it’s always going to happen ten years from now. And “now” keeps moving forward. While CO2 keeps going up. It’s like fellow on the corner predicting the world is going to end tomorrow – he’ll be there tomorrow predicting the very same thing!
OK, but don’t rest on your laurels. Please keep visiting us and parroting the inane garbage you get from the grauniad, you provide a useful service for new visitors as they learn that it’s easy to refute with actual evidence.
Probably been here longer than you, so…
“Probably been here longer than you, so…”
And yet you have learned nothing.
LOL, FN is scared s**tless about an anomaly of 0.38ºC…
In a series starting in 1979, the coldest period since the 1930/40s highs (which were similar to now in unadjusted data)
Very funny !
Hope his air-conditioner is graduated in 0.01C units 😉
Sadly, in Ireland//UK our houses were built without air conditioning, even though we now obviously need it.
This June we had to rely on open windows and strategically placed fans.
Oh no.. FN is a “true victim” as well.. so funny !
Ultra-leftist ideology.
You only need it because you have become so weak-minded.
Good, considering in most places about 7-10 times more people die from cold than heat. Hopefully things will keep warming up to the levels of millennia ago and the world restored to a lush green paradise. All that extra CO2 will come in handy.
FN – in all seriousness, if you think you need aircon in this weather then open several windows then point your fan directly at one of those windows. It sounds a bit crazy, but it works. I bought a fan about 10 years ago (haven’t needed it much since) and quickly learned this trick.
And just a few months earlier we had to rely on (reliable) gas central heating to keep us alive during the extended (very) cold spells.
I obviously didn’t need air con then although I did feel the con element in paying inflated energy bills due to mismanagement, delusion and fraud in the energy supply and planning process.
In the words of Jpourney – “don’t stop believin” ….. faith is all that the greens have!
According to all these graphs of the Earth’s hottest day in June, the temperature of the entire planet should go down about 4 degrees by the time we get to Jan. 2024.
That happens every year. The graph says the climate mean is 16.21 in July and 12.41 in January, when we are closer to the Sun.
What mechanism causes the temperature of the entire Earth to go up or down by 4 degrees each and every year?
And if we can survive the Earth’s temperature rising by almost 4 degrees every 6 months, can we survive the temperature rising by 3 degrees in a century?
The Final Nail,
Need your help. In this poem, Logic is correct. Devilish hard to get good scanning and rhyme.
Any suggestions? Geoff S
….
CROSS LOGIC.
If you wish to protest spectacularly,
Self-crucifixion is certain to fail.
There’s no known way, not practically,
To hammer the final nail.
Beautiful, just perfect!
0.1 C a decade, nice linear increase, no +ve feedbacks, no amplification.