Guest Post by Willis Eschenbach
After an unusual three years in a row of La Nina (cool) ocean temperatures, alarmists are all in a lather about the sea temperatures as we approach El Nino conditions. We get claims like this:
Global oceans are so hot right now, scientists all around the world are struggling to explain the phenomenon. Sea surface temperatures in June are so far above record territory it is being deemed almost statistically impossible in a climate without global heating.
These overwrought claims are generally accompanied by charts like this:

Figure 1. Title says it all.
YIKES! Thermageddon is just around the corner! Be very afraid!! …
So … what’s not to like? Well, for starters, they’ve omitted the colder areas of the ocean, those near the poles. That’s cherry-picking to exaggerate any warming. But that’s just the start.
Those who read my work know I don’t generally trust the numbers until I run them myself. So I went to their data source. The data they used is the NOAA Optimum Interpolation Sea Surface Temperature (OISST) data. From the OISST website:
“The NOAA 1/4° Daily Optimum Interpolation Sea Surface Temperature (OISST) is a long term Climate Data Record that incorporates observations from different platforms (satellites, ships, buoys and Argo floats) into a regular global grid. The dataset is interpolated to fill gaps on the grid and create a spatially complete map of sea surface temperature. Satellite and ship observations are referenced to buoys to compensate for platform differences and sensor biases.”
Downloading the data took a while. It’s in 15,259 files, one for each day, each one 1.7 megabytes, total of about 26 gigabytes… good fun.
After downloading it all, I graphed up the daily values. But not the anomaly values shown above. I graphed the actual daily values of the sea surface temperature (SST) of the entire ocean, so I could see what the SST is actually doing.

Figure 2. OISST sea surface temperatures (SST) for the global ocean.
There are a few things worth noting in Figure 2.
- You can see the peaks of the previous El Ninos in 1998-99, 2010-11, 2016-17, and the currently developing El Nino.
- As is common with natural datasets, it changes in fits and starts, warming for a while, then cooling, then warming a bit more, then cooling …
- You can see the recent cool La Nina years just before the 2023 peak
- The temperature peak occurred on April 2nd, 2023, and the temperature has dropped about a quarter of a degree since then.
Finally, is this “far above record territory” as folks are claiming?
Well … in a word, no. The April 2nd temperature is 0.04°C warmer than the previous record set back in 2016.
Four. Hundredths. Of. A. Degree.
(And if we only look at the cherry-picked ocean from 60°N to 60° south [not shown], it’s a whopping 0.06°C …)
To put this into perspective, as everyone who has climbed a mountain knows, as you go up in elevation, the air gets cooler. This cooling goes by the fancy name of the “adiabatic lapse rate”. In general, it cools about 1°C for every 100 meters in altitude.
So in human terms, 0.04°C is about as much warming you’d get by going from the second floor to the first floor in a building … in other words, not even detectable without a very expensive thermometer.
Of course, the question arises: why is there such a difference between Figures 1 and 2?
The reason is simple. The warming in 2023 is occurring earlier in the year. The temperature is not unusually high. It’s unusually early, which is not surprising since we’re coming off of a few years of La Nina (cool) temperatures.
And this is why using anomalies rather than actual values, while useful in some situations, can lead you far astray in other situations.
Moving on, much of the hyperventilation involves the North Atlantic. Here are the SST anomalies for that part of the ocean.

Figure 3. As in Figure 1, but just for the North Atlantic.
Again, this looks like impending Thermageddon … but here are the actual temperatures of the North Atlantic.

Figure 4. OISST sea surface temperatures (SST) for the North Atlantic.
Unlike the global ocean, because this is the northern hemisphere only, there is a strong annual signal.
And again, there’s nothing out of the ordinary regarding maximum temperatures. In fact, maximum North Atlantic temperatures have been pretty steady since 2010. All that’s happening is that, like the global ocean, this year it’s warming earlier than usual.
TL;DR version?
- The 2023 Thermageddon Festival is canceled, and there will be no ticket refunds.
Best to all on yet another cold, foggy Northern California day. Me, I say bring on the global warming, or at least some dang sunshine.
w.
As Usual: I politely request that when you comment you quote the exact words you are discussing. I choose my words very carefully, and I am happy to defend them. But I cannot defend your interpretation of my words. Thanks.
Discover more from Watts Up With That?
Subscribe to get the latest posts sent to your email.
Willis, thanks for evaluating the data. Here’s the UAH air temperatures above oceans only for comparison. From Ron Clutz.
Ref: “This cooling goes by the fancy name of the “adiabatic lapse rate”. In general, it cools about 1°C for every 100 meters in altitude.”
My comment: You reference the lapse rate for dry air. My recollection from my flying days is that the standard atmosphere lapse rate is 2degC per thousand feet from sea level to about 35,000 feet. That equates to about 1degC per 500 feet. You are using about 1degC per 328 feet. The difference is the moisture content in the real atmosphere. Not a huge issue but a real (easily measurable) difference. I recognize using the dry air lapse rate gives the alarmist the most benefit of the doubt. A standard atmosphere reduces the temperature difference by about 50% over an elevation change below 35,000ft when compared to a dry atmosphere.
Still is a nice article. I appreciate the work you put into this field.
Bob, the term “dry” adiabatic lapse rate does not mean that the air is dry.
It simply means that the moisture in the air is not condensing. If it’s condensing, that’s called the “wet” adiabatic lapse rate.
What you are describing is the “environmental” lapse rate, which allows for the fact that there are likely to be clouds in the mix, so the result is somewhere between the dry and the wet lapse rates. It’s the most reasonable assumption for things like flying.
Since there are no clouds in the mix when I walk down a flight of stairs, the appropriate lapse rate is the dry lapse rate.
My best to you,
w.
My concept of El Niño has more to do with the release of the Western Pacific Warm Pool and the weather effects that follow.
The emphasis on sea surface temperatures seems misleading because that surge of warm water moving eastward across the Central Pacific Ocean, and pushing other water around, will seem like elevator music when serious weather events happen. Folks should get ready for AC/DC.
A book by Madeleine Nash ” El Niño: Unlocking the Secrets of the Master weather-maker” tells of the weather events of the ’97-’98 season. She starts with a description of events in Rio Nido, CA. It is a good read.
She does get a few things mixed in that need not be there.
You have to wonder if these “scientists” ever stop to admit they know they are INTENTIONALLY misleading the public. And to do it time and again, without ever having any solid evidence that is realistic. They have to know 0.04C is a meaningless increase. You would think they would start to question if they are on the right side of this issue.
Willis:
I do not agree with you that there is nothing to worry about at this time!
In my article “The Definitive Cause of La Nina and El Nino Events” I found that ALL El Ninos (for the 72 year 1950-2022 period analyzed) coincided with a decrease in atmospheric SO2 aerosol levels
Four causes for the decreased SO2 aerosol levels were identified:
For (1), global Industrial activity is slowing down, reducing the number of SO2 aerosols in the air.
For (2), Net-Zero requires the abandonment of the burning of fossil fuels (which also produce SO2 aerosols), thus reducing their amount in the atmosphere.
For (4), SO2 aerosols from the underwater Tonga eruption of Dec 20, 2021, are just now beginning to settle out
Since 1900 (and probably always), all El Ninos have been ended by increased levels of SO2 aerosols in the atmosphere, primarily due to volcanic eruptions (2 were caused by increased industrial SO2 aerosol levels).
So, temperatures are rising because of decreased SO2 aerosol levels in the atmosphere, and there is nothing to stop them, barring another large volcanic eruption, which will take about a year to have a significant effect
It will not take long before it is obvious that recent temperature increases are abnormal. I believe that we should be VERY worried!
Burl, I’ve looked deeply into your claims that SO2 is the secret temperature control knob. I’ve not found the slightest evidence that it’s true.
And I’m not going to try to dispute that with you again. Your mind is made up, and from experience, I know there’s nothing I can say and no facts I can present that will make the slightest difference to your belief.
My best to you,
w.
SO2 is certainly a control knob. It’s just not the control knob.
bdgwx:
THE control knob being what?
In the final analysis, the intensity of the Sun’s rays striking the Earth’s surface is what determines our climate. This intensity is modulated by the amount of SO2 aerosols in our atmosphere.
Without them, temperatures rise to those of the earlier warm periods, when there were very few volcanic eruptions, and the atmosphere was normally free of SO2 aerosols.
There is no single control knob. A lot of agents modulate the planetary energy imbalance. There are even more that modulate the inflow and outflow of energy to/from the atmosphere.
Willis:
?? At this point I cannot recall any facts that you have ever presented that disprove what I have been saying.
Just that you have “looked deeply into my claims and found not the slightest evidence that it is true”. This in spite of the fact that the SO2 from VEI4 and > volcanic eruptions ALWAYS affect global temperatures, both cooling and warming them!
However, as I mentioned above, it should quickly be obvious that the current temperature increases are abnormal, certainly within this year, if I am correct.
Worst June for southern Ontario in as long as I can remember – where’s that little Spanish kid? We were told to expect him after living with his evil sister for the past few years, but he hasn’t shown his face.
I guess the wildfires, which I blame on environmentalists for blocking forestry and proper arborial management, have caused the sky to darken, hiding our friend in the sky. I hope all those silver spoon, trust fund enviro-nazis in the New York-ish area are enjoying the taste of their victories, taste and smell – literally.
North Atlantic is warming the most.
Strange as another parameter is at top in the north.
Fram ice export sets record this spring:
https://sites.google.com/view/arctic-sea-ice/home/fram
Is the current more active or has it taken a new path?
Well another dose of reality from the data meister! I’d like to add that these inconvenient facts then totally demolish the CO2 as control knob hysteria… Let me splain:
Oceans have 1,000 times higher heat capacity than does the atmosphere. Therefore if oceans have been heating up by 0.016 deg C per decade – this cannot be due to the effects of CO2. Thus for the air or components of the air (CO2) to have caused the oceans to heat up this much, the air would have had to contribute 16 deg C rise per decade on average to have “caused” this ocean heating.
Since this is provably false, it demolishes the CO2/warming/thermageddon nonsense.
It’s either the sun via less cloud cover, or geothermal emission into the oceans, or both.
Conversely, assuming the extra heat comes from solar or geothermal source – with Willis’ emergent thermal regulation theory this extra heat release to the air from the warmer oceans (which is 1,000 times* more heat capacity) should have raised the air temp by 16 deg C per decade and since this is not true, the self regulating system as in the emergent thermal regulation works rather well!
*(a 0.16 deg C/decade rise in ocean temps equates to the amount of heat which would heat the air by 16 deg C/decade at the 1,000x ratio of respective thermal capacities)
Or the data is garbage and has been routinely “adjusted” as in the US land data….that remains a plausible reality given how many other areas so called authority has been shown to be willing to fudge the numbers to support a narrative.
This article is about the sea surface temperature; not the bulk ocean temperature.
Thank you to Willis for his insightful post and his reminder of the importance of looking at measured temperatures, and not focussing solely on anomalies.
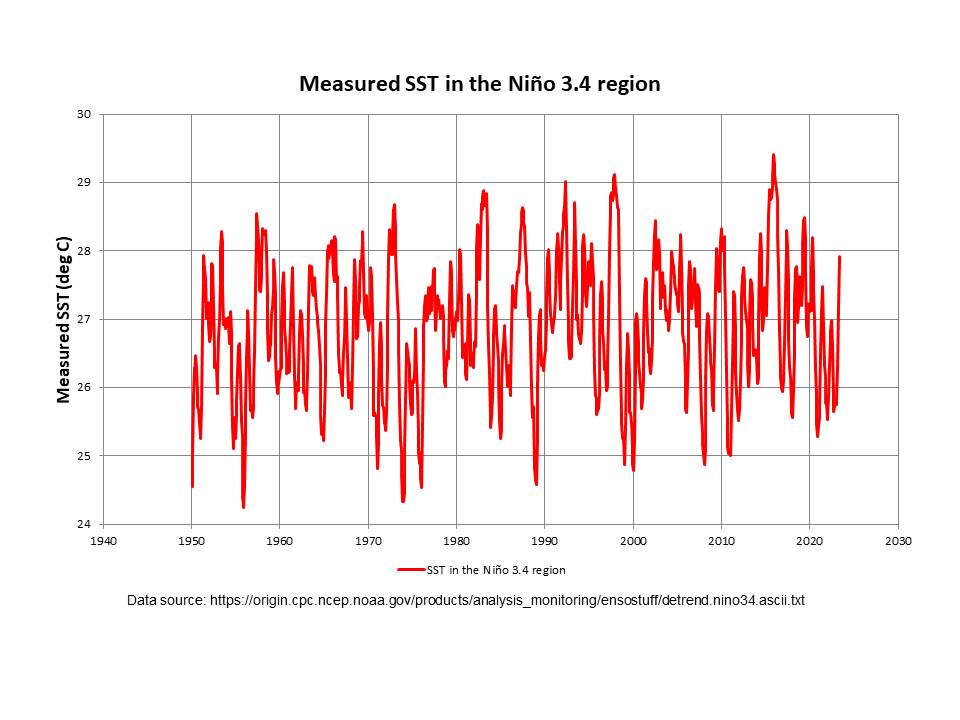

The Oceanic Niño Index (ONI) is one of the key indicators of variations in the El Niño – Southern Oscillation (ENSO). ONI is the rolling three month average of the sea surface temperature (SST) anomaly in the Niño-3.4 region in the equatorial Pacific Ocean. The SST in the Niño-3.4 region (measured, not the anomaly) has been increasing since 1950 (at least) and is shown in the plot below. The maximum range of SSTs is consistently about 4 degC at any particular period in time, but we see a gradual shift to higher temperatures. Both the warming peaks (El Niño) and the cooling troughs (La Niña) have reflected increased SSTs by about 1 degC which, over 70 years, equates to 0.14C/decade (very much in the same ballpark as UAH and Willis’ Figure 2).
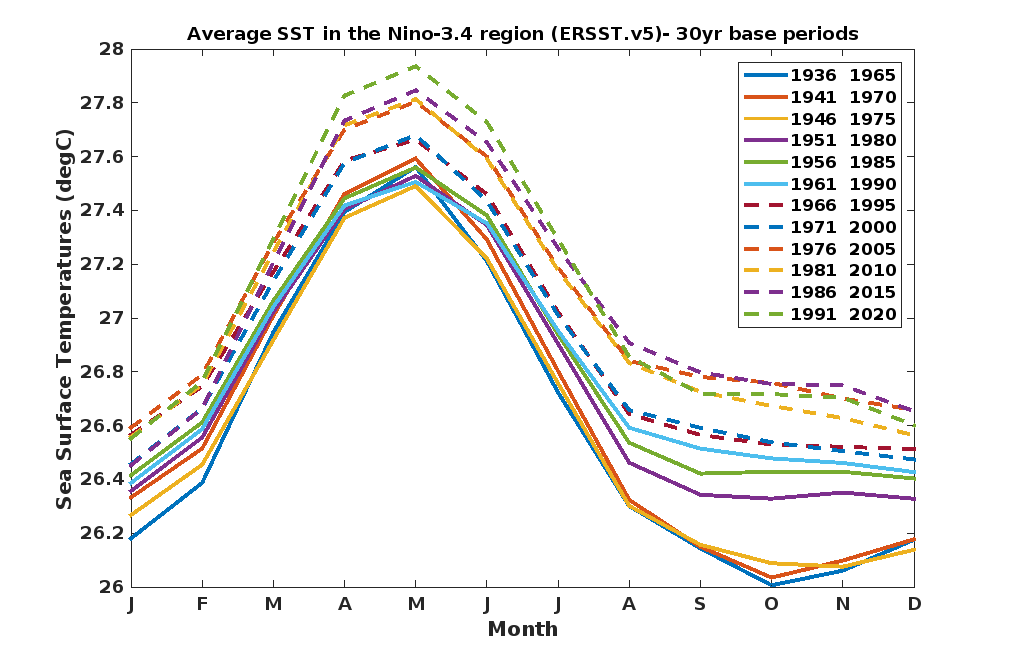
We know that peaks and troughs in the SST anomaly in the Niño-3.4 region are usually reflected in peaks and troughs in global atmospheric temperatures about 4 months later (except where global temperatures are cooled by major volcanic eruptions). Therefore, we would expect this longer term warming trend of the SSTs to also lead to a warming trend in global atmospheric temperatures. In terms of recent changes in SST in the Niño-3.4 region corresponding to ENSO events, there is a clear distinction between a ‘very strong’ El Niño event and all recent La Niña events (only ‘strong’ or lower). The following plot shows the variations in temperature together with the 30-year climatology used to compute anomalies (i.e. the difference between the red and blue lines).
What we see is that following a La Niña event, SSTs always reach their minimum value at, or very close to, the end of the year and always increase back up at least to the bottom of the range covered by the climatology by mid-year (strong La Niña events in 1998-99, 2000-01, 2007-08, 2010-11). In contrast, the two very strong El Niño events (1997-98 and 2015-16) and, to a lesser extent, one moderate El Niño (2009-10) show that the usual cooling part of the annual cycle is missing and the event extends from one warm part of the cycle to the next.
So far, nothing appears to be unusual or diagnostic in the rate of increase in SST in this region so far this year. See, for example, 2016-17 and 2017-18.
However, since 1979 the ENSO 3.4 region SST has actually cooled at a rate of -0.05 C/decade. This is interesting because the global SST has increased. This has the effect of attenuating El Nino and amplifying La Nina relative to the global background.
To address the deviation scientists have developed the RONI index. [Oldenborgh et al. 2021]
You previously stated (8 days ago) that “The trend since 1979 is -0.04 C/decade.” Now it’s -0.05 C/decade. New data? Whatever, I responded to you on that point (here), but I’ll provide a summary of my response here. If we were doing this same trend calculation in January 2020, it would have been positive, at +0.03 C/decade. Both estimates are invalid because of the effect of end-point selection on a highly variable parameter. The flip to an apparent negative trend is clearly the result of the recent La Niña events.
 .
.
More importantly, your statement about cooling is incorrect. The ONI data that you are using are actually based on increasing measured SSTs in the Niño-3.4 region as shown by the moving 30-year climatology. Here are the actual data:
Indeed, the paper that you reference (which does not include the graph shown or define “ONI global” also agrees with me: “The problem is that the observed Niño3.4 series has a clear trend …” and “… the warming trend since the industrial era has accelerated over the last 50 years”. However, the distinction is that, unlike the authors, I do not make the assumption that the observed warming of SSTs in the Niño-3.4 region is “due to global warming”. The evidence is that increasing SSTs in the Niño-3.4 region lead to an increase in global atmospheric temperatures (after about four months). They also lead to increased rates of growth in atmospheric CO2. The key question is whether or not increased levels of atmospheric CO2 can cause warming of SSTs. I hear plenty of arguments here at WUWT that say this is not possible and I am minded to agree.
Typo…it’s -0.04 C/decade.
ONI average 0.0 from 1979/01 to 2023/04. Yet the SST values cooled at a rate of -0.04 C/decade while the global SST values warmed at rate of +0.11 C/decade.
Yes. I know.
I made the graph. It is not the RONI value. As such you won’t find it in the publication I linked to. The RONI value compensates for the warming in the tropical band. My graph compensates for the warming globally.
It is not meant to agree or disagree. It is only an interesting topic worthy of discussion.
I’m not making that assumption either. I’m just pointing out that SSTs in the ENSO 3.4 region have cooled since 1979 simultaneously with warming of SSTs globally.
Yep. The opposite is true as well. When SSTs in ENSO 3.4 decrease it leads to a decrease global atmospheric temperatures after about four months. I assess the relationship at 0.13 C of UAH TLT change per 1 unit change in ONI.
Yep. The opposite is true as well. When SSTs in ENSO 3.4 decrease it leads to decreased rates of growth of atmospheric CO2.
Yes it can.
Anyway, the point of my post was not to challenge you. It was only to spur a discussion that there could be change in the typical global circulation response due to the relative magnitude of the ENSO against the global backdrop. This is the impetus behind adjusted indexes like RONI. Scientists have observed that global circulation response is not behaving the same way to ENSO cycles as it once did.
I agree that the hyperfocus on the anomalous el nino warmth is as misguided as the contrarian’s hyperfocus on every single la nina “pause.” The warming is steady and following projections, that is more than enough cause for concern.
Your attempts to downplay the amount of warming the oceans are experiencing by likening it to our everyday experience of climbing a set of stairs is nonsensical. No human can possibly experience the temperature of the entire ocean and the amount of energy required to raise the temperature of that body of water by that much is astounding.
Citation(s) please.
Citation(s), and some concrete numbers, please.
“Supporting evidence” please … lots and lots of “supporting evidence” …
https://www.ipcc.ch/assessment-report/ar6/
Please let me know if you should have any specific questions while reading.
In section 9.2.1.1, “Sea Surface Temperature”, on page 1223 you will find just one example of the variability of the trends in SSTs around the world.
NB : “The trend from 1950 to 2019 is positive” does not equal “the current rate of warming is steady“.
There is absolutely nothing whatsoever in the entire 2409 pages of the AR6 WG-I report that is even remotely equivalent to “GMSST warming is steady“.
Question 1) Are you able to provide a page number, and a copy of the exact “citation”, that supports your original bald assertion ?
Question 2) I also asked for “concrete numbers”. Are you unable to provide them (along with page number and citation) ?
Question 3) Which “projections” that the GMSST warming is supposedly “following” are you talking about ?
A long term positive warming trend is the same as a steady warming trend. We are seeing a long term positive warming trend. We don’t need to focus on a single anomalously warm El Nino event to be concerned with the potential impacts of long term warming of the oceans. That’s my point.
Feel free to continue quibbling over semantics, that sounds tiresome to me.
No it isn’t (see attached graph).
Translation : I know I’ve lost the argument, and am completely incapable of providing actually citations and data … so I’ll accuse the other person of “quibbling over semantics” …
I asked for “supporting evidence” for your initial bald assertions.
That isn’t “quibbling”, it’s “curiosity”.
Note that so far your (inferred) answers to my questions are
Answer 1) No, I am not able to provide “citations”
A2) Yes, I am not able to provide “concrete numbers”
A3) I do not have any actual “projections” to discuss / debate
At the time of posting the very last comment on this page is from “bigoilbob”, and includes the following question :
I have the same request (for the second time in one comments section).
While you may be incapable of finding the sections discussing GMSST in the AR6 WG-I report, I do not have that handicap … though my “mild” version of OCD means I couldn’t not check your claims against what the IPCC actually said.
Attached is a “zoomed in” version of Figure 9.3, which can be found on page 1222, with the most recent (almost) linear trend segment highlighted.
The teal “Observational Reanalysis” line, which goes from ~1870 (?) to 2019 (the “cutoff year” for AR6 inputs) shows a “long term trend” leg after ~1995 that actually slowed down from its previous trajectory, despite atmospheric CO2 levels (and the associated radiative forcing) rising “rapidly” from 1950 onwards.
NB : I conclude nothing from this. It is merely an observation.
Please examine the teal line carefully, and then come back to explain … without entering “avoid answering the question” mode … your initial “the warming is steady” claim.
The subject may be “tiresome” to you, but it is “interesting” to me.
For both context and reference, attached is a copy of the entire middle (1850-2100) part of panel a of Figure 9.3.
Spot on analysis, as always by Willis.Short version:
The 8 year pause ends as a new El Niño begins. While temperatures will probably remain on their post-1950 warming trend, expect hysterical pointers to new record high temperatures and select regional metrics – such as Antarctic sea ice and N. Atlantic sea surface temperatures.
Follow the trends yourself at the great Climate Reanalyzer website:
https://climatereanalyzer.org/
What do you figure is causing things to warm up earlier than previous years? Does Earths weakened magnetic field or wandering magnetic poles have something to do with it?
“They say there is so far no evidence that the planet has passed some climatic tipping point — though it is also too soon to rule that out.
“It’s a possibility, however small,” said Tianle Yuan, a senior research scientist at the University of Maryland, …
”Regardless of what is behind the spike in ocean temperatures, scientists are on edge about it. On Twitter, viral posts sounding alarm bells have triggered heated debates about the potential causes and whether the rise is reason to panic. …
”Scientists nonetheless agree on this: Conditions are ever ripening for extreme heat waves, droughts, floods and storms, all of which have proven links to ocean warming.”
https://www.washingtonpost.com/weather/2023/06/14/record-warm-ocean-temperatures/
It is a possibility that we are into temperature swings preceding another glaciation, however small!
Which possibility is greater?
”Scientists are on edge about it.” But then, aren’t they always?
“Conditions are ever ripening” for extreme weather. We can’t disagree with that!
Larry,
Thanks for the quotes.
Since when has a scientific issue been settled by viral treets?
Twitter is where children chatter, I am told. I never use social media.
Geoff S
Over the past decade, science has been pushed aside in the public policy debate about climate change. Now it’s almost purely political. Which means effective propaganda can decide the result.
Twitter and other media have been flooded with climate alarmism in the past week. Current rapid warming and melting here and there, climate-caused wildfires, predictions of accelerated warming (see this from Hansen).
Is this coordinated, perhaps a prelude to the introduction of Emergency Climate legislation – or an Executive Order? Such tactics work well on modern Americans.
The most reliable century-long data records indicate that the global-average estimate of air temperatures reached its lowest level in 1976. The very fact that SSTs are shown here by alarmists only for the subsequent decades manifests their unwillingness to present data in a scientifically objective manner.
I’m interested in seeing this data record. Would you mind posting a link to it?
bdgwx doesn’t seem to see thumbs. But would the -1’er for this comment please acknowledge and justify it?
Australia is supposed to be in an El Nino, but Canberra’s weather is quite cold. I can’t understand it.
Just because winter started two weeks ago…
Presumably sea temperature is not affected by CO2-driven global warming which warms the air in the first instance. How does this warm the seas as long wave radiation does not penetrate the surface layer of the sea? The oceans have a thermal mass of 1000 times the atmosphere so any warming would be unmeasurably small. Global warming does not warm the oceans – right?