By Andy May
Christian Freuer has translated this post to German here.
The yearly net impact of clouds on outgoing and incoming radiation varies over one W/m2 from year-to-year, according to CERES satellite data.[1] AR6 tells us that cloud feedbacks, to GHG surface warming, are the largest source of uncertainty in their assessment of the warming in the past century as we can see from the AR6 Figure 7.10—our Figure 1.
AR6 page 926, reports that it is very likely global net cloud feedback is positive, but the uncertainty is much higher than for other surface temperature feedbacks. The very likely range they report is -0.1 to 0.94 W/m2/°C.[2] Thus, the total uncertainty is over one W/m2 per degree of surface warming, this estimate is totally model based.
Andrew Dessler provides an observation-based cloud feedback estimate for the period from 2000 to 2010 of 0.54 ±0.7 W/m2/°C.[3] Dessler reports a strong overall or net (Planck + lapse rate + water vapor + albedo + cloud) negative (or cooling) temperature feedback of –1.15 W/ m2/°C for the period with an uncertainty of ±0.88. Thus, the overall uncertainty is only slightly higher than the cloud uncertainty. He emphasizes that the CMIP models have a problem modeling the pattern of cloud feedback.

While cloud cover, which is different from cloud feedback, but related, varies a lot from year to year, it has no statistically valid trend from 2000 to 2021.[4] AR6 claims high confidence that net cloud feedback (NCF) is positive and increases it by 20% over AR5, according to AR6, page 979. A positive cloud feedback means that as surface temperatures warm, clouds increase the warming. While the IPCC have adjusted the cloud feedback parameters to increase the feedback, the uncertainty has not improved, in fact it is worse in CMIP6 than in CMIP5, as shown in Figure 1. The AR6 CMIP6 models increase warming due to clouds,[5] and they increase the model uncertainty and the net uncertainty, not a good sign.
Their explanation of how this was done is presented in pages 974-975 of Chapter 7 and is quite weak. Clouds have a warming effect at night, but reflect sunlight during the day, and on average, they cool the surface.[6] The AR6 claim that they act as an overall positive feedback to surface warming, which is possible, but unlikely since the overall effect is a cooling one. AR6 states that “different types of cloud feedback may occur simultaneously in one cloud regime.”[7] It follows that depending upon the time of day, the location, and local conditions, cloud feedback can be positive or negative for the same clouds. Determining an overall parameter or function to characterize cloud feedback may not be possible since the amount of feedback and the sign of the feedback constantly change.
As local meteorological conditions change, especially temperature, the amount and sign of cloud feedbacks can supposedly change according to AR6.[8] That is, AR6 is reporting that feedbacks, themselves, can have feedbacks. Or, at least, the direction and magnitude of some feedbacks can change as surface temperature changes. This obviously makes predicting future climate changes very difficult. Climate models normally show feedbacks increase (become more positive or warming) as temperatures go up although some show them decreasing (becoming more negative or cooling).[9] AR6 carefully explains that this change in feedbacks with conditions is poorly understood and cannot be quantified.
We also have satellite data that show high-level cirrus clouds in the tropical Pacific provide a negative feedback to sea surface temperatures (SST).[10] Richard Lindzen and his colleagues introduced this concept, which they named the “iris effect,” in 2001. While the debate over the iris effect has been fierce, it has stood the test of time. AR6 discusses it on pages 972-973 and has low confidence it is a negative feedback as Lindzen has always claimed. They manage to present a two-page discussion of the iris effect without once mentioning Richard Lindzen, Ming-Dah Chou, and Arthur Hou, the original authors of the concept.[11]
Lindzen and his colleagues hypothesize that rising surface temperatures increase the speed of the water cycle over oceans and this leaves less water vapor available high in cumulus clouds for the formation of high-level cirrus clouds. Thus, as surface temperatures increase, there are fewer cirrus clouds, and the sky opens like an eye’s iris. This allows more surface radiation to escape to space, cooling it. High-level clouds are very cold, made of ice, and persistent. They do not radiate much energy to space because of their low temperature, but they absorb, and block surface and low-level cloud emitted radiation. Low level clouds are warmer, so they emit more radiation, as well as more effectively block incoming sunlight than cirrus clouds. Thus, logically lower-level clouds are more likely to provide a negative feedback to surface warming, but both Sherwood, et al. and AR6 claim lower level clouds are a net positive feedback to surface warming. The debate on this issue continues, but AR6 does provide an uncertainty range that includes some small negative values, as shown in Figure 1.
Recently, Thorsten Mauritsen and Bjorn Stevens acknowledged that convection efficiency (water cycle speed) is only very crudely represented in current climate models. They programmed a very simple representation of the observed precipitation efficiency/iris effect into their climate model and found it caused the computed ECS to fall to the low end of the IPCC range, near a value of two. They think the models might be missing these important hydrological feedbacks and agree with Lindzen that dry and clear (cloud free) areas in the tropics expand with surface warming.[12] Mauritsen and Stevens showed that including the iris effect in their model moved all model results closer to observations. Other model experiments disagree with Mauritsen and Stevens’ results, so model results of the effect are inconclusive at this time, however the data is not.
The amount of net cloud feedback (NCF) and its long-term trend are uncertain. AR6 is also uncertain about whether NCF is positive or negative, although they state it is likely positive. They acknowledge that even if NCF is positive today, it could still turn negative in the future. And, as Figure 1 shows, the uncertainty in the sign and magnitude of the total feedback to CO2-caused warming is mostly a result of the uncertainty in NCF.
ECS
While Lindzen and other researchers have relied on observations to estimate climate sensitivity to CO2, the IPCC relies mostly on models, theory, and climate process analysis for their estimate. AR6 does take into account observation-based studies, such as those by Richard Lindzen, but they are only one of five methods of constraining the range of climate sensitivity estimates. They used a subjective statistical analysis technique to combine all five methods and derive the ECS range provided in the report, but Nic Lewis has shown the methodology (taken from Sherwood, et al.) was flawed.[13]
Paulo Ceppi and colleagues have examined modern climate model estimates of ECS. It turns out that model computed ECS is very dependent upon net cloud feedback (NCF). As we explained above, cloud feedback is only estimated and not known, and it cannot currently be modeled. It can only be “parameterized.” This is a fancy modeling term that translates into English as “assumed” or an educated guess. The relationship between model based ECS and NCF is shown in Figure 2, the data shown in the plot is from Ceppi, et al.[14]
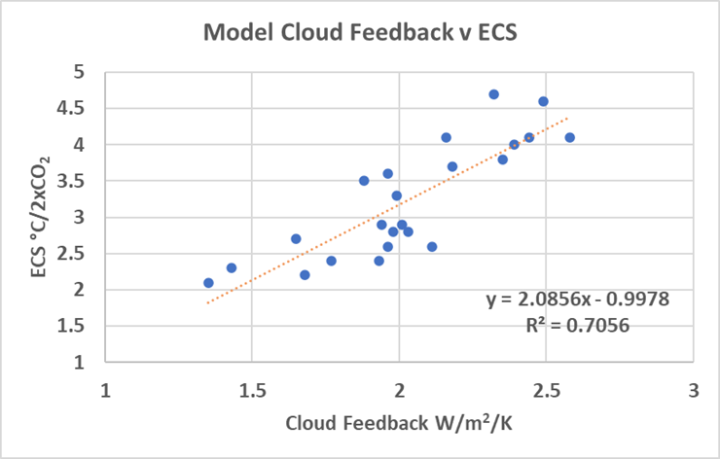
Figures 1 and 2 demonstrate that clouds are the major source of uncertainty in the calculation of ECS and future warming. Further, the R2 in figure 2 suggests that the cloud feedback parameters fed into the models explain 71% of the variability in ECS. Ceppi, et al. write:
“The net cloud feedback is strongly correlated with the total feedback parameter …”
(Ceppi, Brient, Zelinka, & Hartmann, 2017).
If the most uncertain model parameter explains 71% of the model result, how confident can we be in the result? The models plotted in Figure 2 are not the same models used in AR6, but similar AR5 models. AR6 acknowledges the dependence of ECS on NCF:
“… CMIP6 models have higher mean ECS and TCR values than the CMIP5 generation of 50 models. They also have higher mean values and wider spreads than the assessed best estimates and very likely ranges within this Report. These higher ECS and TCR values can, in some models, be traced to changes in extra-tropical cloud feedbacks that have emerged from efforts to reduce biases in these clouds compared to satellite observations (medium confidence). The broader ECS and TCR ranges from CMIP6 also lead the models to project a range of future warming that is wider than the assessed warming range”
(AR6, p 927).
Steven Koonin reports in his iconic book, Unsettled on page 93 that researchers at the Max Planck Institute tuned their MPI-ESM1.2 climate model to their desired ECS using adjustable cloud feedback parameters. Koonin’s comment on this was “Talk about cooking the books.”
Modeled ECS, projected warming, and modeled TCR are more uncertain in AR6 than in AR5, and the increased uncertainty is due to net cloud feedback uncertainty. The uncertainty in the impact of clouds has increased due to efforts to reduce bias in clouds relative to satellite observations. Clouds cannot currently be modeled, so the changes were caused by manual changes to adjustable model parameters. The parameters increased the assumed, but unknown, positive cloud feedback, which increased the strongly correlated modeled ECS. Then the models produced both a higher ECS and higher projected future warming. Big surprise. It looks like the IPCC is manufacturing a desired result, and not doing it very convincingly.
The bibliography can be downloaded here.
-
May, A. (2021c, April 28). Clouds and Global Warming. From CERES data. Link. ↑
-
AR6, Chapter 7, page 975 ↑
-
Dessler, A. E. (2013). Observations of Climate Feedbacks over 2000-10 and Comparisions to Climate Models. J of Climate, 333-342. ↑
-
May, A. (2021c, April 28). Clouds and Global Warming. Link. Figure 5. ↑
-
AR6, page 979. Cloud feedback is 20% larger in AR6 than in AR5. On the same page, AR6 admits this why modelled ECS is larger in AR6 than in AR5. ↑
-
(May, 2021c) and Ceppi, P., Brient, F., Zelinka, M., & Hartmann, D. (2017, July). Cloud feedback mechanisms and their representation in global climate models. WIRES Climater Change, 8(4). ↑
-
AR6, page 975 ↑
-
AR6, 975, 979, 980 ↑
-
(IPCC, 2021, p. 981) ↑
-
Lindzen, R., & Choi, Y.-S. (2021, April 1). The Iris Effect: A Review. Asia-Pacific Journal of Atmospheric Sciences. ↑
-
Lindzen, R., Chou, M.-D., & Hou, A. (2001, March). Does the Earth have an Adaptive Iris. Bulletin of the American Meteorological Society, 82(3). ↑
-
Mauritsen, T., & Stevens, B. (2015). Missing iris effect as a possible cause of muted hydrological change and high climate sensitivity in models. Nature Geoscience, 8, 346-351. ↑
-
Lewis, N. (2022). Objectively combining climate sensitivity evidence. Climate Dynamics. ↑
-
Ceppi, P., Brient, F., Zelinka, M., & Hartmann, D. (2017, July). Cloud feedback mechanisms and their representation in global climate models. WIRES Climater Change, 8(4). ↑
Dismissing Lindzen et al’s Iris effect seems motivated by a need to find a positive feedback.
And refusing to acknowledge the authors is just petty.
My thoughts exactly!
“And refusing to acknowledge the authors is just petty.”
I disagree. I believe the refusal to acknowledge the authors is absolutely strategic.
They don’t want anyone to google Lindzen and read any papers or discussions that don’t follow the CAGW narrative.
The (deliberately) uneducated masses are much easier to manipulate with simple propaganda.
Actually, it´s more than that, it´s about controlling the narrative.
Skeptics cannot ever be right!
Otherwise you soon have to wonder not only about possible low feedback, but also holes in paleo data (S. McIntyre pointed out quite a few of those), the validity of climate attribution in general (see R. McKitrick´s paper from last year) or the real world temperature records (R. Spencer measures less global warming then the other products)
Positive feedbacks do exist. Even the climate sensitivity figures according to studies by Nic Lewis, both jointly with Judith Curry and without Judith Curry, require positive feedback in order to be correct. However, climate modelers seem to get models indicating greater positive feedback than indicated by Lewis and Lewis & Curry, and greater than indicated by how much the world has actually warmed since the hindcast – forecast transition dates of the CMIP3, CMIP5 and CMIP6 models. I blame excessive climate sensitivity in these models on groupthink and need to conform with an “in crowd”. So, I see the combined water vapor and relative humidity feedbacks being excessively positive and cloud feedback in the tropics being excessively positive in the models, and I see this as causing the models to show a greatly overstated tropical upper troposphere warming hotspot.
That the net effect of clouds is cooling used to be settled science, until models needed more warming.
The issue is effect of change of clouds. Increase of heat movement effectiveness of updrafts many clouds have is a reason for cloud coverage to decrease from warming. There is also the issue of low clouds and high clouds which can change in different ways, with low clouds blocking sunlight more and being more cooling. Another issue is if cloud change (especially for low clouds) is unequal for daytime and nighttime, because clouds are warming at night and cooling during daytime.
NASA, c. 2000, net effect of clouds is to heat the surface 5 degrees C.
https://isccp.giss.nasa.gov/role.html#:~:text=The%20net%20effect%20of%20clouds,surface%2C%20provided%20nothing%20else%20changes.
Do not cirrus clouds reflect some incoming sunlight and is that more or less in terms of total energy than the IR from below that they intercept and re-radiate?
Observations seem clear that they reflect + emit much less than they intercept from the ground. It isn’t clear that lower-level clouds have the same effect, they are more likely to reflect and emit more than they intercept, in net terms. See here for a discussion and references:
Climate Sensitivity to CO2, what do we know? Part 1. – Andy May Petrophysicist
There is a section on Lindzen and Choi, 2021, focus on that.
Yes, they do reflect some incoming sunlight, but they reflect back to Earth more of the outgoing LWIR radiation.
I believe most models and atmospheric scientists agree that REDUCING high cirrus clouds cools the planet.
reflect LWIR radiation ??? absorb and re-emit maybe … but reflect … no …
Agreed.
I was using “reflect” just in terms of the net energy balance.
Your language is much more accurate as regards the actual physics.
It can be worked out approximately. From Hartmann’s textbook “Global Physical Climatology”..negative is cooling…the main climate engine is sunshine….low stratus clouds have big negative numbers because they are reflecting a lot sunlight back into outer space during the daytime…high cirrus clouds are mostly “warming” because they let a lot of sunlight through to the surface during the daytime….it should be no surprise that more sunlight over a day makes the surface warmer. Albedo change of cloud cover versus land would be say .25 on the x-axis, maybe .4 over ocean.
Sorry, Denis….I realize I didn’t really answer your question. It takes a course to do that, not a brief blog comment. Here are slides from one of Hartmann’s course lectures that might help you. You need to get to about slide 26 before you’re close to an answer.
Hartman is a true climate expert. I am a big fan of his clear presentations.
https://www.atmos.washington.edu/~dennis/321/321_Lecture_9.pdf
CMIP6 in general is not a good look. Not just clouds. Rather than decreasing the uncertainty range of ECS, it increased it over CMIP5. Going the wrong way.
I agree with you Rud. AR6 is the worst report put out by the IPCC in my opinion, and I’ve read all of them.
FAR was a good report, I think everyone can agree with that statement, but they go downhill fast after that. The SAR chapter 8 fiasco, the TAR hockey stick, the AR4 Himalayan glacier fantasy, and the AR5 hot spot were pretty bad, but the problems with AR6 are beyond description.
For those that want the sorry details start here:
SAR, the Turning Point – Andy May Petrophysicist
Big tent problems. Sometimes a team’s worst opponent’s change in the same locker room.
But possibly more truthful?
Over 20 years ago I dealt with estimates and measurements of solar insolation related to solar heating of buildings and solar energy control related to air-conditioning systems. What was very clear was that solar energy is highly variable and clouds are responsible for the vast majority of the variability of energy reaching the surface. All we could do in terms of HVAC system design was rely on “clear sky” data for best case (heating) and worst case (cooling) estimates. The effect is stochastic – highly variable and unpredictable. Trying to represent such a system with some statistical average single value or even determining a reasonably defensible uncertainty is a fool’s errand in my opinion.
As the CMIP6 modelers are finding out to their total embarrassment.
It is why the NIST TN1900 document caught my attention for temperature variation. This document moves on from measurement uncertainty indicators like Statistical Error of the Mean and to recognizing the expanded experimental uncertainty in the data itself. It shows how to calculate an accurate estimate of the range that monthly averages could take. The variance in just a month is substantial.
Loeb et al. 2021 is relevant. There are other publications of a similar nature. What has been seen over the last few decades is that absorbed solar radiation has increased with clouds being a positive contributor. I don’t think that is necessarily contrary to the Iris Hypothesis though. A configuration of less clouds by day could increase ASR simultaneous with less clouds by night increasing OLR. In fact, Loeb et al. 2021 seem to suggest this configuration or least one with a similar result. But, they also suggest the ASR effect is stronger than the OLR effect so the net effect of clouds has a positive contribution to the EEI.
Thanks for the link, it looks like a good paper. This is significant:
Notice the error (5-95%) nearly equals the difference. He is talking about the EEI (Earth’s energy imbalance) from 2005-2019. Clearly the EEI is positive, it must be since temperature is higher now than 2005, but very small and the culprit is not temperature, but other factors. See attached. From Loeb’s figure 2.
It is not clear to me that 2005 will be cooler than 2023. The UAH data for the first 3 months of 2023 is similar to 2005. Time will tell.
The trend from 2005/01 to 2023/03 is +0.19 C/decade. That is 0.35 C of warming.
No, a trend is not any indication of warming especially with short term data. Quit pushing nonsense.
I’m going to let you pick that fight with Monckton.
MoB points out a lack of a trend. You tried to claim a trend is evidence of warming.
Yes. Monckton points out the lack of a trend over a short period is evidence that warming paused.
In this fora, when physically/statistically durable trends are discerned, the whines are all about irrelevant “systemic error”, “autocorrelation”, errors of errors, and the like. But when CMoB publishes his semi monthly statistically/physically insignificant claim that we’ve been “flat” for many years – even though the chance of that referenced trend actually being flat/down is only slightly above even then all of that conditional erudition gets stored away….
The Planck feedback (temperature) is always negative. It’s the primary means by which the climate system equilibrates to a positive EEI. Anyway, the important take from Loeb et al. 2021 relevant here is that the cloud feedback is net positive. It does act to increase OLR so one aspect of the Iris Hypothesis may be true. The problem is that it acts to increase ASR even more so the implication that the Iris Hypothesis would be net negative is not supported by the data here.
bdgwx,
Don’t assume all clouds have the same feedback to surface temperatures, or that they only respond to surface temperature. Clouds do not even respond to surface temperature in the same way all the time. I believe that high level cirrus, in the tropics, currently provide a positive feedback and clearing them is a negative feedback, but we cannot generalize that to all clouds, especially low-level clouds.
Clouds definitely do not all behave the same way. There are at least 3 degrees of freedom I know of that play a role in the planetary energy balance. They include time-of-day, altitude, and microphysical composition.
Nope, the clouds decreased and the temperature went up. That means cloud feedback is negative (more clouds lead to cooling). The OLR went up because of the warming from the increased solar energy absorption. It appears your logic is driven by what you want to believe.
This is part wrong, part overly simplistic, and part irrelevant. It’s wrong because a change in clouds leading to warming would be a positive feedback. It’s overly simplistic because less clouds does not necessarily cause warming. It depends on the time-of-day and altitude of those clouds. And it’s irrelevant because we’re talking about feedbacks while you are trying to say that clouds are part of the forcing chain.
Yes. OLR goes up when ASR goes up. It’s the 1LOT. The topic being discussed here are what feedbacks contributed to the increased ASR.
It’s not my logic.
I don’t believe that is how positive feedback is defined. Only positive when increases in clouds that cause warming (or decreases cause cooling). When cloud increases cause cooling that would be a negative feedback.
The reason for the ASR increase was tied to the PDO phase change in 2014. Seems reasonable. It also appears the AMO change back in the 1990s may have caused cloud changes.
That’s not how a feedback works. The feedback being positive/negative is not in reference to the direction of change of the feedback. It is in reference to the direction of change in the response. For example, warming causes snow/ice to decrease which then causes more warming. That is a positive feedback even though the snow/ice decreased.
The response is what is normally defined as feedback. In this case you are claiming the clouds are a feedback to some unknown cause and then claiming this means cloud feedback is warming. I don’t believe this is the common use of the term “cloud feedback”. You are redefining a known term.
The cloud feedback is negative when a temperature change causes a change in clouds which then acts to suppress the temperature.
The cloud feedback is positive when a temperature change causes a change in clouds which then acts to enhance the temperature.
In the Loeb et al. 2021 graph above the response is the change in EEI (ASR – OLR) on the vertical axis. The feedback agents are the categories along the horizontal axis. For example, water vapor is positive while temperature is negative. In other words when the EEI goes up it causes a change in water vapor which causes the EEI to go up further. That is a positive feedback. On the other hand when EEI goes up it causes a change in temperature which causes EEI to go down. That is a negative feedback. These are the well known Clausius-Clapeyron (water vapor) and Planck (temperature) feedbacks.
You’re still using the wrong words. You just described proposed EEI feedbacks. It has nothing to do with cloud feedback.
Clouds are one of the feedback agents that affect EEI and ultimately the global average temperature. You can see it listed in the graph Andy May posted above.
Give it up. Your attempted obfuscation is obvious. Do you get paid for this nonsense?
You got it!
How does a cloud that isn’t there cause a positive feedback? It may change the albedo, but that isn’t a feedback.
Dubal/Vahrenholt 2021 covers the same CERES data and provides more insights.
On the whole scheme of things a watt is irrelevant.
Look at the basic formula
Energy flux absorbed by the Earth = 1361 x (1-0.3) / 4 = 239.7 W/m2
1361 is the Solar constant averaged over a year…..varies by about a quarter of a watt….
The next number is the Planetary Albedo. Herein is a big and important problem. The cloudless moon has A= .13, nearly cloudless Mars has A=.15, for heavily clouded Venus A=.77. Everyone uses Earth A= .3 from satellite sensor readings integrated from many sweeps of the entire planet.
But Earth is a special mosaic of local Albedos. Clear sky over ocean water has A= less than.1, clear sky over green continents about .25, stratus clouds A=.8, with thinner clouds having lower Albedo down to about .4 before we start calling them aerosols.
In reality it is mostly clouds that cover 65% of the planet that result in an average Albedo at about .3 by controlling the amount of water vapor that evaporates from the oceans, which in turn, controls the amount of cloud cover.
Look at the formula. Albedo can vary locally by varying cloud cover from about .15 to .8, or about 155 watts. Cloud cover can easily vary by 10% locally in one hour. Anybody who thinks they know the number within a watt or even 10 watts has a bad case of hubris, and has probably never set up or calibrated any thermometric test instruments.
Yes, you can calculate .13 degree per decade of global warming and come up with some imbalance like 0.4 or .9 watts having been the cause of warming of 50 meters depth of land and sea, but really you are kidding yourself. A watt is less than noise in the actual measurents.
‘1361 is the Solar constant averaged over a year…..varies by about a quarter of a watt….’
That’s the average. Insolation itself varies by about 91 W/m^2 from winter to summer.
How do you justify 4 significant figures in the result, when the albedo is only estimated to one significant figure?
Excellent point Clyde, lest we forget….To the proper significant digits of our radiation instruments…global warming is ZERO….A thermometer that has measured temperature over the last hundred years is no longer accurate within a degree either….
Averaging satellite data says A is .304…but if a cloud goes over, it changes locally within minutes. So if your car speedometer is accurate to a thousandth of a mile per hour….do you really know when you’ll get to the store with 5 digit accuracy. No…too many other influences…
That is my thought. Climate science is trying so hard to find data to prove warming that they deal within the uncertainty intervals by averaging and think they have found something significant.
I remember in the months following climate gate it came out that the “ expert modelers” could nt even agree on basic stuff that makes huge difference like average cloud cover. And for a little while there it looked like the tide had turned and the warmest we’re going to be the laughing stock of science.
Then something happened- I could not believe how quickly the MSM rehabilitated these people’s reputations. That’s when I realized the level of bias and corruption we were dealing with. Far worse than it had been.
There may not be a global trend in cloud cover but there certainly seems to be (big?) a regional trend in Europe :
https://climate.copernicus.eu/esotc/2020/clouds-and-sunshine-duration
Real science is of no concern to the activists who are quite convinced they are right and we’re all going to hell in a handcart.
“”Co-founder of XR Clare Farrell said: “The Government had a week to respond to our demands and they have failed to do so.””
https://www.independent.co.uk/climate-change/news/extinction-rebellion-london-government-protesters-friends-b2325994.html
The media belittles respected scientists who disagree with their narrative
“”Richard Lindzen is one of the approximately 3 percent of climate scientists who believe the human influence on global warming is relatively small””
https://amp.theguardian.com/environment/climate-consensus-97-per-cent/2014/jan/06/climate-change-climate-change-scepticism
Sticking with the so-called consensus
Article says:”…(Planck + lapse rate + water vapor + albedo + cloud)…”
Two things: Can we get this fleshed out? Isn’t water vapor already in the wet lapse rate?
Sure, I refer you to Figure 1 and the discussion of it in AR6, pages 978-979, chapter 7. They treat lapse rate and water vapor separately but add them together in the plot.
From Section 7.4 of Working Group 1, the lapse rate feedback:
“The mean and standard deviation of this feedback under global warming based on the cited studies are α LR= –0.50 ± 0.20 W m^–2 °C^–1”.
The water vapor feedback is mostly the Clausius–Clapeyron feedback, “The CC feedback has a large positive value due to well understood thermodynamic and radiative processes: α CC= 1.36 ± 0.04 W m^–2 °C^–1”. The Clausius–Clapeyron feedback assumes constant relative humidity. I have heard elsewhere as high as 1.8 W/m^2 per degree C.
Next, I saw: “The lapse-rate feedback assuming a constant relative humidity (LR*) in CMIP6 models has small absolute values ( α LR*= –0.10 ± 0.07 W m–2°C–1 ..)”. I suspect the CMIP6 models have this incorrectly close to zero, in light of just above α LR= –0.50 ± 0.20 W m^–2 °C^–1, and even more negative than this in a previous IPCC assessment report (AR4 IIRC, might be the 3rd one).
Next I saw: “The relative humidity feedback is close to zero ( α RH= 0.00 ± 0.06 W m–2°C–1 ..)”. I disagree with this on basis of positivity of the cloud albedo feedback being positive, mostly from decrease of coverage of clouds. So, I estimate that cloud feedback, relative humidity feedback and Clausius–Clapeyron feedback combined won’t exceed the Clausius–Clapeyron feedback alone.
One should understand where the idea of cloud feedback comes from. The older literature is quite helpful there.
Just like the troposphere, clouds reach high up in the tropics, but not so much at high latitudes. With altitude temperature decreases, and so the higher the cloud, the stronger its GHE. If you look at Earth as it is, you will find strong GHEs related to clouds in the tropics and weak GHEs in colder regions. From there on it seems logical to assume higher temperatures should increase the cloud GHE.
The problem here is, correlation does not imply causation. The reason why clouds reach higher in the tropics is not because of the temperatures there, but because of insolation. It is solar energy that drives the tropospheric circulation. The excess heat over the daytime, relative to atmospheric temperatures, causes parcels of air to ascend. Thus insolation is directly responsible for both the altitude of the troposphere, as well as that of clouds. There is no reason this should change because of lower or higher absolute temperatures.
Cloud feedback in itself is an erroneous assumption. That is next to even more fundamental issues climate science has with clouds..
https://greenhousedefect.com/the-beast-under-the-bed-part-1
Your website says “Back radiation” from clouds will necessarily decrease with altitude….
is that increasing or decreasing altitude ? Feedbacks and forcings fubars, state more actual watts/sq.M, you need to edit it a bit so readers can appreciate your efforts….just sayin’, no malice intended.
“They used a subjective statistical analysis technique to combine all five methods and derive the ECS range provided in the report” in other words GIGO …
This is a heavy going
Paragraph “Lindzen and his colleagues hypothesize ….”
To paraphrase, I’m trying to think but I’m confused with facts …
Cloud science obviously isn’t my forte.
It can only be “parameterized.”
When I were a lad these were known as Fudge Factors in polite company
No, the actual “Fudge Factors” are used in the tuning. Parameterization is the process of building a simplified, subjective mental model of how they think clouds behave on the whole. That is, the net results on average.
In this context “parameterized” refers to the handling of physical processes occurring on scales smaller than the resolution of the model (the distance from one cell to another in the grid mesh). For example, radiation is always parameterized since it occurs on the molecular scale which is obviously far smaller than even the highest resolution models are capable of today. Clouds are usually parameterized especially in climate models since they occur on scales smaller 100 km. The CM1 model ran at super high resolutions < 100 m would be an example where clouds are not parameterized. See Finley et al. 2022 for an example.
In this context “Fudge Factors” or more formally known as free parameters are values that are typically estimated from data. For example, in the model F = G*(m1*m1)/r^2 the G term is a free parameter or “Fudge Factor”. It’s value is currently estimated at 6.6743 ± 0.00015 × 10⁻¹¹ m3/kg.s2. The concept of free parameters or “Fudge Factors” is independent of parameterization. But it is true that most parametrized processes are modeled using one or more free parameters or “Fudge Factors” that must be estimated from the available data.
I really can’t take anymore GHG “heats” the earth nonsense … GH Gases are INSULATION … insulation can NEVER heat anything warmer than the insulation … it can “slow” the loss of heat … thats it … it can never block the heat loss … the energy from the sun always ends up back in space (with some losses due to chemical/physical reactions which when the plant dies can end up releasing the energy back into the system) …
This single sentence indicates the incompetence of climate modellers and the lack of perspective.
Clouds both warm and cool. Netting the effects across the globe is nonsense. Warming dominates when the ocean surface is less than 15C. Cooling dominates when the surface temperature is higher than 28C. In fact the transition is so sharp above 28C that the surface cannot sustain more than 30C.
So clouds are a stabilising factor that limit heat input above 28C and reduce heat loss below 15C.
Earth’s surface temperature is dominated by advection – transport of heat from tropics poleward. The change in surface temperature and net heat uptake are completely uncorrelated across the globe. Any fundamental theory on climate MUST focus on advection. It is the primary driver of surface temperature.
There can be no runaway global warming because convective clouds prevent it by limiting open ocean surface temperature to 30C over any annual cycle.
Exactly. Clouds are totally responsible to maintain a tendency toward radiative equilibrium in atmosphere, along with dynamic transport by water.
As evaporation increases, surface transmissivity is reduced. As condensation increases, transmissivity is increased.
From an optical point of view, the necessary definition for the active radiating surface is the clear sky actual surface and the cloudy sky cloud surface.
As a consequence, SW and LW variables are coupled.
The corresponding greenhouse gas radiative effect magnitude is = to the SW albedo reflection. About 100 Wm-2 each using simple blackbody concepts.
As albedo decreases, the magnitude of the greenhouse effect necessarily decreases too. As albedo increases, the magnitude of the atmospheric greenhouse effect increases too.
LW and SW radiative effects are the same. They are totally governed by the phase changes of water.
So, to understand climate change we must look beyond mere radiative effects.
Exactly right. The temperature is independent of well mixed GHGs. ECS and TCR are meaningless concepts. Unfortunately, skeptics have been caught in the same trap of looking at energy from a radiation view only. Those effects are cut off in the boundary layer.
Global temperature won’t go into runaway, but it has gotten to 24-25 degrees C in the past, even though probably with the tropical oceans not a lot warmer than 30 C.
The two key variables are energy in and atmospheric mass. Not sure if the mass changed much during those warmer periods but almost certainly there was no ice at the poles significantly reducing the planetary albedo which increases the energy in.
There is evidence that the oxygen level in the atmosphere reached 35% in the Cretaceous period. That pushes total mass up by around 15%, corresponding to a 3C increase in tropical ocean surface temperature, which has also been identified.
https://academic.oup.com/jxb/article/52/357/801/480280?login=false
When there is no sea ice forming at high latitudes, the average ocean temperature is no longer near the middle of the upper and lower limits. It tends toward the upper limit. So much higher averages are possible but the maximum can only increase beyond 30C if the atmospheric mass increases. This is the nature of convective instability and the persistence of the associated clouds.
The ocean water surrounding India is close to the 30C limit over the entire region. That means the Indian monsoon is not far off.
https://earth.nullschool.net/#current/ocean/surface/currents/overlay=sea_surface_temp/orthographic=-287.49,16.16,383/loc=86.847,9.209
The temperature will hold near the 30C limit once the monsoon sets in then cool around September as the sun zenith moves into the SH.
Summer ice may disappear in the Arctic Ocean but there is no prospect of the oceans getting warm enough in the current precession cycle to lose the winter ice. So the Arctic Ocean will continue to have sea ice.
Southern Ocean is in a cooling trend for the next 8,000 years so sea ice in the Southern ocean will continue to trend upwards.
It would appear that the tropics have been relatively stable throughout time, with most of the change in temperature happening at the poles, as is at least happening at the North Pole currently.
I really struggle with this part.
“Mauritsen and Stevens showed that including the iris effect in their model moved all model results closer to observations. Other model experiments disagree with Mauritsen and Stevens’ results, so model results of the effect are inconclusive at this time, however the data is not.”
If including the iris effect moves climate model results closer to observations why isn’t that a good thing? It brings to mind Richard Feynman thing. Paraphrasing – if testing doesn’t match observations your hypothesis is wrong no matter how beautiful it may be.
Well, it seem to say that there is the data, which is pretty consistent.
Then there is an attempt to include the concept of the iris effect in models. Some modeled results are thus moved closer to the data, some modeled results are moved further from the data, or perhaps not changed at all. Theories drive model design. Therefore some theories disagree with other theories — or some modelers make more errors than others in expressing the theories in their models.
Andy, to quote the net “A stronger lapse rate (the rate of decrease of temperature with altitude) gives rise to a stronger greenhouse effect and a warmer surface”
The rate of decrease is greater in a dry atmosphere than a wet one. So how can WV and a less strong lapse rate cause surface warming?
And how about evaporation? Clouds come from evaporation, it takes 5.4 times as much energy to evpaorate water as take it from 0 C to 100 C
The energy involved in evaporation is huge, where is this factored in? It is a HUGE -ve feedback
A colder AMO increases low cloud cover, and a warmer AMO reduces low cloud cover. But the AMO itself is a negative feedback to the solar wind strength, via the North Atlantic Oscillation. The AMO is always warmer during centennial solar minima when the solar wind is weaker (-NAO), and the AMO is colder when the solar wind is stronger (+NAO), as is in the mid 1970’s. mid 1980’s, and early 1990’s.
Correlations of global sea surface temperatures with the solar wind speed:
https://www.sciencedirect.com/science/article/pii/S1364682616300360
Solar wind temperature and pressure: