By Christopher Monckton of Brenchley
The New Pause has lengthened to 8 years 9 months. The least-squares linear-regression trend on the UAH monthly satellite global-temperature dataset shows no global warming from July 2015 to March 2023. As usual, this site is just about the only place where this continuing failure of global temperatures to do as they are told is reported.

The start and end dates of the New Pause are not cherry-picked. The end date is the present; the start date is the farthest back one can reach and still find a zero trend. It is what it is.
For comparison, here is the entire dataset for 44 years 4 months since December 1978. It shows a less than terrifying long-run warming rate equivalent to 1.3 degrees/century, of which 0.3 K has already occurred since January 2021, leaving just 1 K to go (on the current trend) until 2100, by which time reserves of coal, oil and gas will be largely exhausted.

The fact that, over the third of a century since IPCC (1990), global warming is proving to be so slower than the 0.3 degrees/decade that IPCC had then confidently predicted (and still predicts today) is relevant to a question posed to two hapless representatives of the current U.S. maladministration by Senator John Kennedy when he skewered them at a recent hearing.
The Senator began by asking Dr Robert Litterman, the chairman of the climate-related market risk subcommittee of the U.S. Commodity Futures Trading Commission, how long he had been studying the climate question. Answer: 15 years. Next, Dr Douglas Holtz-Eakin, president of the American Action Forum. Answer: about 25 years.
Senator Kennedy: “Dr Litterman, how much will it cost to make the United States of America carbon-neutral by 2050?”
Litterman: “I don’t know, sir.”
Senator Kennedy: “So you’re advocating that we do these things but you don’t know the ultimate cost?”
Litterman: “Yes, absolutely, I certainly don’t know the ultimate cost and it’s very uncertain. It depends on innovations, it depends on …”
Senator Kennedy: “I’m just trying to lay a foundation here to understand your expert testimony. Dr Holtz-Eakin, do you know how much it will cost to make the United States of America carbon-neutral by 2050?”
Holtz-Eakin: “Depends how you do it. If we do it all with the Federal budget …”
Senator Kennedy: “Public and private dollars. It’s ultimately private dollars anyway.”
Holtz-Eakin: “I agree.”
Senator Kennedy: “So, how much?”
Holtz-Eakin: “You’re going to look at $50 trillion.”
Senator Kennedy: “$50 trillion?”
Holtz-Eakin: “Yes.”
Senator Kennedy: “OK, thank you. If we make the United States of America carbon-neutral by 2050, by spending $50 trillion, which you’re advocating, I gather …”
Holtz-Eakin: “No.”
Senator Kennedy: “OK, strike that last part. I’m wrong. You’re not advocating it. You’re advocating something.”
Holtz-Eakin: “If you’re going to do something, do something smart: that’s what I’m advocating.”
Senator Kennedy: “If we spend $50 trillion to make the United States of America carbon-neutral by 2050, how much will that lower world temperatures?” [1]
Holtz-Eakin: “I can’t say, because I don’t know what China and India and the rest of the world has done.”
Senator Kennedy: “Have you heard anybody from the Biden administration say how much it would lower world temperatures?” [2]
Holtz-Eakin: “No.”
Senator Kennedy: “Does anybody know how much it will lower world temperatures? [Pause] No?” [3]
Holtz-Eakin: “No one can know for sure.”
Senator Kennedy: “OK. Dr Litterman, if we spend $50 trillion, or however much it takes, to make the United States of America carbon-neutral by 2050, how much will it lower world temperatures?” [4]
Litterman: “Senator, that depends on the rest of the world. We have to work with the rest of the world. We’re in this together. It’s one world. We can’t put a wall around the United States and say …”
Senator Kennedy: “What if we spend $50 trillion, Europe co-operates, most Western democracies co-operate, but India and China don’t? How much will our $50 trillion lower world temperature?” [5]
Litterman: “We’re in this together, Senator. We have to get the world to work together.”
Senator Kennedy: “I understand. I get that. How much will it lower world temperatures?”[6]
Litterman: “If China and India do not help? I don’t know.”
Let us answer Senator Kennedy’s six-times-posed and six-times-unanswered question. It is one of the central questions in the climate debate, but no one in Parliament on this side of the pond would have had the wit, the courage or the persistence to ask it and go on asking it. I continue to be impressed with the calibre of your statesmen compared with our politicians.
To answer this question, we shall use only mainstream, midrange data from scientific sources that the “Democrats” would regard as suitable.

First, the near-straight-line rate at which global anthropogenic CO2-equivalent emissions have grown since the First Assessment Report of the Intergovernmental Panel on Climate Change in 1990 is shown above. That business-as-usual rate will be likely to continue, since most nations continue to expand their combustion of coal, oil and gas.
The global Annual Greenhouse-Gas Index, compiled by the U.S. National Oceanographic and Atmospheric Administration, shows that, despite costly measures taken chiefly by Western nations to abate their emissions, the radiative forcing driven by global greenhouse-gas emissions has continued to increase since 1990 at a near-straight-line rate of 1/30th unit per year. Thus, no effect of existing global emissions-abatement measures, estimated by McKinsey Consulting last year as costing $5.6 trillion a year, is yet discernible.
Secondly, the near-linear uptrend in anthropogenic forcing will continue, given the expansion of coal-fired power in nations such as India, China (now building 43 new coal-fired stations and planning to build still more) and Pakistan (which in early 2023 announced that it would quadruple its coal-fired generating capacity).
In the 27 years 2023-2049, a further 27/30ths of a unit (0.9 units) will arise on business as usual. But if all nations were to move in a straight line towards net zero by 2050, half of those 0.9 units – or 0.45 units – would be abated.


Thirdly, the medium-term rate of global warming per unit of anthropogenic forcing is the ratio of the 1.8 C midrange medium-term 2xCO2 transient climate response, (TCR, above), and the 3.93 W m–2 effective 2xCO2 forcing (ERF, below): i.e., 0.458 K W–1 m2.


Fourthly, adjustment is made for the fact that global warming since 1990 has proven to be less than half the midrange decadal rate that was then predicted – and continues to be predicted today. The observed decadal global-warming rate since 1990, using the satellite global-temperature dataset maintained by the University of Alabama in Huntsville, has been only 0.136 C decade–1:

IPCC (1990) made predictions of global warming based on four emissions scenarios A-D, in descending order of predicted anthropogenic emissions. The scenario B trend-line in CO2-equivalent forcing from 1990-2025 (ibid., fig. 2.4B) was identical to the trend-line assuming constant annual emissions after 1990 (ibid., fig. A.15). In reality, however, by 2023 emissions had increased by some 53% compared with 1990.
Thus, in the 33 years since 1990, Scenario A has proven very much closer to outturn than B-D. Under Scenario A (the business-as-usual scenario), IPCC predicted midrange global warming of 0.3 C decade–1, or 3 C to 2100, and also 3 C final doubled-CO2 warming.

Accordingly, multiplying by 0.136 / 0.3, or 0.453, reduces the predicted warming per unit of anthropogenic influence to match observation.
The above calculations, based on mainstream data, are then combined in a simple equation. The 27/30ths degree uptrend in anthropogenic influence over the next 27 years is halved to allow all nations to move in a straight line from here to net zero by 2050 rather than attaining net zero immediately. That anthropogenic forcing is then converted to global temperature change prevented, which is in turn reduced in line with the shortfall of real-world medium-term warming per decade since 1990 against then-predicted midrange medium-term global warming. Global warming prevented, even if all nations succeeded in attaining net zero emissions by 2050, which they will not, would be less than one-tenth of a Celsius degree:

Even if the US, responsible for 15% of global emissions, were able to attain net zero by 2050, its contribution would reduce global temperature by less than one-seventieth of a degree. That is the answer to Senator Kennedy’s question – the answer that “Democrat” climate “experts” with 15 and 25 years’ experience were altogether unable (or unwilling) to answer.
Does this infinitesimal reduction in global temperature represent value for money? Let us use Mr Holtz-Eakin’s $60 trillion cost of U.S. net zero as a starting-point. For it implies that the cost of global net zero would be $400 trillion. Given that McKinsey Consulting puts the capex cost alone at $275 trillion, and that opex is 2-3 times capex, the total cost could well be $900 trillion, more than twice Mr Holtz-Eakin’s plucked-out-of-the-air guesstimate.
In that event, each $1 billion spent on the futile attempt to attain net zero emissions would prevent approximately one ten-millionth of a degree of global warming – the worst value for money in history.
I have set out these new calculations in some detail because once it is more widely known it will help to bring the climate nonsense to an end.
In making the calculation you assume a connection between CO2 and surface temperature. There is none.
In fact the net radiation energy uptake in any region of the atmosphere is uncorrelated with the surface temperature. Sixteen years of CERES net radiation uptake plotted against the surface temperature change over the same period confirm this fact.
No matter how much atmospheric CO2 is reduced, it will not alter the medium term trend in temperature rise. It will only have an impact when reduced far enough to negatively impact the biosphere.
Earth’s surface temperature is primarily a function of heat advection from where energy is taken in to where it is released. The only way temperature change can be determined is to understand how advection works.
I am certain Lord Moncton knows there is no correlation between CO2 and atmospheric temperature, other than temperature of the atmosphere determines the level of CO2, present in the atmosphere.
The exercise above is simply a demonstration of that. It is an exercise in, ‘give them enough rope and they will hang themselves’.
if we take the supposed ‘beliefs’ of the Climate Alarmists as factual inputs. Even when that is done, the outcome they demand i.e. a total ban on CO2 emissions to ‘control’ temperature doesn’t happen.
The position being promoted by the witnesses at the committee hearing is shown to be ludicrous. Litterman’s constant statement the world has to work together for things to happen is nothing other than the advancement of one world governance. Climate concern is simply being used to advance that UN driven utopia, that is the climate alarm’s only function.
Clearly what we are witnessing is Western state enforced energy sacrifices. We do this, while non Western countries increase their energy consumption (and CO2 of course for what its worth), in their attempt to mimic the Western standard of living.
Climate alarm is just the chosen vehicle Western Politicians have picked to downgrade the West for their own undeclared/bizarre reasons. It would be good if those promoting Western sacrifice would step forward and tell us why that is a good thing?
I don’t think its climate concern being used as a means of advancing one world government, or anything else for that matter. I think its part of a wave of irrationality and conformity which has occurred and is occurring in Australia, UK, New Zealand, Canada and the US.
The vector of transmission appears to be a common native language and shared Internet and social media. The causes are complex. The main symptom is the power of vocal minorities to get attention disproportionate attention and leverage this into a grip on policy making.
“Disproportionate” means that the scale of the problem is far smaller than and does not come close to justifying the scale of the measures advocated with it given as a reason. Back in the day the early precursors of psychoanalysis, Charcot and so on similarly defined hysteria as emotion whose strength is out of proportion to its object. We are well justified in regarding the current wave of emotion about climate, about gender and about race as being hysterical by this standard.
Its characteristic when hysteria is not purely individual, but is mass, that is, where its directed to an object which is the same for all the sufferers, that this leads to exaggerated and fabricated accounts of the object.
So we get the wild claims about climate. But we also get similar wild claims about race and gender. As for instance, the claim that not making puberty blockers and sex-change surgery freely available to teenagers will lead to high risk of suicide. Or the claim that there are anywhere between 2 and 100+ genders in humans. Or the claim that the famous Scottish convicted double rapist is ‘really’ a woman.
Readers will be able to supply their own examples on race. Its just worth pointing out another very common phenomenon that occurs there: the oddity of the choice of object. In the UK in progressive circles it is now commonplace to be very exercised about UK particpation in the slave trade. But there is no excitement about the Islamic slave trade which lasted 1,000 years longer, and tranported 4 or more times as many slaves. Or of the West India Squadron which the UK deployed to eliminate the trade after 1807.
The way to look at climate hysteria is that its one of three or more very similar social phenomena, and has to do with hysterical contagion. It has also some aspects in common with stock market or real estate manias. Perfectly reasonable people seeing the influential among them buying in to a common storyline will buy in too, and there will be immense social pressure to conform, at least outwardly. Hence ‘denialism’, ‘fascism’ etc.
Its very difficult, maybe impossible, to reverse these mass hysterias once they are under way. They can cause not just bubbles and crazed destructive policies, but also persecutions, genocides, disastrous wars. All you can do is try to bring rationality to bear on the subject and wait for them to burn out. Don’t attribute to conspiracy what is due to mass hysteria. And they will burn out in the end, but by the time they do you may have cities in ruins and the population starving.
Read ‘When Prophecy Fails’ for an excellent analysus of the phenomenon, the aftermath, the reaction of believers to the failure.
Bertrand Russell, when reproached with having left Britain for America during WWII is said to have remarked that when two lunatics insist on fighting with knives in a pitch dark room, the sensible observer makes sure he is in some other place. Its a terribly sad and discouraging thought but in the present state of the culture of the English speaking countries, its one that has some plausibility.
“I don’t think its climate concern being used as a means of advancing one world government, or anything else for that matter. I think its part of a wave of irrationality and conformity”
I completely disagree. The march toward totalitarianism, in progress mainly since 2020, is very rational if your goal is much more political power and control.
{olitcal power and control is increased, based on history, by creating fear of some boogeyman, from climate change to Covid to MAGA Republicans.
With Trump appearing in court tomorrow, it is more obvious than ever before that we are morphing toward totalitarianism in the US. Trump is claimed to have committed misdemeanors many years ago (similar to Bill Clinton paying off Paula Jones — not prosecuted) that the Federal Election Commission investigated and decided were legal.
Now a corrupt NYC DA combined a batch of misdemeanor changes, long after their statute of limitations, and claimed multiple misdemeanors are now a new crime he just invented — a felony. And a NYC jury and judge could throw Trump in prison during the 2024 election and slap a gag order on him until then. This is totalitarianism in action — persecuting, prosecuting and censoring political opponents, using a two-tier justice system.
Leftists have wanted strong governments with rule by government experts for the past century. Some want a one world government, but most leftist leaders are too selfish to want that — they want to rule their own leftist nations, which will tend to morph toward totalitarianism, because most people do not like the rule by experts.
Trump has had about $10 million donated to his campaign chest over the last four days since he was indicted, and his poll numbers have increased substantially. This political hit job by the radical Democrats may backfire on them.
The radical Democrats are definitely trying to take us down the totalitarian road. They have weaponized the federal government since the Obama-Biden administration and have been using the various agencies to attack their political opponents, just like every other dictator in world history.
The U.S. government needs a Big Purge. Trump is just the guy to do it. That’s why the “U.S. government/Biden administration” is doing all they can, legal and illegal, to try to get rid of Trump.
Trump is going to blow them up if he gets the chance and they know it.
The radical Democrats are the Enemies of the People.
They will take away your freedoms if given the opportunity. They are in the process of doing that now, starting with Trump. But he won’t be the last, if they succeed in taking him down. I don’t think they will succeed. They haven’t laid a glove on him yet.
The radical Democrats have a tough job: They have tried to smear the most innocent man in U.S. political history. After all their trying, they have nothing on Trump.
Next question: Was the Biden administration coordinating with the New York DA’s office to get Trump indicted. Apparently, there are federal officials in the New York DA’s office. What are they doing there? The Republican Congress wants to know.
Of course this is all coordinated. And they will coordinate with the Georgia DA on the timing and nature of whatever charges he makes also if they can’t make the crap in NYC stick.
He’s on tape for that one so if I was a betting man I’d say that is the glove that is going to floor him.
One sentence out of a whole long phone conversation that was pulled out of context, and misinterpreted. Many lawyers on the phone call heard nothing illegal. No crime was committed.
But juries can nullify any real evidence, or misinterpret any fake evidence, if they want to.
“ Many lawyers on the phone call heard nothing illegal. No crime was committed.”
Well those lawyers better get lawyering then because I have listened to the whole phone call and I can’t see how anyone could say it was legal. Trump can be heard laying huge pressure on Raffensburger. The “sentence” (where he asks him to find 11k votes) very much fits with the tone of the whole thing. But who are you and I to judge, that is why there is a legal system. That’s how justice works.
“very much fits with the tone of the whole thing.”
That sounds a little bit subjective.
Many times, people hear what they want to hear. I think that is the case with you here.
Simon is pretty stupid
A-yup.
So Simon is declaring himself a better legal expert than people who are paid to do it for a living.
Then again, he still believes he’s a qualified scientist.
Trump is on tape sayig Georgia officials need to find 1,000 more votes for him for the win. Trump wanted them to look harder. He didn’t tell them to cheat, which is what the Democrat DA is claiming.
Trump did not tell anyone to create votes out of thin air for him. That’s what he’s accused of, and the “tape” you refer to plainly shows that.
You and the DA choose to cherry-pick the tape.
This is just one more politically motivated persecution of Trump.
The way it looks, Trump is going to be the Republican nominee despite everything the radical Democrats are trying to do to prevent it. Trump is just getting stronger.
The Trafficer-in-Chief, Joe Biden, is trying to destroy the United States. Everything he does harms the nation and the U.S. Constitution. Joe Biden is a dispicable human being who has no business being president.
DA Bragg of New York ought to be prosecuted for judicial misconduct and removed from office.
The latest poll shows 76 percent think these prosecutions of Trump are politically motivated. And that was before people saw that the New York DA has nothing on Trump yesterday.
“Trump is on tape saying Georgia officials need to find 1,000 more votes for him for the win. Trump wanted them to look harder. He didn’t tell them to cheat, which is what the Democrat DA is claiming.”
It’s not my interpretation Tom, this is what he said…
“I just want to find 11,780 votes, which is one more than we have,”
The word “find” might be loose enough to get him off, but I think we all know what he was asking him to do, particularly in the light of the next bit, because then he threatened Raffensburger…
“You know what they did and you’re not reporting it,” the president said during the call. “You know, that’s a criminal — that’s a criminal offense. And you know, you can’t let that happen. That’s a big risk to you and to Ryan, your lawyer. That’s a big risk.”
Then he said this, offering advice on how Raffensburger could bend the law.
“The people of Georgia are angry, the people of the country are angry. And there’s nothing wrong with saying that, you know, um, that you’ve recalculated.”
“Recalculated” is not “finding votes,” it’s Trump speak for cheating.
I’ve read there is another recording that will endorse the tone of this one.
I do admit that anyone who just read this and didn’t know Trump could possibly see there is a slight chance he was not looking to cheat, but that’s the thing, we all do know Trump.
“It’s not my interpretation Tom, this is what he said…
“I just want to find 11,780 votes, which is one more than we have,”
The word “find” might be loose enough to get him off, but I think we all know what he was asking him to do”
It’s loose enough for me to conclude that he was not asking for anyone to cheat.
Your opinion is your opinion. I don’t share it.
Did you see the crazy jury foreperson on this Georgia grand jury? This case against Trump ought to be thrown out of court just based on this person’s behavior. She was practically giddy about indicting Trump during an interview she gave recently. She didn’t look like her elevator went all the way to the top, to me. I wouldn’t want a person like that on my jury.
These lawsuits against Trump are one big political hit job, that might be the end of the personal freedoms of all of us, including the smug Democrats, if Biden and the other underminers of the U.S. Constituion are successful.
I see where Elon Musk has labeled National Public Radic (NPR) as “State-affiliated Media”.
Now, Musk needs to name just about all the rest of the News Media as State-affiliated, or more properly, Radical Democrat Affiliated.
I don’t want my tax money going to a propaganda outfit like NPR. I think I’ll write my representative about it.
The judge assigned to this case was the one who bent over backwards to give every possible break to the prosecution in last year’s trial of a Trump associate. He also gave the maximum penalty, 5 months for a charge that usually results in a small fine.
With this judge and a NYC jury, not matter how weak the charges or non-existent the evidence, conviction is always a real possibility.
Of course it would get reversed on appeal, but by then the election would be over.
“ They haven’t laid a glove on him yet.”
Ummm didn’t he just have 34 charges against him today. I’d call that 34 gloves.
Anyway Tom I want to know. If he is guilty for the charges do you think he should face the same consequences as anyone else? It’s a simple question.
If he were anyone else, the statute of limitations would be respected and nothing would have come of it, unless he owed taxes.
The question is…. if he is guilty, should he be convicted and there be consequences? And clearly the SOL is not a factor here or it would be used.
“And clearly the SOL is not a factor here or it would be used.”
Well, we haven’t heard from the judge on this matter yet.
No doubt, Trump’s attorneys will file several motions to dismiss this case, and from what I have heard, any one of these motions should cause the judge to dismiss the case.
Of course, the judge in this case seems to have it out for Trump, so maybe Trump will need to file a motion to have this judge recuse himself from the case.
It’s not even close to being over, Simon. If it goes to trial, Trump will be president by the time that works itself out.
More comes out this morning:
Links from Bragg to Soros:
https://www.thegatewaypundit.com/2023/04/coup-da-alvin-bragg-da-chief-assistant-meg-reiss-and-others-work-with-the-john-jay-institute-for-innovation-in-prosecution-funded-by-soros-and-more/
At his press conference, Bragg can’t even explain what “crime” was committed:
https://www.thegatewaypundit.com/2023/04/the-dumbest-da-with-the-dumbest-case-says-the-dumbest-things-in-his-press-conference/
These geniuses don’t understand accounting and finance:
https://www.thegatewaypundit.com/2023/04/theres-more-the-dumbest-case-by-the-dumbest-da-ever-just-got-dumber/
The judge is highly biased and should recuse himself PDQ:
https://www.thegatewaypundit.com/2023/04/conflict-of-interest-leftist-judge-juan-merchan-who-oversees-trumps-sham-case-made-political-contributions-against-republican-and-trump/
You need to widen your reading mateirial.
Like CNN, Simon?
Take your modern Marxist slavery and shove it where nothing shines.
I see where CNN is starting a new feature of their news program where they say on Sunday nights they are going to spend a whole hour focusing on one subject so they can go indepth on it.
I’m betting that Joe Biden’s corruption and criminality are never going to be a subject of this special hour. There will be no indepth look into the Joe Biden Crime Family by CNN.
That’s an easy bet.
This is NYC, he’ll be convicted even if he is innocent as a jaybird.
The DA was elected on a promise of convicting Trump, whatever it took.
So I’ll ask you Mark… should Trump be convicted if he is in fact guilty of the crimes he is charged with and if he is, should he get what any other person would get?
Hypocrite.
Well explain….
What an irony, you the king of hypocrisy, calling me a hypocrite. I’m the one who bleats about leftists wasting tax payers money and then supports an x-president who hides his hush money so the tax payer can subsidising his dirty secrets. Not that is hypocrisy.
This Bragg clown cannot release real criminals off the hook fast enough, and all Simon the TDS addict cares about is seeing DJT go down.
Same old Simon clown show.
I love it when you talk dirty.
We love making fun of your stupidity
batterycarboi only shows up in WUWT while waiting around for his battery car to charge up with his free electrons.
There are a few Republicans in New York. Maybe one of them will slip onto the jury.
Someone like me. I’m a registered Democrat. Have been all my life (it’s a long story), but I wouldn’t vote for a Democrat because I think their view of the world is completely delusional.
If I were on Trump’s jury, he would walk free.
‘If I were on Trump’s jury, he would walk free.”
Which is why you are not on the Trump jury. Tom…. it’s just a small point,,,, but you are meant to listen to the evidence from both side before making your decision. it’s how justice should and does work.
“Ummm didn’t he just have 34 charges against him today. I’d call that 34 gloves.”
Yeah, 34 trumped up charges.
Trump is still a free man, and his poll numbers are climbing. They haven’t laid a glove on him yet. Unsubstatiated accusations are not “gloves”.
Well you may be right, but I guess we will now wait and see. But let’s not forget. His Lawyer Cohen was sentenced to three year in jail for his part in all this. He is one man who will be keen to see that justice is fair.
And re the Statue of Limitations, I found this…
“The statute of limitations is unlikely to be an issue, as it does not count time a defendant spends living outside New York state. Trump lived in Washington, D.C., while he was president and has lived in Florida since leaving office in 2021.”
But you didn’t answer my question. “If” he has committed these crimes should he be treated like everyone else and be held accountable?
“But let’s not forget. His Lawyer Cohen was sentenced to three year in jail for his part in all this. He is one man who will be keen to see that justice is fair.”
Cohen was jailed for lying, Simon.
The lawyer who formerly repesented Cohen said Cohen was a serial liar.
And you are putting your faith in Cohen? Why?
“Cohen was jailed for lying, Simon.”
No Tom it wasn’t just lying….
Cohen pleaded guilty to eight criminal[165] charges: five counts of tax evasion, one count of making false statements to a financial institution, one count of willfully causing an unlawful corporate contribution, and one count of making an excessive campaign contribution at the request of a candidate (Trump) for the “principal purpose of influencing [the] election”.
The last part of the last sentence is the killer for Trump.
The thing you have to account for is, for instance, the UK Climate Change Act of 2008. This set the 2050 Net Zero targets for the UK, and was voted for by the House of Commons with only five votes against it. Virtual unanimity.
There are two possible explanations of this. One would be that this was part of some global authoritarian totalitarian conspiracy.
The other would be my own, that it was an example of contagious mass hysteria in the political class of the UK.
For those who adhere to the view of climate as stepping stone to global totalitarianism, perhaps communist in nature, the conspiracy or at least the shared intent to get there is assumed.
For me, its a kind of contagion. It can be on any subject, though lately the subjects seem to have clustered around race, climate and gender. But in principle I see it as not much different from the satanic child abuse hysteria late in the last century, the dot.com bubble, the furious excesses of the housing and credit market leading up to 2008… Or the mad fury that seems to possess nations from time to time to declare war on everyone near them.
No conspiracy needed.
I’d also say: how to account for the fact that the climate mania is almost exclusively in the English speaking countries? If there is an international globalist conspiracy, why aren’t the other countries equally excited about climate?
No, contagion through established cultural vectors is the most likely explanation.
I tend to agree with you Michel
Many past presidents have had dalliances outside their marriage, and the MSM just looked the other way. Thus, there was no need for hush money. I don’t condone breaking the vows of marriage, and it gives me pause about how trustworthy such an individual is. However, it has been so common in the past that I’m reminded of Lord Acton’s observation about how power corrupts.
“I don’t condone breaking the vows of marriage, and it gives me pause about how trustworthy such an individual is.”
Trump said there was no affair with Stormy Daniels, and Stormy Daniels has signed a letter in which she denies having an affair with Trump.
So who you gonna believe, the people directly involved, or the biased government?
Well Stormy was paid to say there was no affair, but obviously now has come clean. But even if you don’t believe her, she is not the only one.
Trump’s sex life is of no interest to me. I like him because of his political positions and his willingness to slap the hell out of the radical Democrats.
There’s nothing illegal about hush money.
Bragg claims that the biggest crime was that these things were done to influence the 2016 election. However all of the things in his indictments occurred during 2017.
“There’s nothing illegal about hush money.”
For once you are right Mark. But it is illegal to get your finance guy to hide it as an expense. And if he did this to hide this information from the voting public, then that is a bigger problem for Donald.
I should declare that I don’t think this will be the straw that cripples Trump. But I do think if what he has done is illegal, like all people, he should be held to account, even if that only means the public get to see what sort of man he is.
I think the big two are Georgia and his keeping the docs.
The vote was the year before this occurred. How then could it be for hiding it from the VOTING public.
“The vote was the year before this occurred. How then could it be for hiding it from the VOTING public.”
Not sure what you mean here. The affair was 2006 and the payment was before the 2016 election. Trump was courting the Christian right. Many on that group may have had second thoughts about voting for a man who screws porn stars while his wife is at home having has just had a baby. And then maybe not….
But the crimes he is charged with occurred AFTER the election. Trying to charge him with trying to hide them from the voting public is what makes the charges felonies upgraded from misdemeanors. The payment was made prior to the election and the public knowledge of the affair and payment came out before the election. No motive for “hiding” it in 2017.
That Simon can’t see this wee little problem is not a surprise.
Exactly what would you have him hide it as? Capital investment maybe?
Lastly, unless you are extremely religious and want to stone adulterers, what difference does it make? Maybe because Trump is a Republican? Not a great reason. How many Democrat politicians running for President have done the same thing? You probably don’t even know because the liberal media ghosted the story!
Think John Edwards. He was acquitted on the one charge that went to trial. The other five were dropped afterwards.
But being a Democrat he is considered differently. Perhaps because they expect such from Democrats and not Republicans?
Just like dropping the 60 vote requirement to approve judges this is going to come back to haunt them.
“Perhaps because they expect such from Democrats and not Republicans?”
That is just a silly comment.
Simon is a hard-core marxist.
“Exactly what would you have him hide it as? Capital investment maybe?”
He’s free to pay off a porn star to stop her talking. He could have paid it with his own private funds… but he chose to put it through the business and hide it as an expense. That is illegal.
“Lastly, unless you are extremely religious and want to stone adulterers, what difference does it make?”
I agree, but that is not what this is about. It’s about the illegal use of his business to hide the payment, not who he has sex with.
That is a misdemeanor paid for with a fine I believe. The criminal felony is based upon trying to hide the expense during a campaign making it a campaign finance violation. Having never been charged, tried, or convicted of a campaign finance crime there is no underlying crime. Bragg is simply betting that he can convince a jury, just like he did the grand jury, that IF TRUMP HAD BEEN CHARGED WITH A CAMPAIGNE FINANCE CRIMINAL CHARGE, HE WOULD HAVE BEEN CONVICTED and therefore a crime does exist. It’s the prelude to creating a thought crime. Wouldn’t the Democrat liberals love that!
The chairman of the Federal Elections Commission has stated there was no campaign donation, ergo there is no crime to “cover up”.
Like all good little marxists, all Simon has are lies.
NCSWIC
This is one of the biggest reasons that a request for dismissal is likely to succeed.
If the judge isn’t totally corrupted and conflicted…
Well certainly the one-world crowd, really a bunch of warmed over nazis without the pretty costumes, have taken advantage of the green insanity, the green mass hysteria to further their own ends. The rich get richer and the poor poorer with even less control than before, as politicians don’t even pretend to care about the voters anymore, the climate and the related special interests are their declared main concern.
What conspiracy has to explain is how Jeremy Corbyn and David Cameron, in the UK, ended up voting for the same idiotic measure. Which had a completely different effect on the interests they were trying to represent.
You can either say they were part of the great conspiracy, despite the fact that they disliked and despised each other.
Or you can say contagion was the cause. This is much more likely.
It’s mass hysteria in the political class.
This climate change hysteria has no basis in fact.
The question is, what is it that makes people susceptible to mass hysterias? In Pirsig’s Zen And The Art of Motorcycle Maintenance, the protagonist splits thought into two modes: Classical and Romantic. Here is his description of the two:
“A romantic understanding sees it primarily in terms of immediate appearance.” Classical thought is often associated with the following: science, objectivity, rationality, reason, analysis, and matter. The other primary mode of thought is romantic in nature: art, subjectivity, emotion, and experience.”
A mixture of the two is good to have. Too much of one or the other can be problematic. But Western thought has been led astray, emphasizing the Romantic and downplaying or even denigrating the Classical mode. I can’t speak to how or why this has happened. Needless to say, there may be bad actors taking advantage and/or pushing this situation. I do know that education is the key.
“I can’t speak to how or why this has happened. Needless to say, there may be bad actors taking advantage and/or pushing this situation. I do know that education is the key.”
Education of the young is the key, and the bad actors have figured this out and are in the process of undermining Western society starting in the schools.
The Bad Actors are raising the next generation of radical Democrats/Communists in our schools right this minute.
“I am certain Lord Moncton knows there is no correlation between CO2 and atmospheric temperature,
WRONG
The point of the article is no correlation from 2015 to 2023, but there was strong positive correlation of CO2 and temperature from 1975 to 2015, and Monckton has never denied that fact, as far as I know.
” … other than temperature of the atmosphere determines the level of CO2, present in the atmosphere.”
WRONG
The level of CO2 in the troposphere is changed by manmade CO2 emissions, not by the temperature of the atmosphere. the amount of water vapor in the troposphere is determined by the average temperature of the troposphere.
Richard,
Thank you for your considered response to my brief comment. I was not intending to provide a detailed breakdown of all the interacting mechanisms that control CO2 in the atmosphere. I am sure your well rounded understanding of atmosphere changes and the multiple inputs/control systems in play ensure you understand that.
As for the correlation of temp and CO2 curves 1975-2015 and the change in that from 2015 -2023 goes, that is a subject I can best leave to others to speak to.
10 yard penalty for being too polite on the internet
Never mind that that the SSTs have been climbing.
https://pbs.twimg.com/media/FsuCOs-WwAAqW55?format=jpg&name=small
Nah! That has NOTHING to do with it. Right Richard? BTW, the increase in SSTs correlates nicely with the recorded increase in abyssal geothermal activity.
The Correlation of Seismic Activity and Recent Global Warming | OMICS International (omicsonline.org)
And so you must explain to us how the increase of atmospheric CO2 has resulted in the oceans warming!
More:
Abyssal ocean warming around Antarctica strengthens the Atlantic overturning circulation – Patara – 2014 – Geophysical Research Letters – Wiley Online Library
A very good point by Rah, and one that is also made by Professor Art Viterito.
Richard claims out of hand that it is physically impossible for geothermal activity to be responsible or even partially responsible for the warming of the oceans. But it seems that there are a number of real scientists that claim it is.
My opinion, for what it is worth, is that this aspect needs far more attention and research than it is getting.
But anyway it goes Richard needs to explain the physical mechanism by which the oceans are warming because it is a huge factor, in fact the elephant in the room when it comes to climate.
The oceans warming decreases the ability of the water to retain CO2 and increases WV, the #1 “green house gas”.
Richard claims out of hand that it is physically impossible for geothermal activity to be responsible or even partially responsible for the warming of the oceans. But it seems that there are a number of real scientists that claim it is.
There are no long term data to make such a claim.
Anyone who makes such a claim is merely speculating.
Knowledge required would be the total heat output of all underseas volcanoes over at least the past 50 years.
No such data exist.
Therefore no conclusions are possible.
And that assumes it would be possible to measure the average ocean temperature with enough precision to capture the effect of underseas volcanoes.
The current state of knowledge is we do not know the ocean heating effect of underseas volcanoes. T
The ocean is a huge mass of water with high thermal inertia.
Any warming could be too small to measure. or at least a change in ocean warming over several decades may be too small measure.
And how could you separate volcano ocean warming from CO2 ocean warming?
I am smart enough to know that “We don’t know” is the current right answer for underseas volcanoes, so anyone who claims to know is lying.
Volcanoes aren’t the only source of heat. The mid-ocean spreading centers provide a relatively low-grade, linear source of heat. Hydrothermal vents, such as Black Smokers, are small, localized sources. Further, the geothermal gradient can be high over magma chambers that haven’t made it to the surface. Lastly, pumice rafts in the open ocean are direct evidence of a volcanic eruption, even though it didn’t apparently emerge above the surface of the water, or get recorded on a seismograph.
The point being, while we don’t have detailed information on the abundance of subsurface thermal sources, we know enough about them to be certain that they exist and they, therefore, shouldn’t be ignored as though they didn’t exist. They help explain the anomalous melting in Western Antarctica, and the ‘heat waves’ I linked to above.
NOAA recently published about ‘heat waves’ at the bottom of the oceans. It passed over how less-dense, warm water gets through the thermocline, unless it originates at the bottom.
https://scitechdaily.com/deep-impact-heat-waves-happen-at-the-bottom-of-the-ocean-too/
I had to look up abyssal because I thought your comment was abysmal
Sea surface temperatures rose from 1975 to 2015 just like land surface temperatures, and had a flat trend since 2015 just like land temperatures. So you are wrong.
Your claim that the increase in SSTs correlates nicely with the recorded increase in abyssal geothermal activity is pure claptrap:
Underseas volcano counts are inaccurate and have a relatively short period of estimates. There is no way any underseas volcanoes trend could be determined, no way their tiny effect on the ocean temperature could be measured, and no way they could affect the atmosphere’s average temperature.
Volcanic eruptions on the ocean floor have a minimal effect on water temperature and are unlikely to contribute to global warming.
Although the temperature of water immediately adjacent to the submarine lava reaches 88 degrees C (190 degrees F), it degrades quickly to 27 degrees C (81 degrees F), only slightly above the ambient ocean temperature, within a few inches of the contact. This is not to say that the water isn’t hot.
Actual volcanoes may, during eruptions, melt quite large portions of the ice sheet around them. In Iceland, volcanic eruptions beneath the ice sheet regularly cause local catastrophic floods, called jokulhlaups.
“And so you must explain to us how the increase of atmospheric CO2 has resulted in the oceans warming!”
Okay
Greenhouse gases impede Earth’s ability to cool itself
The rate of flow of heat out of the ocean is determined by the temperature gradient in the ‘cool skin layer’, which resides within the thin viscous surface layer of ocean that is in contact with the atmosphere. It’s so named because it is the interface where ocean heat is lost to the atmosphere, and therefore becomes cooler than the water immediately below. Despite being only 0.1 to 1mm thick on average, this skin layer is the major player in the long-term warming of the oceans.
Curious behavior in the cool skin layer
The cool skin behaves quite differently to the water below, because it is the boundary where the ocean and air meet, and therefore turbulence (the transfer of energy/heat via large-scale motion) falls away as it approaches this boundary. No longer free to jiggle around and transfer heat via this large scale motion, water molecules in the layer are forced together and heat is only able to travel through the skin layer by way of conduction. With conduction the steepness of the temperature gradient is critical to the rate of heat transfer.
Greenhouse gas-induced warming of the ocean
Greenhouse gases, such as carbon dioxide, trap heat in the atmosphere and direct part of this back toward the surface. This heat cannot penetrate into the ocean itself, but it does warm the cool skin layer, and the level of this warming ultimately controls the temperature gradient in the layer.
Increased warming of the cool skin layer (via increased greenhouse gases) lowers its temperature gradient (that is the temperature difference between the top and bottom of the layer), and this reduces the rate at which heat flows out of the ocean to the atmosphere. One way to think about this is to compare the gradient (steepness) of a flowing river – water flows faster the steeper the river becomes, but slows as the steepness decreases.
The same concept applies to the cool skin layer – warm the top of the layer and the gradient across it decreases, therefore reducing heat flowing out of the ocean.
You are repeating pseudo-science. There is no warming of the ocean surface by CO2 generated IR. As it turns out, the CO2 generated IR cools the surface. This is where climate science goes wrong. The warming you think should happen disappears due to boundary layer effects.
You need to open your mind to new ideas (based on very standard physics).
As it turns out, the CO2 generated IR cools the surface.
A tall pile of baloney
Why should I open my mind to your junk science?
CO2 reflects or deflects energy.
CO2 does not generate energy
Carbon dioxide absorbs energy at a variety of wavelengths between 2,000 and 15,000 nanometers — a range that overlaps with that of infrared energy. As CO2 soaks up this infrared energy, it vibrates and re-emits the infrared energy back in all directions.
If that were true the amount of water vapor should follow temperature. Water vapor observations have consistently failed to show that this is the case. You are the one being WRONG.
Javier,
Agreed. Just because higher temperatures CAN support more water vapour, is not the same as WILL support more water vapour.
Geoff S
It would also set up a continuous feedback loop where by the CO2 causes the oceans to warm, thus decrease their ability to retain CO2 so that atmospheric CO2 would continue to increase thus warming the oceans even more. etc, etc. etc.
The is of course until the CO2 concentration is such that it’s effect becomes negligible.
In a world of two climate variables — CO2 and a water vapor positive feedback — that might be true. But climate change has more than two variables, so that example is claptrap.
There is OBVIOUSLY some limit to the water vapor positive feedback that prevents runaway warming.
The first “limit” is that CO2 is already a weak greenhouse gas above 400ppm
The second limit is probably a negative feedback of more clouds, in response to the positive water vapor feedback. That is the simple explanation. The truth may be more complex, assuming anyone knows. But we DO know for sure that CO2 levels up to 10x higher than today did NOT cause runaway global warming.
“But we DO know for sure that CO2 levels up to 10x higher than today did NOT cause runaway global warming.”
Good point.
Now, does CO2 lead or follow ocean warming?
The global average water vapor estimates are not accurate and often do not agree with each other. Combining some local water vapor measurements and claiming that is an accurate global average water vapor statistic is claptrap.
Water vapor is literally individual molecules of H2O that are part of the collection of gases in the atmosphere. Varies greatly from place to place, and from time to time. It averages only about 0.4% of the atmosphere, but varies from as much as 4% in the humid tropics to near 0% in cold polar regions. 0.4% is a rough estimate. Any claimed trend over time is a rougher estimate.
For ‘heat advection’ refer to the Dynamic Atmosphere Energy Transport model described by me and Philip Mulholland.
It demonstrates that the surface temperature enhancement beneath atmospheres is a product of convective overturning and not radiative gases.
Any effect from radiative gases is neutralised by convective adjustments.
“Any effect from radiative gases is neutralised by convective adjustments”.
WRONG
Convective adjustments are part of the overall process that eliminates any warming from increases in CO2. It’s more complex though.
Only in your imagination.
A lot of experiments and research are done to disprove/prove something. Michelson-Morley and the luminiferous aether Antoine-Laurent Lavoisier and phlogiston are two that come to mind. As we know it only takes one correct experiment to disprove something. As Monkton has demonstrated two pauses, the first of which did cause a stir in Climate Science after about a decade it would appear CO2 and climate is not as simple as some would have us believe
“it would appear CO2 and climate is not as simple as some would have us believe”
The CO2 and climate relationship is very simple
More CO2 impedes Earth’s ability to cool itself
The effect is large up to 50ppm, and small above 400ppm
This is easily determined with a lab spectroscopy experiment, and has been determined since the late 1800s.
There is no logical reason to assume the effect of CO2 in the atmosphere is completely different than the effect of CO2 measured in a laboratory. The evidence available strongly supports that CO2 is a weak greenhouse gas in the atmosphere above 400ppm and it doesn’t matter that a precise effect of CO2 can’t be measured (because there are so many other climate change variables0.
Some conservatives claim that without a precise measurement of what CO2 does in the atmosphere, that proves CO2 does nothing. They are science deniers and common sense deniers.
So the conclusion is obvious:
CO2 above 400ppm is a weak greenhouse gas in a lab and also a weak greenhouse gas in the atmosphere. But CO2 is just one of many climate change variables and as a result, CO2 does not control the climate (as was obvious in 1940 to 1975 and from 2015 to 2023)
The global warming from 1975 to 2015 mainly affected colder nations, in the coldest half of the year, and at night (TMIN). So assuming CO2 caused some of that global warming, which is logical, the warming was actually good news.
And more CO2 in the air is very good news for C3 plants (85% of all plants)
The bottom line is that adding manmade CO2 to the atmosphere with manmade CO2 emissions was good news in the past and should be good news in the future.
C3 plants would prefer at least double the present 420ppm CO2 level. Another +420ppm of CO2, at +2.5ppm per year, would take 168 years. So do more driving now, and use more electricity now, and you will improve the climate of our planet. Our C3 plants will thank you.
And tell this to any leftist you know, if the subject or climate or energy ever comes up — it will make them go berserk. like monkeys in a cage at the zoo go berserk, when you stroll by clanging your metal water cup on the bars of their cage. It’s very entertaining to watch a leftist go berserk.
Dick says”There is no logical reason to assume the effect of CO2 in the atmosphere is completely different than the effect of CO2 measured in a laboratory.”
Attached is a specific heat table from a thermodynamics book. It only shows one energy value for each temperature. If CO2 had an effect of raising the temperature due to IR there should be two columns for energy required one with IR and one with out.
Thermodynamics indicates that CO2 causes no warming.
Nonsense. There is absolutely no need for there to be two columns.
I took a thermodynamics course in college and passed it, although did not enjoy it
CO2 impeding Earth’s ability to cool itself does not violate any laws of thermodynamics. You must have been sleeping during your thermodynamics class, and I don’t blame you.
CO2 does not directly raise the temperature — it inhibits cooling, just like all the other greenhouse gases.
You are confused about the fact that the average temperature of the atmosphere is lower than the average surface temperature, then the answer is that the atmosphere isn’t warming the ground, but rather is preventing the ground from cooling down as much as it otherwise would.
A good analogy is the insulation in the walls of a building.
The average temperature of the insulation material during cold weather is lower than the interior temperature of the building, because the outer face of the insulation is in good thermal contact with the outside environment.
And yet this cooler insulation does a good job of keeping the inside of the building warmer than it otherwise would be.
The greenhouse gases in the atmosphere play a similar role, though they act through different mechanisms: Both systems are in full accord with the laws of thermodynamics.
“And yet this cooler insulation does a good job of keeping the inside of the building warmer than it otherwise would be.”
It only does so if there is continuous heat generation inside the building.
It doesn’t matter how much insulation I put in my work shed walls if I don’t turn the heater on. The building will still assume equilibrium with the outside. It may do so more slowly than if the insulation wasn’t there but it still does it.
The Earth’s heater is an on-off thing as the earth rotates. CO2 may slow the heat loss during the period of “off” but that will only raise the temperature point at which time the “on” period starts.
The Earth still continues to radiate heat away at the same rate at the point the “on” button clicks on, since that temperature point is higher than without CO2 it radiates at a higher level than it would if CO2 didn’t exist, i.e. it radiates more heat away than it would at a lower temperature (no CO2). As the heater (sun) raises the temperature the Earth radiates even more. The heater (sun) will determine the maximum temperature the Earth reaches.
The “average” used in most radiation budget pictures is probably as misleading as the “average” global temperature. I would love to see an integration of the Earth’s radiation on a 24 hour period and then be able to compare those values on a day to day basis.
Wrong. The overall effect from more CO2 is more precipitation. In order to provide this beneficial result, there is a complex cascade of processes. Understanding this requires tossing away all your current beliefs. Are you ready?
What laboratory experiment places the CO2 above a large quantity of water? It turns out water is instrumental in how CO2 works in our atmosphere. I think you need a lesson in logic.
More CO2 in the troposphere causes a warmer troposphere which holds more water vapor and warmer oceans increase the amount of water that evaporates into the air.
So it would seem that more CO2 eventually causes more precipitation, But long term data are questionable.
What is precipitation trend?
Since 1901, global precipitation is claimed to have increased at an average rate of +0.04 inches per decade, while precipitation in the contiguous 48 US states has increased at a rate of +0.20
+0.04 inches per decade in the 12 decades since 1901 is about +0.48 inches more precipitation over 12 decades
The global average precipitation is about 39 inches per year now.
In 1901 it would have been about 38.5 inches. about 1.2% less
Was there an accurate global average precipitation measurement in the early 1900s? I doubt it.
There were Very few weather stations in the Southern Hemisphere
Not many NH weather stations outside US and Europe
And who was measuring precipitation on the oceans?.
False. You continue to ignore the combined effect of energy absorption and evaporative cooling. When you consider all of the effects, there is no warming or cooling just more precipitation.
Rightly so and most things are relative.
Science is not so emphatic as so many people act it out to be.
I’m heading eastward shortly and am looking forward to pondering the past heights of water in the Great Basin. There are many places where high water marks are still visible.
I shall also examine slip coefficients and gravity effects on several slopes along the way. Wanted to hit Mammoth Mountain but the most direct major highway to it from here is blocked by snow.
Advection is one out of five processes.
You get an “F”
What are the 5 processes of atmospheric heating?
The process of heating and cooling of the atmosphere takes place in four stages and these stages are radiation, conduction, convection, and advection. Radiation is the cycle by which sun-based energy arrives at the earth, and the earth loses energy to space.
What affects the Earth’s surface temperature?
Air and water temperatures are primarily determined by the amount of sunlight that is absorbed by the surface of the Earth, and the amount of heat that is re-radiated in the atmosphere by the greenhouse gases.
Richard Greene:
Correction:
Air and water temperatures are primarily determined by the amount of sunlight that is absorbed by the surface of the Earth. PERIOD.
Temperature is determined by both energy in and energy out.
When those two are balanced, temperature stays the same.
If energy in decreases but energy out stays the same, the object cools.
If energy out decreases, but energy in stays the same, the object warms.
Doing anything that affects either energy in or energy out, and you are going to change the temperature of the object.
Mark W,
Fine in theory, eminently arguable in practise.
Here is a 2011 graph showing how far apart the returns from different satellites were. Like about a spread of 13 W/m2, when researchers see significance in 0.1W/m2……………
The TOA radiative balance number is entirely dependent on adjustments to bring different satellites into line.
Now, where have we seen adjustments causing disbelief? Geoff S
GS said: “The TOA radiative balance number is entirely dependent on adjustments to bring different satellites into line.
Now, where have we seen adjustments causing disbelief?”
That’s how UAH does it too.
And that’s why the measurement uncertainty of even UAH is larger than the differences they are trying to identify. It’s like reaching into a black hole with your hand and trying to grab a 1mm bead. You have no idea where in that hole it is.
Building and operating cavity radiometers (technical name: absolute cavity radiometer, ACR) in orbit is not easy—there have been improvements since the 1970s but they are not perfect. On the ground they can achieve uncertainties of ±0.3-0.4% through the World Radiometric Reference (part of the WMO). The link between the WRR and basic SI units is still controversial, and could-might double this number (or not).
I’m not familiar with the differences between the ACRIM, VIRGO, and SORCE instruments, but they are fairly large (and difficult to track down). The graph shows a potential uncertainty of 13/1350 W/m2 or about 1%. For radiometric measurements this is still much better than thermopile-style radiometers.
The NOAA satellites apparently use tuned horn antennas to convert O2 microwave radiation to voltage. Assuming a similar total uncertainty for the end-to-end conversion to temperature in K, a ±1% uncertainty becomes about ±2.5K (at ~250K for the LT) — two orders of magnitude larger than what is usually claimed.
Wow! That is a large uncertainty interval and is another indication of the variance/Standard Deviation that the anomalies should be carrying.
It is what I am beginning to see in land measurements using the NIST Ex. 2 for calculating the variance surrounding a monthly mean temperature. Climate alarmists also forget that a monthly mean and a baseline mean are both random variables. When subtracting random variables, you should ADD the variances and not claim that the SEM of the anomaly average is the uncertainty in the temperature.
“ Like about a spread of 13 W/m2, when researchers see significance in 0.1W/m2……………”
<grin> You aren’t supposed to notice that!
And the amount of cooling too
Incoming energy and outgoing energy
You can’t have one without the other.
At least it’s something…
It is doubtful that Nut Zero will stop the rise of the atmospheric CO2 level, with over seven billion people, of eight billion on Earth, living in nations that could not care less about Nut Zero.
More CO2 in the atmosphere is likely in the future and more CO2 always causes a warmer temperature. But above 400ppm, CO2 is such a weak greenhouse gas that other climate change variables could easily offset the small warming effect of CO2.
The effect of CO2 from 2015 to 2023, despite the largest eight-year period of manmade CO2 emissions, was more than offset by other climate change variables. And that was long before much of Nut Zero was accomplished.
Here’s my wild guess:
Without Nut Zero:
More CO2 causes small harmless warming that could be offset by other climate change variables
With Nut Zero:
More CO2 causes smaller harmless warming that could be offset by other climate change variables
Bottom Line:
Nut Zero is a total waste of money, unless for some odd reason one prefers a less reliable electric grid with more blackouts. The unprecedented increase of mining and manufacturing required for Nut Zero will significantly INCREASE CO2 emissions, and that increase might never be offset by lower future CO2 emissions from the few nations that participate in Nut Zero: (Currently, the Nut Zero nations include less than one billion people out of eight billion people in the world, and they have low birth rates compared with non-Nut Zero nations).
My suspicion is that politicians are unacquainted with the concept of ‘the point of diminishing returns.’ They missed out on it by not taking Engineering 101. A business man who has to decide on how to spend capital is at risk of going out of business if he/she/it doesn’t understand the concept.
https://www.britannica.com/money/diminishing-returns
This would be an excellent article if it simply focused on the pause, which for reasons I will never understand, does not get very much coverage at conservative websites. It should be the top article of every month. The lack of coverage at leftist websites is expected.
The best ammunition to refute CAGW scaremongering is the pause, despite the largest amount of CO2 emissions in any eight-year period in history, and a century of 100% wrong scary climate predictions (as the actual climate improved — but no one ever predicts good news for the climate).
That very important pause message gets diluted by including two other subjects here: Climate confuser games and Nut Zero. Both additional subjects are not covered well.
The climate confuser games are just wild guesses. But those guesses are usually biased by an unlikely RCP 8.5 CO2 growth rate scenario. And further biased by claiming the process will take 200 to 400 years. Such a long warming process means one can not refute the models by claiming they have been inaccurate for the past few decades.
It would make a lot more sense to present the climate confuser games with a reasonable RCP 4.5 CO2 growth rate scenario, and only for 70 years in the future, which would be the TCS wild guess. The TCS with RCP 4.5 is for about half the warming rate of the ECS with RCP 8.5. A climate howler named Zeke H. did an infamous analysis using TCS with RCP 4.5 to “prove” climate models were accurate. They did appear to be accurate from 1975 to 2015. But Zeke got sideswiped by the 2015 to 2023 pause, showing TCS with RCP4.5 was NOT as accurate as he claimed it was.
A good argument could be made that only eight years of UAH numbers is data mining and also a short trend that has no ability to predict the future climate. Both claims are true.
A stronger argument, in my opinion, can be made that this pause is solid evidence that CO2 is not the temperature control knob. We already knew that from the 1940 to 1975 period, but that era is generally ignored by Climate Howlers — they are too busy spinning scary fairy tales about the future climate, as if they could actually predict the future climate.
It was a mistake, in my opinion, for the article to morph from non-Fiction average temperature data, into the fictional world of climate confuser games … which are just leftist propaganda tools used to create climate fear, which is used to control people. And then we have an unnecessary wild guess prediction for Nut Zero.
As of today, over seven billion people live in nations that could not care less about CO2 emissions, including China and India. The most likely result of Nut Zero (my wild guess) is a modest slowdown in the growth of CO2 levels in the atmosphere. Since more CO2 in the atmosphere will cause more global warming, although not much warming with CO2 already above 400ppm, it is possible that global warming will continue.
The average temperature is affected by many climate variables, so CO2 can rise at a rapid rate, as it did from 2015 to 2023, and the average temperature can decline. Rising CO2 and declining temperatures also happened in 1940 to 1975.
.
1940 to 1975 was later arbitrarily “revised” to be a nearly flat temperature trend: Solid evidence of government bureaucrat science fraud.
Surface average temperature numbers for 2015 to 2023 will eventually be revised to show a rising temperature trend. Not UAH — UAH is arbitrarily rejected by governments, because they can not control the data.
The surface global average temperature is whatever government bureaucrats want to tell us it is. Their numbers do not have to represent reality, and they don’t represent reality from 1940 to 1975. And their numbers will be “revised” at will. long after the original measurements, if “revisions” better support the climate change narrative. That has already happened. Proving that climate change is mainly politics, not mainly science.
Mr Greene is, as usual, either inadvertently confused or deliberately confusing.
First, he complains that the head posting mentions two subjects: the new Pause and the infinitesimal global warming that would be prevented even if per impossibile the whole world were to attain net zero emissions by 2050. If all he had wished to read about was the Pause he could simply have stopped reading at the appropriate point.
Secondly, he wonders why other skeptical websites do not mention the Pause. One reason is that they do not have, as I do, a program that takes the data and automatically plots any desired period, automatically calculates the least-squares linear-regression trend and then plots that in its correct position on the graph.
This particular Pause is in any event probably nearing its end, since el Nino conditions are reasserting themselves. However, the existence of so many long Pauses in the recent temperature record is a useful method of demonstrating that global warming is not occurring at anything like the originally-predicted rate.
Thirdly, Mr Greene has overlooked the beauty of Socratic elenchus, the method in formal logic by which the head posting demonstrates that, if one accepts ad argumentum that the mainstream, midrange estimates of key climate quantities published by official climatology are correct, it follows that the answer to Senator Kennedy’s pertinent question is that if the U.S. actually achieved net zero emissions by 2050 global temperature would be only one-seventieth of a degree less than on business as usual, and that if the whole world achieved net zero less than a tenth of a degree of future warming would be prevented.
Fourthly, Mr Greene allows the usual suspects to get away with presenting multiple emissions scenarios as the bases for their predictions, so that regardless of outturn they can claim that on one scenario or another their predictions have been validated. The head posting takes a far more rigorous approach. It looks at the four original emissions scenarios in IPCC (1990) and then applies a straightforward test to establish that Scenario A, the business-as-usual prediction, is closest to reality and is, therefore, the scenario against which the predictive skill of official climatology should be judged. It is the Scenario-A-based midrange warming prediction of 0.3 K/decade, or 3 K/century, or 3 K equilibrium doubled-CO2 sensitivity, that continues to be the midrange prediction today. Yet in reality, as the UAH trend shows, the true decadal warming rate in the third of a century since 1990 is 0.136 K/decade.
Fifthly, Mr Greene says that taking only eight years’ temperature data (actually nearly nine years) is “data mining” or cherry-picking. No: as the head posting states, the end date is the present and the start date is the earliest date that gives a zero trend up to the present. It is what it is.
Sixthly, Mr Greene says one cannot extrapolate from the current zero trend and assume that trend will continue. Yet the head posting makes no assertion that the current zero trend will continue, and no assertion that the lengthening Pause has any predictive value.
Seventhly, Mr Greene says the head posting makes a “wild guess” about nut zero. Yet it makes no guesses at all. It takes mainstream, midrange data and simply calculates how much – or, rather, how very, very little – global warming would be prevented even if the whole world (or the United States on its own) actually went to net zero by 2050. And then it is shown, by a simple calculation, that every $1 billion spent on attempting to get to net zero would prevent only one ten-millionth of a degree of global warming by that year. Even if one fudged the numbers by as much as an order of to favor official climatology, it would not be at all worthwhile to do anything whatsoever about global warming, except to let it happen and enjoy the sunshine.
Eighthly, Mr Greene fails to realize how powerful is the demonstration that warming prevented even by global net zero would be infinitesimal as a way of drawing politicians’ attention to the absurdity of squandering hundreds of trillions on achieving practically nothing. I tried out this argument in Parliament the other day, compelling a true-believing MP to change his position on the basis that spending trillions to achieve a barely measurable change in global temperature was pointless, particularly at a time when the national debt is so absurdly out of control. The economic arguments are much easier for politicians to understand than the scientific arguments.
I didn’t have time to read this response but a short simple article on the pause would have been the best climate article in the world published today.
The other subjects included here dilute the very important pause. You say I should have stopped reading. I never stop reading an article if the beginning is good enough to recommend on my climate science blog. So I finished reading and I did recommend this article on my blog. You should have stopped writing and started a second article on the climate confuser games and Nut Zero.
Honest Climate Science and Energy Blog
I agree with almost everything you write but I don’t like too many subjects covered in one article. And I completely reject all climate predictions — humans can not predict the climate, and you are a human, so there is no logical reason to believe your predictions (even though they are more reasonable than most predictions), or for you to make predictions of the long term future climate.
The following statement is your speculation — nothing is “shown” or proven. No one knows how many trillions of dollars will be wasted on Nut Zero and no one knows how much Nut Zero will affect the climate.
To claim the answer is ‘SHOWN” by a “SIMPLE CALCULATION” is claptrap.
Not one person knows how much will be spent on Nut Zero, what it will accomplish, if anything, besides wasting money, or even whether the climate will be warmer or cooler in 100 years.
“And then it is shown, by a simple calculation, that every $1 billion spent on attempting to get to net zero would prevent only one ten-millionth of a degree of global warming by that year.”
The primary problem with climate change is wrong climate predictions stated with great confidence
The last thing we need is more climate predictions stated with great confidence, except my own 1997 prediction:
“The climate will get warmer, unless it gets colder”.
Nobel Prize pending
Mr Greene continues to miss the point. He should perhaps read an elementary textbook of logic. The head posting makes no predictions: however, it calculates and states, correctly, that if the relevant mainstream, midrange quantities supplied by official climatology and reproduced in facsimile in the head posting are correct the warming prevented by global net zero will be less than 0.1 K, the warming prevented by U.S. net zero will be less than 1/70th K, and the warming prevented by each $1 billion spent on attempts to attain net zero emissions will be less than one ten-millionth of a degree.
Even if one altered that result by an order of magnitude in the direction of what official climatology wants us to believe, it would still be pointless and cripplingly costly to attempt to get to net zero emissions.
If Mr Greene would prefer to substitute other values for those shown in the head posting, he is free to do so. But, like it or not, those are the midrange, mainstream values, from which the calculation in the head posting follows.
“The head posting makes no predictions: however, it calculates and states, correctly, that if the relevant mainstream, midrange quantities supplied by official climatology”
The average temperature numbers are non-fiction and important
The Nut Zero wild guess numbers are data free fictional predictions. and could be the subject of another article.
Mixing multiple non-fiction and fiction subjects in the same article is a writing error.
Nevertheless, I included your article on my list of 24 recommended climate and energy articles I read today in spite of my criticisms. It was the best article on the pause I could find. Also the only article on the pause I could find, and that disturbs me. The eight years and nine months without global warming, as the Climate Howler Global Whiners are more hysterical than ever, should be the headline on every conservative climate and energy website. This pause news should be in the mass media too — at least on the Tucker Carlson show. Honest Climate Science and Energy Blog: The best climate science and energy articles I read today, April 4, 2023
PS: I was really disappointed that you didn’t call me
a climate communis t
You are not understanding the post
If I did not understand the article, then it was poorly written
There is the pause subject
(non fiction, with data)
There is the Nut Zero subject
based on wild guess speculation
(fiction — no data)
The fiction and non-fiction should not have been combined in the same article.
if you think I didn’t understand the article, explain it to me in one or two sentences.
Foot, meet shotgun blast.
Please cite the peer-reviewed scientific paper that concluded that out of the 8 billion people on Earth, the criterion for deciding whether an article was “well” or “poorly” written is :
“Does Richard Greene understand it ?”
NB : I am aware that it wasn’t your intention, but with your lofty and condescending bald assertion that is exactly how you are coming across.
I wrote articles for 43 years as editor of the ECONOMIC LOGIC newsletter. I currently find and read 48 articles every morning to recommend on my blog. There are other articles I start reading and don’t finish. That’s four hours of reading articles every morning. That’s over 17,000 articles a year. I know the difference between a well written article and a poorly written article from my vast experience. Your experience is half vast.
I complement the good authors here and recommend their articles on my blog. I criticize those articles that could have been better. Monckton used to write a short article on the pause. It was perfect. Now he throws in everything but the kitchen sink.
I did not know that.
We are both, like the vast majority of posters here, (fully- or semi- …) anonymous.
How can you possibly “know” what my level of “experience” is … in any domain ?
This is exactly what linear regression does. Unless the underlying factors are known, all a regression tells you is what has already happened but never tells you what might happen. Any other conclusion is simply one’s mind fooling one into believing that the regression is an accurate predictor.
What one can take away from a pause is that CO2 is not the biggest nor the only factor determining temperature. Period. There are an unknown number of factors, all interacting that will determine what occurs in the future. Think chaos.
When leftists see the pause chart, they claim it is just a short term trend and a short term trend can’t be used to predict the future climate. Both claims are true. When I see the chart I note that CO2 is not the climate control knob, as already demonstrated in the 1940 to 1975 period. although with smaller CO2 emissions back then.
In fact, if you look back at the period since 1910, even a PRIOR 30 to 50 year climate trend was worthless for predicting (extrapolating) the climate in the NEXT 30 to 50 years. In fact, after 30 to 50 years of warming, you would be better off guessing the NEXT 30 to 50 years would NOT be a warming trend, and vice versa. Sort of a regression to the mean effect.
Please show the evidence suggesting this is a short term ”trend”
Climate is a 30 year or longer trend (average)
This chart is 8 years and 9 months
8 years and 9 months is a short term trend
If you are forecasting the inventory in your hardware store would you use a 30 year linear regression trend or a linear regression over the past 2-5 years?
Or even the last 12 months. Who cares what the store sold even a decade ago?
Ever since ASOS has been implemented land temps have been available on a sub-hour basis. Why has climate science not started doing actual integration on these curves to obtain a real 24 hour average? That could then be used to obtain a better recent depiction of what is happening.
There is no scientific excuse for retaining traditional methods while ignoring better and more accurate methods.
I raise all the prices by 25% and then announce a 25% off sale.
A ”term” is a fixed period. When the temps go up again the term will have ended.
When temperatures are in pause or even falling, it’s always because of short term climate cycles.
When temperatures are going up, it’s 100% because of CO2.
Amazing how climate cycles only cool for a short period, then go away until the next time when they cool for a short period.
“ I tried out this argument in Parliament the other day, compelling a true-believing MP to change his position on the basis that spending trillions to achieve a barely measurable change in global temperature was pointless,”
How were you able to do this since you are not a member of Parliament? In fact this statement would appear to breach the ‘cease and desist’ order by the Clerk of Parliaments telling you to stop implying that you are a member of the House of Lords.
“Phil.”, who posts here furtively so that he, she or it cannot be identified, here breaches the rules of this site by making an off-topic, personal attack.
The Clerk of the Parliaments who wrote that silly letter to me about a decade ago is no longer Clerk of the Parliaments. The current Clerk’s office has now tacitly accepted that I am indeed a Peer of the Realm and, thereby, a member of the House of Lords (albeit without the right to sit or vote).
My letters patent make it clear that I am entitled to “a seat, a vote and a voice”, and they have not been repealed. They can only be repealed by a special Act of Parliament. There has been no such special Act. They cannot be repealed by a general Act, such as the 1999 House of Lords Act. However, the courts will generally not intervene in the processes of Parliament, so, although the 1999 Act is illegal, there is no mechanism by which the illegality can be redressed.
I did indeed speak to an MP in Parliament some weeks ago, and he has now realized that his former position on the climate change question is untenable. Get over it.
However, the courts will generally not intervene in the processes of Parliament…
Yes, that is in the Bill of Rights, if I remember rightly, 1688, which has a clause excluding that. This was also the reason why the Supreme Court’s ruling on Johnson’s Prorogation struck many, including me, as being as legally improper as it was politically motivated.
““Phil.”, who posts here furtively so that he, she or it cannot be identified, here breaches the rules of this site by making an off-topic, personal attack.”
Actually you appear to be making the personal attack here.
I made no such attack, you claimed to have been asking questions in Parliament, I asked how you had done so since you have no status to be able to do so. Your letters patent does not entitle you to “a seat, a vote and a voice”, that would require a Monarch’s writ of summons, something you have never received. You are not a member of the House of Lords and you were told to stop claiming to be one over ten years ago, get over it yourself.
Butthurt
“Secondly, he wonders why other skeptical websites do not mention the Pause. One reason is that they do not have, as I do, a program that takes the data and automatically plots any desired period, automatically calculates the least-squares linear-regression trend and then plots that in its correct position on the graph.”
I’m sure most people who read this blog have such a program. It’s called Excel
However, it demonstrates clearly the poor correlation between the monotonic increase in CO2, and global temperatures short-term, suggesting that it is a spurious correlation. Who can explain why there isn’t better short-term correlation between the two? Do a little reading on spurious correlations. The best test for actual cause and effect relationships is differencing, or taking the first derivative, to see if the apparent correlation continues. Calling it “natural variability” is a cop out that doesn’t explain anything.
Mathematical mass turbation
Your comment is spurious
CO2 always inhibits cooling
That means the planet gets warmer than it would have been if more CO2 is added to the atmosphere. the effect may be small and harmless, but it exists.
But CO2 is NOT the only climate change variable.
My own list has nine.
Climate change is the NET result of EVERY climate change variable: Global regional and local variables.
There is no reason that any ONE climate change variable should be expected to “control the climate”, and no evidence that any ONE variable does that.
The following variables are likely to influence Earth’s climate:
1) Earth’s orbital and orientation variations
(aka planetary geometry)
2) Changes in ocean circulation
Including ENSO and others
3) Solar energy and irradiance,
including clouds, albedo, volcanic and manmade aerosols, plus possible effects of cosmic rays and extraterrestrial dust
4) Greenhouse gas emissions
5) Land use changes
(cities growing, logging, crop irrigation, etc.)
6) Unknown causes of variations of a
complex, non-linear system
7) Unpredictable natural and
manmade catastrophes
8) Climate measurement errors
(unintentional errors or deliberate science fraud)
9) Interactions and feedbacks,
involving two or more variables.
“That means the planet gets warmer than it would have been if more CO2 is added to the atmosphere. the effect may be small and harmless, but it exists.”
The warmer the planet gets the higher the rate of radiation becomes. That means it cools *more*. If the temperature at sunrise is 10C the rate of heat loss will be higher than if the temperature were 9C. It’s going to continue radiating at a higher level.
It’s not obvious how CO2 raising the minimum temperature will make the planet “warmer” other than raising the averages used by the climate alarmists.
A warmer TMIN results in a warmer average temperature
Seems like good news to me.
Senator Kennedy is no country bumpkin, even though I’m sure many of the East Coast Elite sniffily think so. He always comes through in these hearings by asking the most pertinent questions, those questions that the leftwing extremists either don’t have the cognitive ability to ask or the chops to ask. It might be that no one wants to know the answer about how much temperatures will be cut because it’s a pittance. Ask Lomborg.
We could do worse than having 534 others in Congress to sort out the issues like Kennedy does.
It takes a special person to fairly follow logic to its conclusion and act on it at the risk to his and his family’s social and economic wellbeing in the face of a mob that can and will cancel him. This Constitutional Republic has degenerated into mob rule by allowing special interests to subvert government actions in regards to longstanding Constitutional and legal interpretations.
My God! The various levels of government are now forcing presumably free citizens with Constitutionally protected rights to call men women and vice versa by the use of force under tyrannical laws. Supposedly free people are now being forced to sign “loyalty oaths” relating to race and sex in both government and private employment venues, describing how they have and will continue to overtly fight for Marxist DEI causes.
Regarding the costs, much as I think you are in the ballpark, we should avoid the same gigantic error/lie made by the warmistas and look at the cost compared to what we would otherwise do.
Going down the net zero path (which I regard as ludicrous based on the availability of raw materials to do so) we would save the cost of building alternative energy generation at the very least.
The tallying up of just one case costs then claiming it is the actual cost of going down that path is deceptive, dishonest and a habit to be damned.
An honest assessment of the costs would build the alternative, then reduce the cost of net zero by that amount.
We have a great case already, we don’t have to fall into the same deceptions the warmistas love to do.
In response to Dean S, the cost of net zero as given in the head posting is understated by at least half. The UK grid authority has estimated that just re-engineering the grid to get to net zero would cost $3.6 trillion, and the grid represents only a fifth of UK emissions, implying an $18 trillion total cost of UK net zero. Since the UK represents only 1% of global emissions, the global cost of net zero would be $1800 trillion. I have written that down to $900 trillion for the sake of caution. That is why each $1 billion spent on net zero would reduce global temperature by no more than – and probably a lot less than – one ten-millionth of a degree.
Dean, you miss the central point of Nut Zero: We must destroy existing, operating infrastructure with 40+ years of life remaining to replace it with infrastructure having lives of at least half that. The human, social (freedom-related) and economic costs are incalculably tremendous. Not all costs are monetary.
When we recognize that the effect of the present mild warming is net beneficial for at least a few degrees more than we have seen, it should be understood as the most expensive counterproductive boondoggle ever proposed in all of human history.
Holocene Climate Optimum
from 5000 to 9000 years ago
= at least +1 degree warmer than today,
claims the IPCC
But +1 degree warmer than today in the future
will be a climate emergency,
claims the IPCC
The IPCC contradicts itself.
The human race died out during the Holocene Climate Optimum, din’cha know?
And we will die out at +2.0 degrees C. too
At +1.5 degrees C., shoe soles will melt on asphalt roads,
so I am investing in asbestos sole shoes.
Monckton of Brenchley, thank you for this update and for highlighting the clarity with which Senator Kennedy posed his questions.
And yes, your computations show the insanity of “net zero” plainly, if only the message can get through the thick fog of confusion.
Mr Dibbell is right: Senator Kennedy is an ornament to the legislative process.
“The end date is the present; the start date is the farthest back one can reach and still find a zero trend. It is what it is.”
Always good to have the direction of time confirmed. I’ll have to bookmark this against the next person who insists that Lord Monckton’s pauses start at the present and end at the start point.
“The start and end dates of the New Pause are not cherry-picked.”
The start point is chosen as the furthest back one can go in order to find a zero trend. Choose a different start point and you can find a much faster rate of warming. Which one do you pick to illustrate your point?
Which one do you pick to illustrate your point?
Well, I guess if you ”picked” a different start point you would not have a zero trend. As the topic of this story is looking for a zero trend, then the start point that shows that, is the one you are looking for.
I don’t even know why I am even trying to answer your inane question.
Bellman, like the rest of the warmunists can’t find a reason to criticize starting with the most recent data and counting backwards in time. So they have to pretend that everything is cherry picking so that they can criticize it.
“As the topic of this story is looking for a zero trend, then the start point that shows that, is the one you are looking for.”
Exactly. You want to find a trend that supports your headline, so look for the starting point that will give you it.
Obtuseness profound…. Except going backwards from the present to find the point where a zero trend stops, is not a cherry pick as you infer.
Exactly. It is not a cherry ”pick” if there is only one cherry. I am beginning to think Bellman is blinded by his own obstinance. Very telling..
I was implying it. And he’s not finding where it stops, he’s finding where it starts.
No, he is finding how long it has lasted. He is not finding when it started or when it stops. He is just asking, if there is one, and its in effect now, how long has it been in effect for?
Perfectly reasonable question. Eg, accident rates seem to have levelled off. Really? Fr how long have they been flat. then?
“No, he is finding how long it has lasted. He is not finding when it started or when it stops.”
How on earth do you know how long has lasted if you don’t know when it started?
“Perfectly reasonable question. Eg, accident rates seem to have levelled off. Really? Fr how long have they been flat. then?”
A perfectly reasonable question and one you need to answer in a reasonable and skeptical way. First, are you sure accident rates have leveled off, or is it just the result on natural fluctuations in the data? Can you identify a consistent start point for this leveling off, or are you just going to look for the month that gives you the longest zero trend? Does your start point change each month? Does it produce an unexplained jump compared with the previous trend? Did anything happen around the time of your start point that could explain the leveling off?
“he’s finding where it starts.”
Yes, you poor mental midget..
By calculating backwards from NOW.
I keep asking, but what do you think “calculating backwards” actually means? Describe the algorithm and point out where the backwards part comes in. Then explain why this makes it any different to the process calculating forwards.
I can do it in either direction and I will always get the same result. If you want to find the start month which produces the longest non positive trend you have to test every month. If you start at the first month and work forwards you can stop as soon as you find a non-positive trend. If you start at the end and work backwards you have to keep going until you find a positive trend, but you then have to keep going back further in case that positive trend isnt a blip.
Bellman,
What does counting backward really mean? A lot actually.
Recent data should be weighed much more than data from 100 years ago when determining what will happen tomorrow. Where do you think the phrase, “What have you done for me lately” comes from?
Look, I’m not saying upcoming months will remain at exactly the trend line CMB shows. However, it will take a large change to end the pause in one month. It will take several more months.
I keep seeing “wait for El Nino”. That very well may raise global temps. But, you then have to ask what is the mechanism that raises ocean temps to an El Nino level. Is it CO2? Highly unlikely. Then why the rejoicing when it comes and raises global temps? It proves nothing by itself and only shows that the global temp is unsatisfactory for predicting why there is CAGW.
“Recent data should be weighed much more than data from 100 years ago when determining what will happen tomorrow.”
As I keep asking Tim, what weighting function do you think Monckton is using?
Nobody is trying to predict tomorrow’s temperature. Nobody claims the pause trend is something that will predict the future, Monckton certainly doesn’t claim that. The only prediction being made by Monckton is based on the unweighted trend since 1978.
If you weigh the data so that more recent data is weighed higher, then you are likely to get a slightly faster warming rate.
“However, it will take a large change to end the pause in one month. It will take several more months.”
Agreed. It could last for years. If it goes on long enough it might actually mean something, and that’s when you can start to ask questions about it. So far the only question I have about the period is why it’s so much warmer than would have been expected given the previous trend.
“I keep seeing “wait for El Nino”. That very well may raise global temps. But, you then have to ask what is the mechanism that raises ocean temps to an El Nino level. Is it CO2?”
No. As far as I’m concerned it’s just a semi-random fluctuation in the long term trend. Global warming doesn’t cause El Niños, but it may mean that the peak of an equivalent El Niño will be higher, and La Niñas will not be so cold.
“Then why the rejoicing when it comes and raises global temps?”
Why would anyone rejoice. Most people don;lt want higher temperatures.
“It proves nothing by itself…”
Exactly But you can;t have it both ways. You cannot say we should ignore an increased warming rate caused by a trend ending just after a spike, whilst at the same time saying a trend that is lower because it starts with spike is proving something.
It would be interesting to see if the long term trend, or the pause was a better predictor of the following month or months. At present though their forecasts are nearly identical. Probably other the cause of the pause, the pause trend would have been more successful, but only because it would have predicting warmer temperatures.
You are approaching the point of being laughable. Why are you so concerned with start and end points? The article demonstrates the ongoing absence of global warming over consecutive years. How else should it be done?
“Why are you so concerned with start and end points?”
Because when looking at such a short period the choice of start point can mean the difference between zero trend, accelerated warming or dramatic cooling, even though you are using practically the same data. Any inference you draw from a carefully selected start date is likely to be meaningless unless you can back it up with a good reason for selecting that point. “It gives me the trend I was looking for” is not a good reason.
“The article demonstrates the ongoing absence of global warming over consecutive years.”
Except it doesn’t. As I’ve pointed out before, the overall trend has actually increased since the start of the pause. The zero trend is just a consequence of starting just before a large rise in temperature.
“How else should it be done?”
With a degree of skepticism. First state your hypothesis and then see if there is sufficient evidence in the data to reject the null-hypothesis. For example, if you are claiming that the warming rate after 2014 has declined, let alone stopped, you need to show that the trend over that period is significantly different to the previous trend.
Or you can use statistical techniques to discover the best candidate for a change in the trend, but that still requires showing that the change is significant.
Because when looking at such a short period the choice of start point can mean the difference between zero trend, accelerated warming or dramatic cooling
LOL…. BUT THERE IS NO CHOICE… How thick do you have to be to not see that a zero trend from the present has to stop at a single point of time in the past!!!
The choice is to believe that this one starting point is the one that matters. That it is telling you something important and worth writing a length blog post about, every month.
Bellman thinks that if you backtrack a dead deer’s path to find where he was shot that you are cherry picking the point at which he was shot. I’m *not* kidding. He actually stated this on an earlier thread on the same topic.
A clue to the usefulness of Monckton’s dead deer strategy is that he comes up with a different answer every month.
“Time marches on!”
But dead deer don’t.
Either Bellman doesn’t understand simple logic, or he’s hoping everyone else doesn’t.
Bellman is a believer. No amount of logic can penetrate.
Either that, or I understand simple statistics.
“Figures don’t lie, but liars can figure.” From somebody calling himself Mark Twain.
That might be your opinion of Monckton, but I couldn’t possibly comment.
It’s our opinion of you. Monckton is using your math…you don’t like the results.
That’s libelous. Monckton is quite capable of using his own maths without my help.
Your climate math indeed 🙂
The same maths Monckton purports to use.
There was a time when he understood the dangers of selecting the start point of a graph to make it go in the direction you wanted. But as so often he only sees this as a problem when others do it.
You just refuse to understand that backtracking to find a start date is *NOT* choosing a start date.
Do you have a mental block of some kind? Or is it just a lack of real world experience?
If you want me to understand what you are claiming, you need to exp,lain yourself better, rather than repeating the same insults. Your distinction between “finding” and “choosing” is just philosophical nit-picking.
If I want to choose the best cherry I first have top find it. If I find the best cherry I have to choose to pick it.
No nit-picking.
You find a dead deer. You can choose different spots to see if you can find where the blood trail starts or you can backtrack from the deer to find out where the blood trail starts.
One is “choosing” and one is “finding”. And your fevered mind can’t seem to distinguish between them!
“You find a dead deer.”
Which is your first problem. You haven’t found a deer. That’s what you are trying to establish. It’s your hypothesis that there exists a dead deer, and the purpose of the statistical analysis is to see if it is probable that such a deer exists.
“One is “choosing” and one is “finding”.”
Your distinction is that “choosing” means only looking at few spots, where as “finding” means looking at every spot and choosing the best one. Hence, finding is just a more careful way of choosing the best point.
If you are tracking a blood trail that’s a good thing. Cherry-picking is often what you want to do – find an optimal point. But if you are trying to find a trend in fluctuating data, it’s bad thing. It will always give you the trend you want whether it’s meaningful or not.
If you want to find an optimal spot for a change in trend, you need to do it objectively. (Remember that kink stuff you were so keen on a little while ago.) But even then, just because you’ve found an optimal spot doesn’t mean it’s significant.
But if you don’t like calling it a cherry-pick, let’s call it the start-point fallacy. As a well-known mathematician puts it
“If you choose your start point and your endpoints carefully “
So what? Who is *choosing the start point? If you use the last data point as the beginning then you haven’t “chosen” anything. You are just using the last data point. And then you FIND the start point.
Go away troll. You are just making a jackass out of yourself pretending you can’t tell the difference between the two scenario’s.
“Who is *choosing the start point?”
Lord Monckton. “the start date is the farthest back one can reach and still find a zero trend.” You can’t get much more careful than looking at every point until you get the one you want.
“If you use the last data point as the beginning then you haven’t “chosen” anything.”
You are not using the last point as the beginning. The trend starts at the beginning, the very point you have carefully chosen.
Here’s what Monckton says of it
In that case he’s talking of his own set of graphs – keeping the end point at the present, but selecting shorter starting points, 4 or 8 years.
If a linear regression is valid for going in a forward direction in time. What is wrong with doing a linear regression backward in time to find a pause.
You’ve already stated you don’t expect a forward regression to be a set in stone prediction. Okay. Why would finding a flat regression going backwards in time from NOW be invalid? It is using data that HAS ALREADY OCCURRED.
There is no prediction or guessing involved.
A regression toward the past can be used to assess how factors might be interacting. Your whole argument is specious and without merit.
“If a linear regression is valid for going in a forward direction in time. What is wrong with doing a linear regression backward in time to find a pause.”
Nothing whatsoever. There is no time in a linear regression, just a correlation between a dependent and an independent variable. In a time series the independent variable is time, but it has no direction. You can enter the data in any order you want, the regression will be the same.
Maybe you mean that you could work out the regression one point at a time, going backwards? Yopu could do that, and maybe it would be slightly more efficient than simply calculating the regression form a different starting point each time, but given the time it takes to just repeat the function for each possible starting point is less than a second, it doesn’t seem worth the effort.
In any case the problem still remains. If you calculate each possible start point going backwards, how do you know when you have found the best starting point.
All your trends may be negative. Then you find a start date that is positive. But you can’t stop there, because going back a few more years might result in the trend turning negative again, and the object is to find the earliest starting point.
“It is using data that HAS ALREADY OCCURRED.”
All the data is data that has already occurred. It doesn’t matter what direction you are thinking time is running.
I was just going to sit here and watch you blokes go at it hammer and tongs again, but…
You might like to reconsider or at leas rephrase that. The order is critical in a time series. It would be something else otherwise.
Yep. Isn’t iteration wonderful? Just iteratively work back through the data set with your OLS regression, and successively flag the earliest point which gives a non-positive trend until the data set is exhausted.
It’s all just fun with regression.
Given that the data set is quite noisy, there are any number of time series which can be played with. I particularly enjoy the trough-to-trough and trough-to-peak examples to “prove” that the slope is increasing, the “longest pause”, and “longest decline” which can be “teased out”.
There is probably much mirth and merriment to be gleaned from playing with comparing variance for various equal time periods as well.
“The order is critical in a time series.”
Could you explain why. I keep hearing about the magical properties of time running backwards, but nobody explains exactly what they mean by it.
In this cas Jim Gorman seems to be talking about the calculation of the trend line, but there is no order in that. It’s a simple calculation comparing individual time stamps to their specific data.
Obviously, if you reverse the order you will invert the slope, but that’s not what you wrote. Entering the data “in any order you want” implies it can be randomly ordered.
“Entering the data “in any order you want” implies it can be randomly ordered.”
Which is what I intended to say. By the data I mean pairs of time and temperature. Look at the equation for a least square linear regression
https://en.wikipedia.org/wiki/Ordinary_least_squares
There is no order. Just the sums and products of the variables.
Maybe what you and Jim have in mind is the circumstance where you just look at the sequence of temperatures as a time series, and the x values are just derived from the order of the values. In that case, yes you need to enter the values in the correct order. And in that case you could enter them in reverse order and get a reversed slope. I’ve really no idea why you would do this or what point it would make. All it would mean is that any positive trend becomes negative and any negative one becomes positive.
It certainly isn’t what Monckton is doing.
Cheez, all I meant was start at the present and put entries in from the past until the regression line was no longer flat.
You don’t even need to use a date, a simple series starting at 1 will suffice. It is the order that counts. The dates tell you nothing except the order that the y-values occured. As I have said, the “time” doesn’t determine the dependent value. It is worthless except as a method to order the data.
It is a time series, not a linear regression of a functional relationship for god’s sake.
Almost, but not quite. There is also an assumption of equal time steps.
Equal increments on the x-axis, such as integers will suffice as long as the data on the y-axis is collected in equal time increments.
You also need to check the scale. You don’t want to be treating the rate of change per day as rate of change per year.
“””””as long as the data on the y-axis is collected in equal time increments.”””””
This is all that is required to obtain an equation for a linear regression.
You can label the x-axis anything you want. Integers, days, centuries, muffins, frogs, etc. The slope of the line will be (y units)/x units.
Why do you think we say it is not a way to define a causal relationship. The x axis is basically meaningless. The values are only useful to indicate how many intervals of data there are.
Yes, provided those x-axis increments represent equal time steps. One example might be daily data where no obs were made on the Sabbath or public holidays. You have to handle the missing data somehow.
“Cheez, all I meant was start at the present and put entries in from the past until the regression line was no longer flat.”
Good. That’s what I was guessing when I said “Maybe you mean that you could work out the regression one point at a time, going backwards?”
But I still don’t see why you would do that when it takes no time to just work out the trend to the present starting at each point. And if you did do that you would not be getting the correct start date, if the trend goes positive at some point but returns back to negative at an earlier point.
And I still don’t see why you think this makes any difference to the idea that the start point is carefully chosen. If you get the same answer searching forward as backwards, how is one legitimate and the other a statistical lie?
“You don’t even need to use a date, a simple series starting at 1 will suffice.”
Yes, that’s what I wondered in my comment to Old Cockney. It’s just that if you do that backwards you will get the reverse trend, warming becomes cooling, cooling becomes warming. Again, no idea why this is regarded as a sensible alternative to just running the lm function for each point.
“It is a time series, not a linear regression of a functional relationship for god’s sake.”
Nobody is claiming it’s a functional relationship. If it were, then the claim of a pause would be easy to test. It’s the fact that the time series goes up and down that makes it more difficult to know when and if it has sped up or slowed down.
‘ang on there me old china. I weren’t born within earshot of the Bow bells.
Sorry, cock.
That’s even worse.
I can’t stop laughing now, bugger you.
It’s down to a wry smile now.
Well done, sir.
From https://en.wikipedia.org/wiki/Time_series:
But, yes, in this case it is essentially OLS regression and pairwise data could be entered randomly. Computationally, that is extremely inefficient, but it could be done.
What CMoB is doing, and it is correct, is starting at the current date/temp par and incrementally prepending 1 earlier pair of data points, then holding the lowest dated pair which has a non-positive slope.
Oh, and I should have noted that it is essentially a subsetting exercise, where the contiguous subset is expanded by 1 element until it reaches the full set.
OLS regression is exactly what Monckton uses. I don’t really care about efficiency given my laptop can give me the trend for every starting month in UAH in about 0.3 seconds.
“What CMoB is doing, and it is correct, is starting at the current date/temp par and incrementally prepending 1 earlier pair of data points, then holding the lowest dated pair which has a non-positive slope.”
Has he ever said that’s what he’s doing?
Bloody Java programmers 🙁
Not if I can help it.
That’s a point in your favour.
Gosling’s concept was good, but it hasn’t quite worked out.
We’re already way off topic, so why not a bit more?
What are your preferred languages , and do you actually get to use them professionally? A lot of places mandate a particular language set and coding style.
Professionally I was mainly working in C/C++. For fun and personal use my favorite at the moment is Kotlin. But for most of the stuff I do here I’m using R, which certainly isn’t my favorite language but is the most useful for testing ideas out on the fly and generating graphs.
I gravitated into system-level work (system admin, systems integration, network programming, systems architecture) so tended to work on remote management of distributed server networks rather than userland programming.
Working with puppet was interesting, because that’s a functional language and a nice change from the usual procedural languages.
I really should take a look at R – that seems to be quite good for statistical work.
I am not a fan of Java. I had to learn it in college, but that’s as far as I went. In my early days I actually had to maintain a custom analog-to-digital converter written in Pascal. Those days are long gone. Good times 🙂
Java as a language is a close relative of C++ (may Stroustrup rot in the 6th circle). It tends to be the VM implementations which cause problems.
Pascal is nice, but a bit limited. It’s a good learning language to introduce CS students to the Algol family of languages before being dropped into the mysteries of C. Wirth did some nice work – Modula-2 is interesting, but I haven’t paid much attention to his more recent work.
Despite ribbing bellman about efficiency, I’ve done a lot of Perl for smaller tasks, especially those involving regex handling.
Perl can do a lot. I used it in the 80’s to create and analyze a database consisting of all the interconnecting trunk groups among central offices is a state so usage forecasters could use to validate their forecast. It isn’t the fastest at doing many tasks but it will do the tasks.
Perl is great. It was our mainstay for analysis work and a lot of the init scripts and cron jobs. Python seems to have largely taken over from Perl now. If only Guido hadn’t set technology back 40 years by making indentation levels count.
The in-built regex handling is just the shot for many tasks, and associative arrays/hashes are indispensible for a lot of tasks.
Some things are so obvious that they don’t need to be explicitly stated.
Still, it’s a fair cop. It’s the obvious approach, but non-CS people can write some horribly convoluted code – just look at the “Harry README” code.
Now that’s not even cute. Play again some other time, Bellman.
”Which one do you pick to illustrate your point?”
God spare us… There is ONLY ONE TO PICK.. get it yet!!????
Spoken like a true believer. Yes if you need to convince yourself that there is a pause you must only pick the start point that gives you a pause and hide your eyes from any other point that might test your faith.
Seriously, why do you think the trend since July 2014 is so important there has to be a length article about it nearly every month, yet the trend since July 2012 is of no interest?
”Yes if you need to convince yourself that there is a pause”
What? Convince? The temperature of the lower troposphere is not and has not increased for several years. Before that, it was increasing (for a time). Now….isn’t. Are you denying these are facts? A simple yes or no please.
”you must only pick the start point that gives you a pause and hide your eyes from any other point that might test your faith.”
I’m sorry, I must have been speaking Martian. If you want to show there has been a pause (however long or short) you need to point out the pause. As for hiding my eyes, I can’t believe my ….. eyes at the moment.
”Seriously, why do you think the trend since July 2014 is so important there has to be a length article about it nearly every month, yet the trend since July 2012 is of no interest?”
Because the pause goes against everything the climate establishment is claiming. Because 9 years of temperature fall as co2 rises is not insignificant, and proves beyond any doubt that at the very least, Earth’s climate system is ill-understood by the ”modelers”.
“The temperature of the lower troposphere is not and has not increased for several years.”
Except it has. It increased this month. It increased a lot in 2016. It’s always going up and down.
What the linear regression is meant to do is give an indication of the overall trend – it’s the best fit (subject to how you define best fit) for the period in question. But because it’s fitting a straight line to highly variable data that fir has an uncertainty. You can;t tell if the exact slope of the best fit represents anything real, or if it’s just caused by the random fluctuations in the data.
“Before that, it was increasing (for a time). Now….isn’t.”
The claim that it now isn’t increasing depends entirely on when you start the trend – that is when you define “now”.
And the claim that it was increasing but then stopped is why this is a misdirection. You look at the trend from whatever date, but ignore how in order to get the pause you have to start with a big rise. As I keep trying to point out the overall trend has increased as a result of the pause. The trend (from the start of the UAH data) up to the start of it was 0.110 °C / decade. The trend to March 2023 is now 0.133 °C / decade.
“Are you denying these are facts? A simple yes or no please.”
They’re facts, just not very meaningful ones. It’s a fact that the trend since March 2021 is 0.41 °C / decade. Do you deny that’s a fact, or do you just think it’s irrelevant to a discussion of the pause?
Statistics is mainly concerned with separating meaningful facts from meaningless ones.
“Because the pause goes against everything the climate establishment is claiming.”
Which is why these articles are written and why Monckton is disingenuous when he claims the only purpose is to illustrate the strength of the overall trend. There is absolutely nothing in this pause that contradicts anything climate science says. It’s simply what happens when you start a trend just before a big El Niño spike.
“Earth’s climate system is ill-understood by the ”modelers”.”
Might as well show my simple model again, based on CO2 and ENSO. It doesn’t explain why the last decade has been a little warmer than expected, but it does show how ENSO can cause the “pause”.
Instead of gloating about how an El Nino is going to raise global temps, perhaps you should also explain how human emitted CO2 raises the temp of the ocean. I look forward to seeing your explanation.
What on earth are you misunderstanding now. El Niños cause a temporary rise in temperatures, as was explained by everyone here when the 2016 one started. A temporary rise in temperature will cause a change in short term trends, hence it would be foolish to look at the trend for the eight or so years culminating in the 2016 spike and claiming that global warming had suddenly accelerated, and by the same measure it’s foolish to start a short trend juts before the spike and claim that it shows global warming is decelerating or paused. There’s no gloating involved – it’s just basic statistics.
El Niños should not cause a permanent rise in global temperatures. Any short term increase will result in more radiation out, and the earth will cool back to equilibrium.
“explain how human emitted CO2 raises the temp of the ocean”
I couldn’t give you an expert explanation, but to my naive understanding, if global temperatures rise as a result of increased CO2, then that will warm the oceans. It would be an odd state of affairs if temperatures are going up all over the land, but somehow the oceans stay the same.
“if global temperatures rise as a result of increased CO2, then that will warm the oceans.”
How does it do that? Conduction? You are postulating a causal effect without also providing a physical explanation of the causal relationship.
In other words, an uninformed guess based on a coincidental correlation.
You asked for an uniformed guess, then complain when I give you one. If you want in informed explanation of heat transfer, ask someone who knows. All I can say is it seems reasonable that a warming world will also warm the seas. What else do you think is going to happen. If I have a tub of water in a room and turn the radiator on, what do you think will happen to the temperature of the water as the air temperature increases?
Mike said: “Because the pause goes against everything the climate establishment is claiming.”
That is patently false. According to CMIP5 we expect to find ourselves in a Monckton Pause lasting at least 105 months 17% of the time.
Mike said: “Because 9 years of temperature fall as co2 rises is not insignificant, and proves beyond any doubt that at the very least, Earth’s climate system is ill-understood by the ”modelers”.
Funny because I was able to construct a model in which CO2 was not inconsistent with the UAH data pauses and all. And I’m just some random guy posting on blog who probably isn’t even worthy of being called an amateur.
This has been explained to you countless times. When predicting, forecasting, whatever – current trends must be weighted higher than historical trends. What’s happening today carries more weight than what happened 30 years ago or 100 years ago. I’ve given you web sites that explain this and give methods on how to do the weighting. But you *always* just ignore this basic truth of forecasting.
Yet Monckton does not weigh the data. His trend is based entirely on a least square linear regression giving equal weight to every month.
And his process of selecting the start points keeps pushing the start point deeper into the past. How is that compatible with you only wanting to look at the more recent data? As always you need to explain how you know the “current trend” started in July 2014, but a year ago it was starting more recently. Why is July 2014 the start of a current trend, but not July 2012, or July 2016.
“But you *always* just ignore this basic truth of forecasting.”
But nobody is trying to use the current trend to forecast. Monckton explicitly says the pause will end soon. His only forecasting uses the trend since 1978, when he calculates how much warming that will mean by the end of the century – if the “current trend” continues. By current trend he means since December 1978.
Monckton’s data *is* recent data! As you have admitted.
But not weighed, which is what you say must be done.
The only weighing in the pause is to weigh all data since July 2014 equally and everything prior is weighed 0. If that’s all you mean the question remains, how do you decide what should be the cut off for counting data. If your only argument is to choose the date that will give the “current” data a trend of zero, then you can’t be surprised that you get a trend of zero.
And I’ll repeat, Monckton does not use the current trend to predict the future. He does use the trend of the whole data to forecast warming up to the end of the century and concludes this won’t be anything to worry about. If you insist that you only use “current data” to predict the future you could easily pick a start date that would suggest twice as much warming, or a lot of cooling. So, again, what is your backward algorithm that tells you the correct start point is July 2014.
“There are none so blind as those who will not see.”
Indeed.
There is picking the ripest, reddest, juiciest, most unblemished cherry from all of the trees in your grove (even if it’s the one halfway around the world) and presenting it as the best representative of your crop.
Then there is reaching out without looking, picking a cherry, and presenting it as a representative of your crop.
Lord Monckton does the latter.
“Then there is reaching out without looking, picking a cherry, and presenting it as a representative of your crop.”
You think Monckton picks a random date? You think writing an algorithm to find the best cherry and picking it is OK if he has his eyes shut whilst it runs?
D’OH, poor Bellman has real comprehension issues !
That is the start-point in time.
The mathematical calculations works backwards from NOW.
Please try at least some primary school level of comprehension !
“D’OH, poor Bellman has real comprehension issues !”
Correct, because I’ve no idea what you are talking about, and repeated requests for anyone to explain what this working backwards method actually means has so far drawn a blank.
So maybe you are the one to explain it so I can understand. Tell me, in as much detail as you can, how does “The mathematical calculations works backwards from NOW.” actually work.
It might help if you could explain which particular calculations you are talking about. Do you mean the calculations to determine the trend from any particular date, or do you mean the algorithm used to select which of all the possible starting dates will give the longest possible non-positive trend?
For the record, how I do it is to have an R function which takes the data set as a time series and spits out another time series showing the trend from each starting date. I then just eye ball the resulting table looking for the earliest negative sign. If I wanted to automate the last step I’d filter all start dates with a trend <= 0, and then choose the first one. In no case am I searching backwards.
I can write you a simple program in Perl that will take the data, starting with the last date and working backwards to calculate a linear regression line for each step backwards. It isn’t hard. If you can’t do that in R then R has a problem!
Apparently *you* have a problem with comprehending how this works as well. Good thing you aren’t a computer programmer.
And how does your program differ from if you took each step forwards.
Of course I can do it R, there’s just little point when you get the same result going foreward.
Inåt not be many things, but one thing I am is a computer programmer.
Also using least-squares linear-regression, the warming rate in UAH up to June 2015, the month before the onset of ‘the pause’, was +0.11C/dec, or a total warming of +0.39C from the start of the record in Dec 1978.
After 105 months of ‘pause’, the warming rate in UAH has now risen to +0.13C/dec with a total warming now of +0.59C since Dec 1978. That’s right, using Lord M’s preferred regression method, warming during the past 105 months has continued strongly in the UAH record when measured over its whole length.
How can this be, you may ask? It’s simply because temperatures over the past 105 months of ‘pause’, although flat have generally remained at a very high plateau. It was the warmest continuous 105-month period in the UAH record. Linear regression, when applied over the whole period of record, pics that up.
The chart below shows the full UAH warming trend pre-pause (green line, +0.11C/dec) and after-pause (blue line, +0.13C/dec). Please check this for yourself here.
no – the trend in the first derivative of UAH is flat. There is no acceleration of warming.
https://woodfortrees.org/plot/uah6/derivative/mean:12/plot/uah6/derivative/mean:12/trend
Well, if you remove the warming trend from a data set then I guess you can pretend there has been no warming trend in it. If you want to deceive people, or yourself, that is.
Even Dr Spencer and Lord M accept that there is a +0.13C/dec warming trend in UAH_TLT. Perhaps you should explain to them where they are going wrong.
I will give you the benefit of the doubt and presume that there has been a miscommunication.
Here is another slope of slopes to chew on – there we can clearly understand the arbitrary rate of increase is trending higher.
https://woodfortrees.org/plot/esrl-co2/derivative/mean:12/plot/esrl-co2/derivative/mean:12/trend
I have no idea what your comments or charts are intended to purvey.
Let’s just keep it simple: everybody, and I mean even the data producer (UAH/Roy Spencer) and the post writer (Lord M) agrees that linear regression is the best way to present climate trends. That’s why they all use the same method.
Linear regression shows that, over the course of the recent pause, global temperatures have continued to increase. Not only that; they also show that the rate of this increase has accelerated. The decadal rate of warming in UAH is faster now than it was before this so-called pause started.
How do you figure that works? (Spoiler, I already explained it above.)
Your objection is noted.
Slice and dice the data however you wish, it is your prerogative.
In reality, however, the data series does not display the characteristic of acceleration.
I ‘sliced’ the data by using all of it, not a selected sub-section.
And to decrease! That is the meaning of “no trend.”
There was no decrease when the full record is considered, only a further increase. See above.
The only way to get a decrease, or flat line, is to consider only a sub-section of the data in isolation; so guess what lord M does…
TFN, thank you for pointing out that the 43 year+ trend of UAH6 is a de minimis 0.13℃/decade (1.3℃ per century), especially considering it occurred during rising AMO and PDO temperature trends. Your CliSciFi climate modeling buddies think it should be 2+ times that.
When did you guys stop following the science? The same as for the government agencies and other entities still insisting on masking in contradiction to all the existing science pointing to its ineffectiveness. Hell, it was a known fact far before the ChiCom’s introduction of COVID19 that surgical masks were ineffective against airborne viral sources of infection. But your buddies in government, big tech and the media got together and enforced the narrative that masks will protect one from ChiCom’s COVID19, canceling any scientist disagreeing with their lies.
In fact, the Great Fauci initially followed the real science and said surgical masks were ineffective. Later, after the Leftist mob got on him, he said we needed not only one mask but must wear two at a time. Its like when your chain-link fence won’t stop those pesky mosquitoes, science now said another in parallel will. Do you believe government and Leftist activists and NGOs won’t lie to you?
This is just a ramble Dave, isn’t it?
Yeah, I get bored with your non sequiturs. I’m identifying as a girl and just gotta have fun.
Fair enough.
See, TFN, you can’t even get in a good pun. Nobody laughed that I could tell.
If one were dealing with any arbitrary step function, and wanted to know the duration of the plateau(s), Monckton’s method is correct. That does not deny the existence of a longer term trend. However, it gives us some insight on the processes that create the step function, and in particular, points out the poor short-term correlation of temperatures with the monotonically increasing CO2. CO2 plays a role, but it isn’t the ‘Control Knob.’
“…no global warming from July 2015 to March 2023.”
I think that should be “from July 2014”.
Yup, you’re right.
Not a single self-proclaimd ‘skeptic’ spotted that.
Not a single one.
Or, like me, just chose to ignore it as trivial.
The trivial approach to skepticism; might work. Seems to here.
Well, TFN, its how I have chosen to deal with people who deliberately and continuously over time obfuscate serious discussions with pseudo-facts and distortions of reasoning processes in order to push a Leftist narrative asserting extreme climate change.
You know damned good and well, TFN, that the UN IPCC is stuffed full of politicized, socialist one-world zealots that hate Western capitalism in general and the U.S. in particular. Their every utterance and publication over their entire history has made their biases perfectly clear. Their publications are nothing more than poorly-written, anti-science diatribes. I refuse to take them seriously and consider anybody that does as being willfully ignorant or a fellow traveler.
Anyway, the UN IPCC is in the process of destroying itself because its leadership can no longer control the zealots they let loose and they are trying to compensate my making more and more extreme and obviously over-stated official pronouncements. At every juncture their extreme positions and clownish pronouncements are wrapping the organization around and around its own axle and it will never be able to recover.
I don’t have the time, desire nor expertise to get into nit-picking arguments about climate minutia. The current climate is benign and has not deteriorated in any way over the past 100+ years. Everything else is a huge, expensive dick-dancing exercise in activists pushing then realists countering Leftist propaganda. So stuff your nonsense, TFN.
Those thermometers are definately communists.
Monckton of Brenchley:
To my mind, you are being dishonest by using a graph with temporary increases and decreases in temperature due to La Ninas and El Ninos. To determine what our climate is actually doing, all such temporary events need to be excluded.
BurlHenry: “To my mind, you [Monckton of Brenchley] are being dishonest by using a graph with temporary increases and decreases in temperature due to La Ninas and El Ninos. To determine what our climate is actually doing, all such temporary events need to be excluded.”
One commonly used definition of ‘climate’ is that it represents the pattern of weather which occurs over any given period of time thirty years in length.
The implied logic of your criticism is that naturally occurring events which affect the weather patterns seen in the course of any given thirty-year period of time should not be included in any scientific analysis of what kinds of natural and anthropgenic processes might influence the earth’s climate system.
The implied logic of your criticism has the effect of leaving naturally occurring climate change out of the analytical picture — equivalent to saying that weather doesn’t matter in assessing the causes and impacts of climate change, except when it does.
Beta Blocker:
Those natural events are superimposed upon some actual climate trend.
What is that trend?
BurlHenry: “Those natural events are superimposed upon some actual climate trend. What is that trend?”
The IPCC states that climate warming before 1950 was mostly natural, and that climate warming since 1950 has been mostly anthropogenic.
Based on the HadCRUT4 land temperature record, 1850 to 2019, the linear warming trend of the earth’s climate system from both natural and anthropogenic causes between the year 1910 and the year 1945 was roughly 0.19C per decade.
Also based on the HadCRUT4 land temperature record, the linear warming trend of the earth’s climate system from both natural and anthropogenic causes between the year 1975 and the year 2019 was also roughly 0.19C per decade.
If we take the IPCC’s word for it, and if we look at the HadCRUT4 temperature record, then:
— ‘Mostly’ natural causes can produce a +0.19C per decade rate of increase in global mean temperature over a period of thirty-five to forty years.
— ‘Mostly’ anthropogenic causes can produce a +0.19C per decade rate of increase in global mean temperature over a period of thirty-five to forty years.
Golly, this raises two ‘mostly’ tortuous questions:
What portion of today’s global warming is natural, and what portion is anthropogenic? Further, what lines of evidence are necessary in order to reach a firm scientific conclusion as to what portion is natural, and what portion is anthropogenic?
My personal interest lies in public policy decision making.
If asked to render my personal opinion for purposes of public policy decision making concerning where GMT will be going over the next 80 years, my prediction remains that the most likely outcome is another 1C of warming between 2023 and the year 2100, from some combination of natural and anthropogenic causes; and that nothing anyone does over the next eighty years will make any difference to that outcome.
That said, I will gladly help the United States build more nuclear power plants as our nation’s proposed solution to global warming, with the proviso that any project I work on must be managed in a highly disciplined and cost conscious way, and in full compliance with NRC rules and regulations.
The IPCC states that climate warming before 1950 was mostly natural, and that climate warming since 1950 has been mostly anthropogenic.
They don’t seem to be saying that anymore.
From 2019: How much of current climate change is natural?
The most recent special report on global warming of 1.5 degrees confirms that the observed changes in global and regional climate over the last 50 or so years are almost entirely due to human influence on the climate system and not due to natural causes.
I don’t blame you if you have not kept up with the IPCC publcations since before 2019 — I don’t enjoy reading fiction either.
Show us exactly how they proved “that the observed changes in global and regional climate over the last 50 or so years are almost entirely due to human influence on the climate system and not due to natural causes.” Or did they simply reassert someone else’s assertion?
What is the difference between entirely and almost? Was the difference due to their God’s (Marx) will?
Simple
Dismiss all natural causes of climate change as “noise” in 1995
Then almost all climate change has to be manmade.
I was just reporting the IPCC claim.
They are a political junk science organization.
I don’t take their predictions seriously. In fact I spend a half hour a day listing all the good articles I’ve already read on climate science and energy that day, that REFUTE the IPCCs CAGW scaremongering
Honest Climate Science and Energy Blog
“I was just reporting the IPCC claim.
They are a political junk science organization.”
Yes, they are.
They are also a dangerous political junk science organization.
“The most recent special report on global warming of 1.5 degrees confirms that the observed changes in global and regional climate over the last 50 or so years are almost entirely due to human influence on the climate system and not due to natural causes.”
That’s just pure BS. Nobody has “confirmed” anything about what is natural, and what is not natural, about the Earth’s climate.
This is another unsubstantiated assertion by climate change alarmists.
Alarmist climate science is made up entirely of unsubstantiated assumptions just like this one. They couldn’t prove this claim if their life depended on doing so.
Yet here we are destroying our societies and economies over such unsubstantiated claims. It’s madness.
calm
down
The IPCC was formed to claim global warming was dangerous and blame humans for a coming climate crisis, that was first predicted, with a specific “consensus” ECS range, in the 1979 Charney Report. . That’s what the IPCC does. Professional climate scaremongering. And they do it well. They had to delete natural causes of climate change to do their propaganda properly.
The truth about the climate, in my opinion”
Adding CO2 to the atmosphere has been good news
Global warming from 1975 to 2015 was good news
I hope both continue at least until the CO2 level doubles.
These statements are based on thousands of CO2 enrichment dt — C3 plant studies. of which I have read about 300 in the past 25 years, and the satellite measurements of actual global warming in the 1975 to 2015 period, where it was obvious the pattern and timing of the warming was good news:
Mainly warming in colder NH nations
Mainly warming in the six coldest months of the year
Mainly warming at night (TMIN)
That’s good news warming
We love it here in Michigan
“calm
down”
Get exercised! The IPCC is leading the charge to destroy Western society.
Over a 30 to 50 year period the El Ninos and La Ninas should offset each other. They may not cancel over shorter periods
The two large El Nino heat peaks in April 1998 and February 2016 are actually very useful: The global average temperature reached +1.5 degrees C., when rounded to the nearest 0.1 degree C.
And we all know that +1.5 degree C. is a dangerous tipping point. And that’s why millions of people died in those two months. It was in all the newspapers — the greatest disaster in human history. Strange that 99.9% of the people never even noticed the carnage. I stayed indoors 100% of the time during both +1.5 degree C. months.
“And we all know that +1.5 degree C. is a dangerous tipping point.” What you mean “we,” TFN? Got a turd in your pocket?
1.5℃ is just another Leftist, Globalist made-up number at the UN IPCC socialist gab-fest. They had to come up with that because even their manipulated, speculative CliSciFi models weren’t showing the globe reaching the previous 2℃ Leftist, Globalist made-up number at the UN IPCC socialist gab-fest any time soon.
You mean that “we?” The group that accrues vast wealth and power by scaring the gullible population?
Got Science? ‘Cause there ain’t no milk at the Marxist land of milk and honey.
Actually +1.5 degrees C. is claptrap
You are correct.
The real number is +1.5137 degrees C
Based on my personal calculation,
after 25 years of study.
We are perfectly safe at +1.5 degrees C.
At +1.5137 degrees we are doomed
This is real science
I have a BS degree
And this is no BS.
The Trend? About 1℃ (give or take not enough to make any difference) since the end of the Little Ice Age. Shall we try to return to the conditions of the Little Ice Age?
The implied, but unstated assumption, is that “those natural events” are unrelated to any trend and have no impact. Everything, heat waves, precipitation, winds, clouds, all impact average global temperature. The real question should be, “Is there an imposed anthropogenic temperature influence, and can it be untangled from all the non-anthropogenic influences?” I haven’t seen any compelling evidence that it can be.
BurlHenry should not be bandying abot the word “dishonest”, given that the head posting makes explicit the basis on which the calculation is performed, and also supplies graphs showing the entire dataset since 1978 and the trend since IPCC’s First ASSessment Report in 1990. What the climate is “actually doing” is warming at little more than a third of the originally-predicted rate, and the fact that there are so many periods with such long Pauses in the dataset provides a strong visual indication that CO2 is not, after all, the “control knob of the climate”.
The global cooling from 1940 to 1975 showed CO2 was not the control knob and the later HUGE revisions to the 1940 to 1975 cooling, long after 1975, showed government bureaucrat scientists were dishonest. 100 years of wrong climate predictions showed humans can’t predict the climate, even f they have Ph.D.’s.
Or it showed that industrial activity can both warnm and cool the planet surface at the same time. See every IPCC report for details.
Yeah, they tuned the UN IPCC CliSciFi models with made-up aerosol numbers that were inconsistent between the models because they had to cover for wildly differing assumptions about ECS. Read more, spout propaganda less, TFN
The long term 1940 to 1975 cooling trend reversed to a long term 1975 to 2015 warming trend in 1975 because all the sunlight blocking air pollution suddenly fell out of the sky in 1975?
You remain a climate science nitwit
If you can figure out a way to accurately do that, please demonstrate it.
MarkW.
The approach that I have used is to take a printout of HADCRUT5 annual temperatures and color the beginning to end dates of El Nino events red, and La Nina events blue, and exclude them from the temperature data set. Should be pretty accurate.
I had done this at one time, but can’t find my results at this time.
With no control theory and no feedback philosophy, using only the IPCC-made figures, can there be a stronger yet simple way to show and explain the communist attack on Western economies like this of Lord Monckton? He deserves that the US pays him a commission of at least, let’s say, 1% of what he will save, that is, some 1.35 billion dollars.
Fair enough?
But don’t pay me in Bitcoin.
You can send it to me if you don’t want it. I’m an equal opportunity billionaire.
Wonderful and educational analysis. However, it will do no good as the levers of power are manipulated by the flow of money and right now at least in the western world the flow is controlled by the Alarmists. Scientific and economic facts only matter when you can show the populace the negative effects to Their bottom line. It is called “human nature”.
The
There is no chance that the rate of CO2 increase will be checked
I don’t think that ‘net zero’ was ever intended to check the amount of CO2 in the atmosphere. This is the new form of capitalism that the world’s governments have adopted. You con the public into believing they need something incredibly expensive, then you make billion$ building things that will never fix the ‘problem’ using the public’s money. People complain but you still have your billion$. in California we have politicians spending $100 billion on a ‘high speed rail system’ that isn’t high speed, and runs from one sparsely populated area to another, that few people will ever ride, assuming it ever gets finished. The people cashing the checks don’t care about the end result. They still get paid. Same with windmills and solar farms. It’s all about making money, which is the only end result the governments of the world care about.
Crony Capitalism. AKA Fascism.
Yeah, no chance. it’s a delusion.
Excellent answer to the question the Bidenistas refuse to face, CMoB (as well as 97% of the population with alleged technical educations).
I predict additional whining from the usual suspects.
Karlomonte is right: the climate Communists do not like the economic argument at all. When I originally posted it on a small YouTube channel, it was shadow-banned within a day or two, and is still shadow-banned.
The cliate howlers try to avoid the economic argument against Nut Zero in the US with a clever strategy
There are no detailed feasible plans for every electric utility and business government that uses energy, available for any cost estimates, or critical path timing analyses.
The total cost of US Nut Zero has to be wild guessed.
And those guesses would only result in a huge range of possibilities, like the +1.5 to +4.5 C. degree range guessed for ECS in 1979.
The Nut Zero motto:
Nut Zero is not going according to plan,
because there never was a plan.
Wonder who made money on this?
https://www.independent.co.uk/travel/empty-china-cities-12-eerie-photos-enormous-chinese-completely-empty-people-ghost-towns-abandoned-a7982646.html
You reckon windmills and solar installations have the same kind of folks looking for government money?
Someone had to pay the contractors!
Twice in the last two months door-to-door residential rooftop PV solar system sales persons*** have shown up at the front door and ignored the large sign which informs such people that the answer to whatever they want will be no regardless. The sign works for all but door-to-door PV hawkers apparently.
I really object to paying for someone else’s PV system through my taxes, this is obscene, and these clowns are just milking the government.
***(wearing jackets monogramed for the local energy utility but could not produce ID for same)
We have had PV sales people on tv in the local area for months now, and in the last few weeks they have said you can save on your electric bill by installing their solar panels, which is their standard pitch, but lately they have been emphasizing that the federal government will now pay a $10,000 subsidy if you install solar panels. I guess that’s due to the Inflation Reduction Act funding going into effect.
I don’t like my tax money going to subsizide my neighbors solar panels, or electric cars, or industrial windmills or solar farms. They should stand or fall on their on value, or lack thereof.
Absolutely correct.
The eyes of the first batch of hucksters got very wide when I tried to explain all the downsides to residential roof mounted PV, and I didn’t even get through the entire list before giving them the heave-ho.
“Wonder who made money on this?”
I think Chicom Elites made money on these empty cities. I read an article that said as much not long ago, although I don’t have a link, unfortunately.
The point of Lord Monckton’s article is to take the other side’s data and proceed to beat them over the head with it. As such, the point I wish to make is outside the scope of his argument, but worth making anyway.
The Modern Warm Period didn’t start with the satellite era, it started almost 200 years ago, as the Little Ice Age was ending. In other words, the Modern Warm Period started well before there were any substantial increases in atmospheric CO2, so CO2 could not have been the cause of that temperature increase.
It is generally agreed that substantial increases in atmospheric CO2 did not start until somewhere around 1950.
However, the rate of global temperature increase prior to 1950 is not substantially different from the rate of increase after 1950.
Unless one assumes that whatever was causing the pre-1950 warming just happened to stop in 1950, one can’t assume (as the other side does) that CO2 is the primary driver of climate in the post 1950 world.
MarkW is right. There is good evidence in the Central England Temperature Record, the world’s oldest regional temperature record, which shows warming at a rate equivalent to 4.33 K/century over the 40 years 1694-1733. There has been no such rate in any 40-year period since.
That’s a regional (or perhaps more correctly, local) temperature record, not a global one, which is what we are concerned with here.
Gavin Schmidt has assured us the only temperatures that matter are local.
Not sure what this is about or how it relates to the comment you’re responding to.
He said that to justify rejecting radiosonde and satellite temperature records of atmospheric readings in favor of his buddies manipulated surface datasets. He failed to note that according to CliSciFi practitioners, atmospheric temperatures drive surface temperatures.
I assumed that all well-read climate enthusiasts were aware of that famous remark by Gavin. Its satire: You know, the stuff Marxists have such a hard time dealing with?
And air parcels rarely stay in one place for very long. Those of us who live in the US midwest or east can generally get an idea of what our weather will be like in two or three days by seeing what is happening on the Left Coast.
Very similar here in Las Vegas, NV, Clyde. We can fairly accurately anticipate the big blows out of the NW.
“Those of us who live in the US midwest or east can generally get an idea of what our weather will be like in two or three days by seeing what is happening on the Left Coast.”
That’s right. Those same air masses are circling the world bringing whatever weather they have with them. So if it’s cold in the U.S., that cold weather is heading east.
The thing about the England temperature record is those cold air masses that pass through the U.S. on the way to the UK get moderated in their temperatures by the Atlantic ocean by the time they get to England, so maybe England isn’t the best example of global temperatures, since in this case the U.S. would show a much colder temperature, than would England a week or two later.
Of course after the cold air mass has left the US and reached England, the US would show warmer temperatures than England. The difference just wouldn’t be as great.
TheFinalNail;
No, it is NOT a regional data set. All LIA temperature changes coincide with volcanic eruptions somewhere around the world, so it was a world-wide event
See “The Definitive Cause of Little Ice Age Temperatures”
https://doi.org/10.30574/wjarr.2022.13.2.0170
The comment was specifically about CET, which covers part of England. It is more correctly a local data set than a regional one. By the way, 2022 was the warmest year in the CET record.
By the way, 2022 was the warmest year in the CET record.
Great news for central England
Hope their warming continues for the next 50 years
TheFinalNail
Being due to volcanism, it affected world-wide temperatures, making Earth the region, although local temperature ranges obviously varied, as in the Southern Hemisphere..
Monckton of Brenchley
During that 40 year period, there were 25 years when there were no VEI4, or larger, volcanic eruptions. Temperatures always drop after such an eruption, so it is not surprising that in the absence of eruptions, the “rate” was unusually high
After-the-fact rationalizations.
Dave Fair:
How could it be otherwise? It was 500 years ago
Burl, prove the atmospheric concentrations of SO2 and other sunlight-blocking compounds during the various periods and how much that would have changed temperatures in each period. Asserting more or less volcanic activity doesn’t prove anything.
Dave Fair:
Whenever there is a VEI4 or larger volcanic eruption temperatures always decrease because of the injection of sulfurous compounds into the stratosphere, where they are quickly converted to SO2 aerosols.
When these aerosols eventually settle out (in about 14-16 months), temperatures rise to pre-eruption levels, or higher, because of the less polluted air.
The Minoan Warm Period, the Roman Warm Period, and the MWP were hotter than today because they were periods with very few volcanic eruptions.
More or less atmospheric SO2 from volcanic activity, or “Clean Air” efforts has always affected Earth’s climate
This is discussed in my article “Net Zero Catastrophe Beginning?
https://10.30574/wjarr.2022.16.1.1035
Rats!
Typed the link wrong.
https://doi.org/10.30574/wjarr.2022.16.1.1035
I think I’m in Dave’s camp here, Burl.
I don’t see enough information to reach a conclusion.
Yet the first ~80 years of the HadCRUT global temperature record (1850-1930) has zero trend, even very slight cooling. 80 years of zero warming seems like a long pause.
Pre-1920 is a wild guess of the Northern Hemisphere
Pre-1900 is total BS that could be off my 1 degree C.
Both not fit for scientific analysis.
So no support for the claim that warming rates prior to 1950 were similar to the trend after 1950.
Eyeballing the graphs below, I would say that the rate of warming pre and post 1950 were similar. Neither caused by co2 – obviously.
What graph?
Weak support using pre-1940 numbers
Not an accurate global average pre-1940
Even worse for 1940 to 1975: Significant global cooling before the science fraud “revisions”
So even 1940 to 1975 surface numbers can’t be trusted.
”Pre-1920 is a wild guess of the Northern Hemisphere”
No it isn’t see below.
WRONG
Here are charts showing where land weather stations were located pe 1920.
Honest Climate Science and Energy Blog: Sparse coverage of Earth’s land surface with land weather stations in the old days
It shows zero trend only after it was sufficiently cooked.
BEST also shows no (or slight cooling) global trend 1850-1930.
The BIG CONSPIRACY, whoooo…
”Yet the first ~80 years of the HadCRUT global temperature record (1850-1930) has zero trend,”
1850-1930 was the bottom of a wave. These long term Central Europe measurements agree with those for Antarctica. We are now approaching the top of the next one. Go ahead and drive your V8 SUV. It won’t make a difference.
“the HadCRUT global temperature record (1850-1930)”
Is a BIG LIE.
Would you mind posting a global temperature dataset that you feel is not a lie so that we can compare it to HadCRUT and see just how much HadCRUT is lying?
Something can be a lie without the actual truth being known.
Absence of evidence is not evidence of absence.
You really are not a physical scientist, are you?
I don’t have a global dataset, but I can, and have, posted numerous regional surface temperature charts from around the world that show it was just as warm in the recent past as it is today.
Those are the same regional temperature charts from which you get your datasets. Yet, your datasets don’t show the periods in the past that were just as warm as today, even though the regional charts from which these datasets are derived *do* show the previous warming.
How do you explain this discrepancy?
I explain it as fraud. The deliberate distortion of the temperature record to make it appear that today is the warmest period in human history. It’s a BIG LIE. It’s the BIG LIE that is destroying Western Democracy.
All the unmodified, regional surface temperature charts from around the world, show it was just as warm in the Early Twentieth Century as it is today. All the regional surface temperature profiles resemble the U.S. regional temperature chart profile represented by the chart on the left below (Hansen 1999).
So if all the regional charts around the world look like the U.S. chart, then how did the climate change alarmists come up with a completely different looking global temperature chart using regional chart data?
Answer: The Temperature Data Mannipulators deliberately distorted the temperature profile to change it from a benign profile, as represented by every regional chart, and change it into a terrifying “hotter and hotter and hotter” temperature profile where humans are now living in the hottest times in human history. And it’s all a BIG LIE.
The real global surface temperature profile (as close as we are ever going to get) is on the left below. The “hotter and hotter” BIG LIE is on the right.
The Temperature Data Mannipulators mannipulated their computers and came up with a climate change horror story. Pure Science Fiction, of course.
So tell me climate alarmists, and data mannipulators, how do you get that “hotter and hotter” profile out of data that has no “hotter and hotter” profile?
Answer: You have to tell a BIG LIE.
I do think the temperatures in most databases used to calculate a GAT have been manipulated. I suspect it is mostly from ignorance and confirmation bias more than fraud.
The lack of statistical rigor begins with averaging Tmax and Tmin. Those are highly correlated and therefore not independent. The Law of Large Numbers and the Central Limit Theory both REQUIRE independence in order to be used for drawing inferences. Simple arithmetic averaging is not considered a transformation that converts them into non-correlated random variables.
Variance is totally ignored and the range of temperatures from start to finish is hidden beneath average after average.
Anomalies are the difference in two random variables, the variance of Var(X+Y) = Var X + Var Y. You never see this quoted, only the variance calculated from the variation in the anomalies themselves. Totally incorrect.
It is hard to believe that statistical experts have not examined this and failed to point out the failures. All I can think of is complete ignorance and an unwillingness to step out and contradict peers because of fear of retaliation.
TA said: “I don’t have a global dataset”
Then you can’t draw any conclusions about the global average temperature (GAT). And without a quantification of the GAT you can’t say definitively there was a “LIE” neverminded quantify the size of it and claim it is “BIG”.
TA said: “I explain it as fraud.”
That is an extraordinary claim. Where’s the extraordinary evidence?
TA said: “The deliberate distortion of the temperature record to make it appear that today is the warmest period in human history.”
1) temperature records do not say it was the warmest period in human history.
2) the net effect of all adjustments reduces the overall trend of the GAT.
3) deliberate distortions would be changing the time-of-observations, changing instruments, moving stations, etc. without acknowledging they occurred and doing something about it.
TA said: “The real global surface temperature profile (as close as we are ever going to get) is on the left below.”
Do you really think the United States, which covers 2% of the Earth, is the same thing as the Earth? Do you really think a graph that is known by even the most vocal contrarians to be contaminated with biases caused changes in time-of-observations, changes in instrument packages, station moves, etc. is going to give you a truer picture of the temperature there? Seriously?
TA said: “So tell me climate alarmists, and data mannipulators, how do you get that “hotter and hotter” profile out of data that has no “hotter and hotter” profile?”
I can’t speak for alarmists and data manipulators. I don’t follow them or use their datasets. I only use reputable sources like BEST, HadCRUT, GISTEMP, etc. They’re data shows an increase in the global average temperature (GAT) because by all reasonable analysis the GAT went up. This is despite the fact that the net effect of all adjustments actually reduced the trend.
“””””Do you really think the United States, which covers 2% of the Earth, is the same thing as the Earth? “””””
If CO2 is well mixed, and radiation is the way it works, and if the GAT has as small a varience as you claim, then the U.S. should be very representative of the global land average.
You need to provide a better reason as to why the U.S. would be very different based on anomalies. That is the whole reason is it not?
You have seen a number of local/regional temperature trends where there is little if any increase in annual temperature. Why have you not shown any that have twice the claim, say 2.5 °C?
A global average anomaly with the small variance you have claimed in the past is only useful if it adequately describes a large percentage of the area. One standard deviation should describe ~70% of the anomalies and 2 SD’s would cover ~95%>. Unless the U.S. is far, far away from the mean it should fit very nicely in the GAT distribution.
You seem to forget that the percent of land area is not what is described in the GAT anomaly distribution. Put your math hat back on and think about what the GAT describes! It is supposed to be a distribution of temperature changes on the globe that has a mean and a standard deviation. The U.S. anomalies lay somewhere in that distribution. Where do you think it falls?
Unless one assumes that whatever was causing the pre-1950 warming just happened to stop in 1950, one can’t assume (as the other side does) that CO2 is the primary driver of climate in the post 1950 world.
After4.5 billion years of controlling climate change, natural causes of climate change died in 1975. Just before his last breath, he made manmade causes of climate change boss. That is the IPCC position. It was celebrated in the movie The Godfather. This was not officially announced by the IPCC until 1995 when they claimed all natural causes of climate change were “noise”. They wanted to announce that death in 1988 but decided to wait until 1995, so they could say they had studied the subject for the seven years.
“The point of Lord Monckton’s article is to take the other side’s data and proceed to beat them over the head with it.”
By “the other side”, you mean Drs Roy Spencer and John Christy. What side are you accusing them of belong to?
“The Modern Warm Period didn’t start with the satellite era, it started almost 200 years ago, as the Little Ice Age was ending.”
Someday, somebody is going to have to decide exactly when the Little Ice Age started to end. So far I’ve heard 300 yeas ago or at the end of the 19th century. 200 years is a new one on me. The 1820’s are not normally classed as a warm period.
“However, the rate of global temperature increase prior to 1950 is not substantially different from the rate of increase after 1950.”
HadCRUT4:
1850 – 1950: +0.025 ± 0.013°C / decade
1950 – 2023: +0.124 ± 0.017°C / decade
Cherry-pick a speculative temperature series of 101 years and compare it to a cherry-picked and speculative partial 84 year period. You prove nothing with cherry-picked, historically bad and manipulated data. You are also asserting that 170+ year-old temperature data with a stated +/- 0.013℃/decade accuracy is valid.
Then which temperature series do you want me to use in order to test the claim that “the rate of global temperature increase prior to 1950 is not substantially different from the rate of increase after 1950.”?
I didn’t “ask” you to test that claim. If I would ask anything, I would ask you to explain the reasons behind the similarities between the early, approximately 1915 to 1945 warming trend and the late 20th Century warming.
They appear to be essentially the same, but with the UN IPCC CliSciFi practitioners claiming the later series was essentially anthropogenic in origin, whereas the earlier series was essentially natural in origin, I’m confused as to their methods of differentiating cause and effect.
UN IPCC CliSciFi climate models are only proof of the modelers’ biases, not scientific fact. And increasing atmospheric CO2 concentrations correlating with the latter trend is not proof of causation. Additionally, the lack of a tropospheric hot spot pretty much kills off the assertion that water vapor feedbacks gave us the rise in temperatures in the latter period, beyond that which CO2 theory says it could (all else being equal) have given us.
None of that which the UN IPCC asserts about climate change justifies the fundamental alteration of our society, economy and energy systems. Change my mind.
“I didn’t “ask” you to test that claim.”
You didn’t ask me to do anything. I was replying to a claim made by MarkW. You simply jumped into the discussion claiming the 1950 date was cherry-picked.
“If I would ask anything, I would ask you to explain the reasons behind the similarities between the early, approximately 1915 to 1945 warming trend and the late 20th Century warming.”
Are they similar? Using what data set and criteria? I’d check against existing data sets, but you’d just claim they are manipulated. So if you want to make that claim, you have to provide the data.
Assuming they are “similar”, I’m not sure what there is to explain. To trends can be similar without have the same cause.
Here’s my attempt at a linear model taking into account a number of variables. It’s true that the mid-40’s show warmer than expected temperatures and cooler than expected before that. What caused that I couldn’t say, but it doesn’t detract from the strength of the trend when CO2 starts to increase.
“I would ask you to explain the reasons behind the similarities between the early, approximately 1915 to 1945 warming trend and the late 20th Century warming.They appear to be essentially the same”
Phil Jones says three periodsin the past are equal in warming magnitude. See the chart below.
Note that although Phil Jones shows the three periods as equal in warming magnitude, he imposes this on a bogus, bastardized Hockey Stick chart that distorts the temperature record of the past by not showing the Early Twentieth Century as being as warm as today.
The U.S. regional chart, for example, shows the 1930’s to be just as warm as today, so the 1930’s should be on the same horizontal line as 1998 and 2016, and as you can see from Phil Jones chart, he shows the 1880’s as being as warm as the 1930’s, so if we unbastardized this chart, the 1880’s, the 1930’s, 1998 and 2016 would all be on the same horizontal line on the chart. No real warming since the 1880’s!
That’s your Real global temperature profile. It warms for a few decades, and then it cools for a few decades, and then it repeats, and there is a difference of about 2.0C between the warmest and the coolest temperatures, since the end of the Little Ice Age.
That’s my opinion and I’m sticking to it. 🙂
TA said: “The U.S. regional chart, for example, shows the 1930’s to be just as warm as today”
And as I’ve said repeatedly this only true for charts that have the time-of-observation change, instrument package change, etc. biases left in.
TA said: “Phil Jones chart”
Keep in mind that Phil Jones’ chart contains the correction for the time-of-observation change, instrument package change, ship/bucket/buoy change, etc. biases.
TA said: “so if we unbastardized this chart”
Are you seriously suggesting that intentionally including errors makes something “unbastardized”?
TA said: “That’s my opinion and I’m sticking to it.”
Ok, but let me repeat my question from another recent article. Do you think it was a conspiracy and fraud when people changed the time-of-observation and instrument packages to make it look like the US had not warmed as much?
“And as I’ve said repeatedly this only true for charts that have the time-of-observation change, instrument package change, etc. biases left in.”
Heller debunks these claims.
TA said: “Heller debunks these claims.”
Heller debunked the claims that the time-of-observations were changing, that stations moved, and that instruments were changed?
“Do you think it was a conspiracy and fraud when people changed the time-of-observation and instrument packages to make it look like the US had not warmed as much?”
Like Heller, I think TOBs doesn’t change the outcome much.
What period are you referring to when you say “the US had not warmed as much”? Before 1998, or after 1998? The original bastadization of the temperature record, or after Hansen started to panic when the cooling began after 1998?
TA said: “Like Heller, I think TOBs doesn’t change the outcome much.”
It changes the outcome by a lot. [Vose et al. 2003]
Geez, that”s shaky without metadata regarding the time the readings were taken each day.
Does it apply anywhere other than the USA? Australian readings were always 9am.
Yes. Anywhere a min/max thermometer was used and the time of observation change will exhibit both the carry-over and drift bias. Though the US is where it most prolific due to the mandate to switch the observation time to mitigate evaporation in rain gauges.
In many cases (at least here in the US) the stations were tagged with the ToB (see HOMR) and so the correction is relatively trivial. But yeah, for stations that lack metadata tracking the ToB change can be particularly difficult to identify. This is what pair-wise homogenization (and similar methods) are designed to do.
The point of Lord Monckton’s article is to take the other side’s data and proceed to beat them over the head with it.
Wild guess predictions of the future climate are not data
They are climate astrology
Pausus belli…
CO2 is a positive externality, not a negative one. We need more of it in the atmosphere, not less.
I have to challenge this statement. “until 2100, by which time reserves of coal, oil and gas will be largely exhausted.” there is not any evidence this is a true statement. to the contrary more research and observations are demonstrating that the earth is and oil and gas producing machine.
It’s called capex in the industry and exploration and development. The arm waver types would rather make assumptions and policy misadventures than look historically or rationally. Go back and look at why Julian Simon won the bet on real prices of metals to see evidence of how this works.
Well, existing reserves will be exhausted, because reserves tend to be held in the 40 year range. Of course, some current resources will have been better quantified and converted to reserves on a rolling basis along the way, and some new resources discovered.
CMoB said: “The fact that, over the third of a century since IPCC (1990), global warming is proving to be so slower than the 0.3 degrees/decade that IPCC had then confidently predicted (and still predicts today)”
I see there is no end to the misrepresentation of what the IPCC predicted. And since we’ve been around and around on this topic I now know that you have been informed multiple times of the misrepresentation. That leaves me no choice but to accept that your statement was intentional. That makes it disinformation.
For the lurkers here are the IPCC scenarios considered in 1990.
And here are the predictions for each scenario.
As you can see 0.66 C of warming occurred putting it just slightly above scenario B which is the scenario closest to the one humans chose. In fact, you could even make an argument that humans chose something closer to scenario C even.
In previous discussions, I think the consensus was that concentrations were in line with Scenarios B & C, despite CO2 emissions being in line with Scenario A. That’s probably more good luck than good management.
Agreed, it would have been more accurate if CMoB had noted this.
Scenario A methane concentrations seemed to be somebody’s bad acid trip, and the CFC11 emissions seem to have been mitigated by improvements in refrigeration technology.
In response to “Old Cocky”, the argument in the head posting is a simple one, which did not in any way depend on explaining the reasons why IPCC’s global-warming predictions on the basis of Scenario A emissions have proven to be so excessive.
It is the fact of the over-prediction that forms the basis of the calculation of how much – or, rather, how little – global warming has occurred, compared with what was originally predicted.
For the purposes of that argument, it does not matter whether IPCC had exaggerated the concentrations likely to arise from each emissions scenario or the warming likely to arise from those concentrations or both.
The fact is that the four scenarios were emissions scenarios, and emissions have actually risen by 53%, compared with no increase at all compared with 1990 on Scenario B, and the 0.3 K/decade warming predicted in 1990 on the applicable Scenario A, and still predicted today, is grossly exaggerated compared with the 0.13 K/decade that has occurred since 1990.
The head posting was, therefore, entirely accurate. Scenarios A-D are emissions scenarios, and emissions have risen by 53% since 1990, and Scenario B envisaged no emissions increase at all compared with 1990. No ifs, no buts.
Like it or not, the ambiguity of emissions vs. concentrations exists. As every systems analyst knows, specification ambiguity leads to sub-optimal outcomes.
Adding a brief note to the effect of Scenario A emissions corresponding to Scenario B/C concentrations removes the ambiguity, hence a vastly reduced scope for misinterpration.
A similar observation applies to the term “average” in discussions of articles by other authors.
I agree. There is a 2-step process here. Step 1 is the mapping emissions => scenarios. Step 2 is the mapping scenarios => temperature. Step 1 is handled by working group 3 (WGIII) while step 2 is handled by working group 1 (WGI).
I have (painstakingly) plotted the Global Carbon Project 2022 emissions onto the IPCC FAR Figure A.2 from the Annex graphic. Notice that there is a calibration issue. The IPCC is underestimating estimating at the 1985 anchor point right off the bat. It is not clear to me why there is a calibration issue. Is the IPCC only including fossil emissions? Note that I included both fossil and land use emissions from the GCP2022 dataset. I went ahead and plotted the calibration corrected IPCC FAR trajectory as well for comparison.
Either way emissions closely follow scenario A despite the concentration following scenario B. The point here is that the IPCC WGIII clearly made an inadequate mapping of emissions => scenarios. So the fault lies with their understanding of the carbon cycle; not with their understanding of radiative forcing and temperature response.
The furtively pseudonymous “bdgwx” now concedes that emissions are indeed following Scenario A, exactly as this column has been saying all along. Scenario A, like the other scenarios, is an emissions scenario. And, despite what “bdgwx” tries to maintain, Scenario A is relied upon no less by Working Group I than by Working Group III.
The head posting shows a facsimile of the actual predictions made by Working Group I on the basis of the Scenario A (business as usual, or BaU) emissions.
For the purposes of the head posting, it does not matter precisely what caused the very large error of prediction made by IPCC (1990) and still adhered to at present by IPCC.
IPCC appears to have incorrectly estimated the increase in concentrations arising from a given increase in emissions, and that IPCC also incorrectly estimated the equilibrium doubled-CO2 sensitivity, not least because climatology has perpetrated a large error of physics in attributing to greenhouse gases the overwhelming preponderance of the total feedback response that is driven by the surely-observable fact that the Sun is shining.
It matters not which of these two predominates. It is the magnitude of the over-prediction compared with real-world observation that matters, and that is correctly allowed for in the calculations in the head posting.
So no more wriggling.
CMoB said: “The furtively pseudonymous “bdgwx””
Serious question…do really not see my real name?
CMoB said: “IPCC appears to have incorrectly estimated the increase in concentrations arising from a given increase in emissions, and that IPCC also incorrectly estimated the equilibrium doubled-CO2 sensitivity”
This is what I mean. You completely misrepresent the IPCC. They did not incorrectly estimate the equilibrium doubled-CO2 sensitivity. First, you cannot make any final judgements about the skill of the IPCC prediction in this regard because the equilibrium time has not played out yet nevermind that CO2 hasn’t even doubled yet. Second, you just simply are not understanding that the temperature prediction is based off the concentration; not the emissions. I don’t know how to say that in words that are any simpler than I’ve already used.
CMoB said: “For the purposes of the head posting, it does not matter precisely what caused the very large error of prediction made by IPCC (1990) and still adhered to at present by IPCC.”
What large error? While I agree (I’m the one who pointed it out) that there is error in the mapping from emissions to concentrations I would not consider the error large. Furthermore, CO2 is only but one agent of consideration. CH4, CFC11, etc. are also considered as well. Not only is it inappropriate to say the temperature prediction is based on emissions which aren’t even an input, but it is also inappropriate to ignore the other GHGs as well.
CMoB said: “It is the magnitude of the over-prediction compared with real-world observation that matters”
But there isn’t an overprediction. If anything the IPCC underpredicted the temperature response given the concentration inputs they used. Remember, you’re saying the predictions are wrong because of a believed lack of understanding on the climate’s sensitivity to CO2 when you said and I quote “They did not incorrectly estimate the equilibrium doubled-CO2 sensitivity”. And this is the insinuation you’ve been giving your readings for years. That’s just patently false. As can be seen the IPCC’s understanding of CO2’s climate sensitivity, radiative force, and expected temperature response are not inconsistent with observations.
Mr Gideon has lost this argument finally and comprehensively. The quotation from the head posting shows quite clearly that IPeCaC starts with emissions (the clue is in the name emissions scenarios) and proceeds via concentrations to warming. The truth is that on Scenario A, the business-as-usual emissions scenario, IPeCaC predicted 0.3 K/decade warming, but only 0.13 K/decade warming has occurred. Like or not, that is a factor-2 over-prediction.
You keep saying IPeCaC. I don’t know who they are. I’m talking about the IPCC. And they say that WGIII used emissions to create the scenarios while WGI used concentrations to make the temperature predictions. I’m not saying the IPCC did a good job with mapping emissions to concentrations. What I’m saying is that the IPCC did a good job of mapping concentrations to temperatures. You’re saying they didn’t which is patently false. In fact, you’re posts are hyper focused on the erroneous belief that the IPCC does not understand CO2’s climate sensitivity and the relationship between concentration and temperature.
Nothing will deter beeswax from pushing his agenda. But he has shifted into coy-mode a bit:
“You keep saying IPeCaC. I don’t know who they are.”
Yeah right, repeating a lie again and again, another marxist tactic.
It’s Monckton’s pathetic attempt at humour, ipecac was a drug that was used to induce vomiting.
Thanks. I’d never heard of it and just assumed he was making an infantile toilet joke.
I’ve always thought it telling when someone repeats the same joke ad nauseam.
Ah…interesting. I googled it and saw it was a medication and immediately dismissed it as being irrelevant so I thought it referred to something else. Knowing that it is used to induce vomiting closes the loop for me. That is even more childish than what I was thinking. I was trying to figure out what derogatory words began with e and a.
Do you ever tire of posting the same tripe over-and-over?
“I never had sex with Monica Lewinsky!”
“Um, about that dress, Mr. President…”
Give me four guesses (scenarios) and I could predict the stock market index.
I’m not sure what the point is here or how it relates to my comment above.
The hapless and furtively pseudonymous “bdgwx” continues to misrepresent the head posting and IPCC’s reports. As the head posting makes explicit, the four scenarios A-D in IPCC (1990) are emissions scenarios.
As the head posting explains, the projected anthropogenic greenhouse-gas forcing on the basis of Scenario B emissions from 1990-2025 is identical to the projected anthropogenic forcing on the basis that emissions would not increase at all over that period compared with 1990.
However, in the real world, global anthropogenic emissions have actually risen by 53% since 1990. Therefore, scenario B (and likewise, a fortiori, the lesser-emissions scenarios C and D) is inapplicable. Scenario A is the scenario on which IPCC’s predictions in 1990 (which, at midrange, were the same as today) are to be judged.
No amount of fudging by “bdgwx” can conceal that fact.
And as I keep telling you the temperature predictions are based on concentrations; not emissions. It should be plainly obviously why. The reason…radiative forcing is not based on who is adding/removing GHGs to the atmosphere. It is based on how much GHGs are in the atmosphere regardless of how they got there.
Straight from the IPCC FAR SPM…
Notice that emissions do not factor into the temperature predictions at all. The only thing that affects the temperature predictions in this regard is the concentration of GHGs in the atmosphere.
You can call my statement of facts “fudging” all you want. You can call me “hapless and furtively pseudonymous” all you want (even though you know my name). It does not make the IPCC methodology of temperature predictions from 1990 any different than what they stated originally back in 1990.
Does someone need to show you all the headlines, blogs, and papers that show human emissions are responsible for ALL THE INCREASE in CO2 concentration? That means climate alarmists tag human emissions as the only source of climate change.
Keep on dancing in hopes that people will not notice what is going on out of their sight!
“radiative forcing … is based on how much GHGs are in the atmosphere regardless of how they got there”
“Notice that emissions do not factor into the temperature predictions at all.”
********************************************************************
Manmade CO2 emissions matter MORE THAN ANYTHING ELSE to the IPCC. You are a dimwit to say otherwise.
.
CO2, the primary manmade greenhouse gas, increases ONLY from manmade CO2 emissions. Nature is a net CO2 absorber. Humans and nature are the only two choices, unless you want to drag space aliens into this equation.
Manmade CO2 emissions – nature’s CO2 absorption = the atmospheric CO2 level increase
The increase of atmospheric CO2 since 1850 was 100% from manmade CO2 emissions.
So I have no idea what you are babbling about,
but I know you are babbling.
Manmade CO2 emissions cause the atmospheric CO2 level to increase. If you estimate CO2 emissions as equivalent to +5ppm a year and assume half of the manmade CO2 emissions are absorbed by nature, then the atmospheric CO2 increases +2.5ppm a year.
RG said: “Manmade CO2 emissions matter MORE THAN ANYTHING ELSE to the IPCC. You are a dimwit to say otherwise.”
That is patently false. IPCC FAR Chapter 1 pg. 8 figure 1.1 clearly shows emissions of 197 GtC of which only 7 GtC (3.6%) are anthropogenic.
But that is moot because temperature predictions are the result of the change in state of the atmospheric GHG mass; not who or what caused the change.
RG said: “Manmade CO2 emissions cause the atmospheric CO2 level to increase.”
Sure. But so does natural CO2 emissions. The only thing that matters in regards to the change in mass in the atmosphere is the magnitude of the sources and sinks. The agents that modulate those sources and sinks whether natural or anthropogenic have no bearing on how the law of conservation of mass plays out (*). In other words, had a natural agent boosted emissions by 7 GtC it would have had the exact same effect as the anthropogenic agent.
(*) Technically there is a very slight preference on the sink side on which CO2 isotopes are preferred, but it is several orders of magnitude less than what is required to have even a 1 ppm effect on the concentration.
The furtively pseudonymous “bdgwx”, who lacks the courage to post under its own name, also lacks the courage to admit its mistake in pretending that IPeCaC in 19909 did not make medium-term global-warming predictions based on emissions scenarios, of which the business-as-usual Scenario A is the closest to subsequent observation.
It is on Scenario A, therefore, that the wildly-exaggerated official predictions are to be judged, and not on the other, less accurate scenarios.
CMoB said: “The furtively pseudonymous “bdgwx”, who lacks the courage to post under its own name”
I’ve told my name multiple times. You just do the digital equivalent of putting your fingers in your ears and saying “la…la…la” as loudly as possible to avoid hearing it. Brian Gideon.
CMoB said: “ also lacks the courage to admit its mistake in pretending that IPeCaC in 19909 did not make medium-term global-warming predictions based on emissions scenarios”
What is the IPeCaC? Did you mean IPCC?
If we’re discussing the IPCC then NO they did NOT make global warming predictions based on emissions. They made global warming predictions based on concentrations. I even posted the exact text saying so. Again… you are doing the digital putting your fingers in your ears and saying “la…la…la” as loudly as possible to avoid hearing it.
Mr Gideon continues to be dishonest. It is made plain with a direct extract from IPCC (1990) in the head posting (which Mr Gideon may care to read before further commenting on it) that IPCC’s business-as-usual prediction is made on the basis of emissions scenario A.
From the emissions, IPeCaC over-predicts consequent concentrations and, from the over-predicted concentrations, further over-predicts global warming.
It is, therefore, emissions scenario A on which IPeCaC’s over-predictions of global warming should be judged.
And it is then necessary to adjust the estimates of how much (or, rather, how very little) global warming we may prevent, so as to take due account of the fact that IPeCaC has made such gross over-predictions.
CMoB said: “From the emissions, IPeCaC over-predicts consequent concentrations”
Yep. Which I’ve pointed out. I even made a graph of it.
CMoB said: “and, from the over-predicted concentrations, further over-predicts global warming.”
Patently False. Can you seriously not see the concentration inputs that they used for the temperature predictions? What concentrations in ppm, ppb, and ppt do you see as the inputs for CO2, CH4, and CFC11 respectively?
And who is the IPeCaC?
The answer to Mr Gideon’s question is that IPeCaC has not been anything like as rigorous as it should have been in stating the bases on which it made its various mutually incompatible and generally excessive predictions of global warming. Mr Gideon concedes that IPeCaC has over-predicted the concentration change arising from emissions growth. IPeCaC has also over-predicted the warming to be expected on the basis of concentration growth.
Either way, it is no longer possible for Mr Gideon to ignore the elephant in the room: the infinitesimal quantum of global warming that would be prevented even the whole world were to attain net zero emissions.
CMoB said: “Mr Gideon concedes that IPeCaC has over-predicted the concentration”
I have never mentioned the IPeCaC. I don’t even know who they are. Assuming that is a typo and you meant the IPCC then remember that I’m the one that pointed out the discrepancy between emissions and concentration.
CMoB said: “IPeCaC has also over-predicted the warming to be expected on the basis of concentration growth.”
This has to be a joke.
The furtively pseudonymous “bdgwx” continues to duck and dive dishonestly. If “bdgwx” has a name, let it use that name rather than posting under a furtive pseudonym.
Scenarios A to D in IPCC (1990) are emissions scenarios. Scenario A is the scenario that comes far closer to observed emissions since 1990 than any other.
The midrange medium-term prediction of global warming on the basis of Scenario A is 0.3 K/decade. The relevant passage appears in facsimile in the head posting. Outturn is 0.13 K/decade.
It is mendacious to try to suggest, as “bdgwx” continues to try futilely to do, that the predictions based on Scenario A are based solely upon concentrations. For the concentrations depend upon the emissions, and the warming depends on the concentrations and, therefore, ultimately on the emissions.
It is equilibrium doubled-CO2 sensitivity (ECS) that is derived solely from concentrations.
Medium-term warming is based on emissions scenarios and on the concentrations arising from those emissions. And it is Scenario A emissions that are far closer to outturn than those on Scenarios B, C or D. Get over it and move on.
CMoB said: “ If “bdgwx” has a name, let it use that name rather than posting under a furtive pseudonym.”
I do have a name. It’s the same name as all the other times you asked and I gave it to you. Brian Gideon. Burn that into your brain.
Of course, I have no idea what the relevance could possibly be here since the IPCC does not care about who I am nor would my identity have any impact either way what the IPCC said in 1990.
CMoB said: “Scenarios A to D in IPCC (1990) are emissions scenarios.”
Let me spell this out in a way there cannot be any confusion.
WGIII maps emissions to scenarios. emissions => scenarios.
WGI maps scenarios to temperatures. scenarios => temperatures.
WGIII is converting GtC/yr to GtC.
WGI is converting GtC to T.
It is a two step process.
CMoB said: “It is mendacious to try to suggest, as “bdgwx” continues to try futilely to do, that the predictions based on Scenario A are based solely upon concentrations.”
That is what I’m saying because that is what the IPCC is saying. You just refuse the read the document. Unlike you I don’t feel like I have the authority to misrepresent the IPCC so I state what the IPCC actually says instead of making up a strawman.
CMoB said: “For the concentrations depend upon the emissions, and the warming depends on the concentrations and, therefore, ultimately on the emissions.”
Nobody is saying concentrations don’t depend emissions. What is being said is that concentrations don’t depend on who is doing the emitting. That is the law of conservation of mass.
Furthermore, nobody is saying that concentrations don’t depend on human emissions either. It certainly does. What is being said is that the temperature predictions are based on concentration and concentration alone. That is stated in the IPCC FAR WGI SPM.
The issue is not that the IPCC WGI is making a bad temperature prediction. The issue is that the IPCC WGIII constructed poor scenarios based off an inadequate understanding of the carbon cycle and guesses on how humans would behave. WGI just uses the concentration values given to them.
CMoB said: “Get over it and move on.”
That’s like telling me to get over the belief that F=ma is wrong because I used F=ma to calculate the trajectory of a softball even though someone else was wanting me to do it for a shotput. You can’t claim someone’s understanding is wrong because you wanted them to have done their analysis using a different set of inputs.
And to show that I’m not being unreasonable here I’ll even tell you what it would take for me to accept that the WGI temperature predictions are wrong. What it would take is evidence that the concentrations of CO2, CH4, CFC11, etc. were a lot higher in 2020 than what WGI is stating they are using for inputs into their temperature predictions. Did they use higher inputs than what they stated? Can you provide that evidence?
Mr Gideon continues to be profoundly disingenuous and dishonest. The four scenarios A-D in IPCC (1990) are emissions scenarios. From the emissions, via the overestimated consequent concentrations, the still-more-overestimated consequent warmings are derived.
The emissions for Scenario A are closest to observed reality since 1990. Therefore, it is that scenario on which IPCC’s predictions are to be judged and found grossly excessive.
It matters not what the reasons for IPCC’s over-predictions are. They are over-predictions nonetheless. Therefore, those over-predictions must be adjusted for when deriving how much (or, rather, how very, very little) global warming even worldwide net zero might prevent by 2050.
No amount of further circumlocution or evasiveness by Mr Gideon will alter these facts.
CMoB said: “It matters not what the reasons for IPCC’s over-predictions are.”
Of course it matters. You have been telling people that the global average temperature prediction is wrong because the IPCC gets the climate sensitivity of CO2 wrong. Do you or do you not still maintain that position?
Another marxist stooge in action.
Mr Gideon has lost the argument and his temper. For purposes of the calculation in the head posting, it matters not one jot why IPeCaC over-predicted and still over-predicts. It matters that IPeCaC over-predicted and over-predicts. The over-prediction must be adjusted for in order to reach a correct determination of the quantum of global warming that global net zero emissions would prevent.
It appears likely that IPeCaC, in its anxiety to justify its existence by predicting catastrophic warming, has over-predicted not only the concentration change per unit of emissions change but also the global warming change per unit of concentration change.
CMoB said: “IPeCaC”
Who is this IPeCaC you speak of?
CMoB said: “has over-predicted not only the concentration change per unit of emissions change but also the global warming change per unit of concentration change.”
This has to be a joke.
Check the mirror.
Mr Gideon dishonestly attempts a bait and switch. The quotation from IPeCaC’s 1990 First ASSessment Report in the head posting shows that IPeCaC made its business-as-usual medium-term warming prediction of 0.3 K/decade, or 3 K/century, equivalent to 3 K per CO2 doubling, on the basis of the emissions scenario A. That fact is plainly stated in the quotation given in the head posting.
As established by me earlier in this thread, IPeCaC starts (like it or not) with emissions, proceeds from emissions to concentrations, and then proceeds from concentrations to global warming.
It is the Scenario A emissions that (like it or not) are far closer to reality than the emissions on Scenarios B-D.
IPeCaC also predicts equilibrium doubled-CO2 sensitivity based on the forcing equivalent to a doubling of CO2 concentration. We can get some idea of whether that prediction is sensible by noting that the total anthropogenic forcing to date, which is of order 3.5 W/m^2, is equivalent to the CMIP6 doubled-CO2 forcing, which is also of order 3.5 W/m^2 (Zelinka+ 2020, supp. matter).
Yet warming to date is little more than 1 degree. It is barely more than half the 1.8 degrees’ midrange transient doubled-CO2 temperature response given in IPeCaC (2021).
The calculations in the head posting correctly allow for these facts. It seems evident that IPeCaC over-predicted not only the concentration increase per emissions increase but also the temperature increase per concentration increase.
In any event, Mr Gideon is attempting, unsuccessfully, to divert attention from the main point of the calculation in the head posting, which is that even if the whole world attained net zero emissions there would be practically no effect on global temperature.
Once non-Communist Governments in the West realize that this is true, they will become less enthusiastic about collapsing their economies any further and letting jobs and industries and profits go forever to Communist-led nations paying no attention whatsoever to the global-warming nonsense.
In addition to being a staunch diehard defender of the IPCC, he also fervently believes that “adjustments” to historic temperature data (site moves etc.) remove all “bias”. He, along with the other trendologists, desperately need this in order to apply their magic 1/root-N and get to their fantasy milli-Kelvin uncertainty levels for global average temperatures.
Pushing an agenda is of course another marxist tactic, as you have so well pointed out in the past.
Even if the SEM is small, and it is not since “n” is sample size and not number of samples, the true issue is the variance of the data. The spread of the temperature distribution (not anomaly distribution) is what is important. That defines the uncertainty of distribution as defined by the NIST TN1900 document. The measurement uncertainty (both Type A and Type B) is negligible when compared to the uncertainty of where the mean lays based on the variability of the data
CMoB said: “It is the Scenario A emissions that (like it or not) are far closer to reality than the emissions on Scenarios B-D.”
That’s only true for emissions. But for concentration scenario A had CO2 at 430 ppm, CH4 at 2600 ppb, and CFC11 at 450 ppt. In reality CO2 was 413 ppm, CH4 was 1900 ppb, and CFC11 was 225 ppt in 2020. Remember, WGI uses the concentration as inputs; not emissions.
CMoB said: “IPeCaC also predicts equilibrium doubled-CO2 sensitivity based on the forcing equivalent to a doubling of CO2 concentration.”
Yes. They did. 2xCO2 equivalent is listed at about 4 W/m2 in figure 6 causing about 2 C of warming in figure 9.
CMoB said: “We can get some idea of whether that prediction is sensible by noting that the total anthropogenic forcing to date, which is of order 3.5 W/m^2″
As of 2020 and according to the IPCC total forcing was about 2.8 W/m2 that includes the -1.2 W/m2 of forcing from aerosols and land use changes. Note that the imbalance is +0.8 W/m2 which means the temperature has only responded to about 2 W/m2.
CMoB said: “Yet warming to date is little more than 1 degree.”
Berkeley Earth says about 1.2 C. But whatever let’s go with 1 C. That is 1 C / 2 W/m2 = 0.5 C per W/m2. And 0.5 C/W.m2 * 4 W/m2 = 2 C. It looks like the IPCC 1990 prediction is on track.
CMoB said: “In any event, Mr Gideon is attempting, unsuccessfully, to divert attention from the main point of the calculation in the head posting”
The main point in your posts over the years has been that the climate sensitivity assessed by the IPCC has been wrong.
Eastern Circulation in the Central Pacific. Will La Nina return?
http://tropic.ssec.wisc.edu/real-time/mtpw2/webAnims/tpw_nrl_colors/spac/mimictpw_spac_latest.gif
Are you sure El Niño is coming?

Since the mass of the troposphere is constant (deviations can occur during El Nino and La Nina) the global temperature is limited. Real climate change occurs when changes in solar activity result in changes in circulation in the stratosphere. The polar vortex in winter works its way up to the equator, as shown in the graphics below.
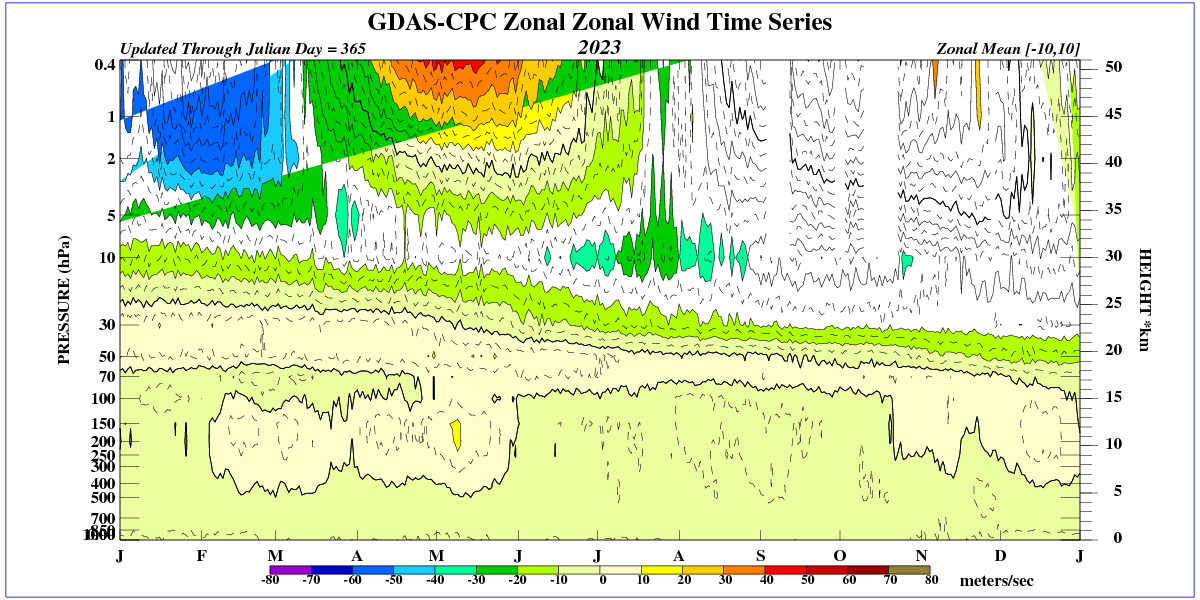

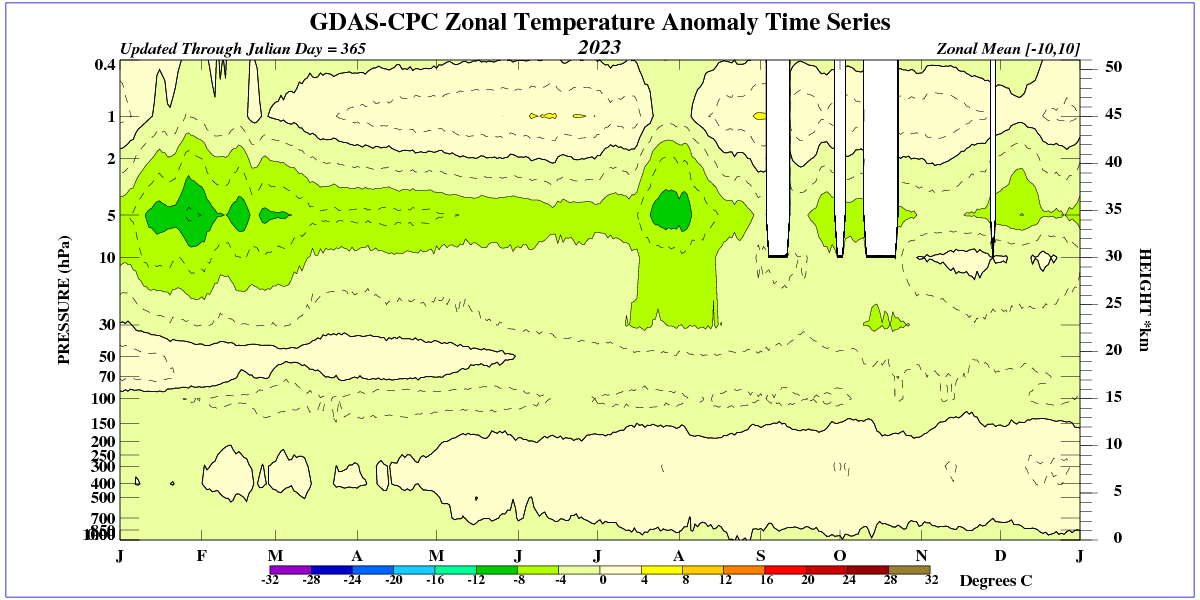
Does the circulation in the stratosphere from autumn to spring affect weather (and climate)?
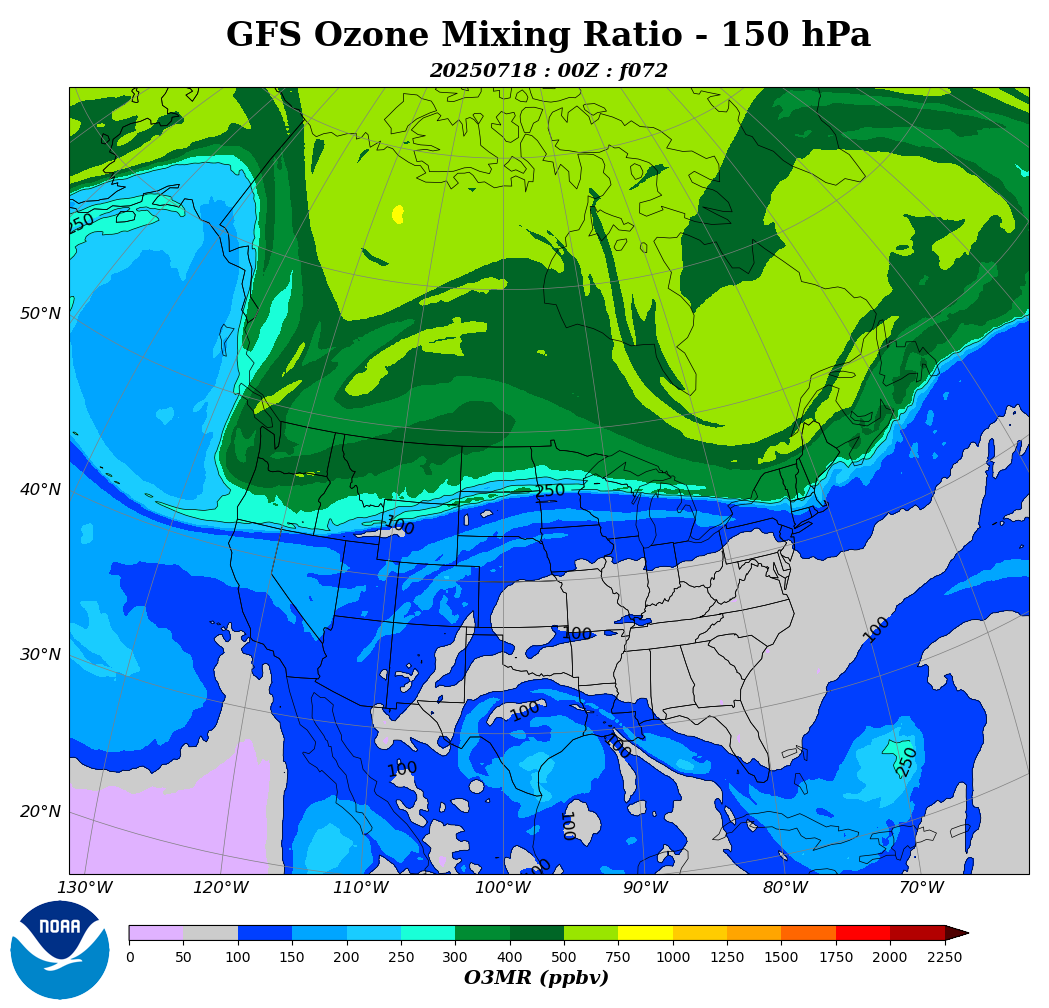
12F here this morning.
I am concerned by some recent remarks about the accuracy of past temperature measurement. While recent methods may be more accurate there is still valuable information to be gained from the earlier temperature measurements. For example, a close look at the record since the 1880’s shows a pattern of temperature change that is composed of about thirty- year long alternating periods of pause-in-warming and continuous warming that has been identified by various sources. This has occurred while atmospheric CO2 level has continuously increased over the same period. This lack of correlation between the temperature record and CO2 level increase is important and, to the best of my knowledge, has not been explained. It is also germane to note that, if the mentioned temperature pattern is brought forward then the recent temperature pattern should consist of a pause in temperature rise that began in 2005 and should last until 2034-5. It is also interesting to note that the second half of the past pause periods have featured a downturn in temperature (1900-1915 and 1960-1975) If this is repeated then the years from 2020 to 2035 should feature slightly decreasing temperatures. I would also like to say that the presence of El Nino and La Nina activity is a distraction from the pattern of temperature increase not a part of it.
If you look above Bellman shows how the increase in CO2 is not inconsistent with the global average temperature
https://wattsupwiththat.com/2023/04/03/the-new-pause-lengthens-to-8-years-9-months/#comment-3704302
I use a similar technique using the UAH timeseries.
https://wattsupwiththat.com/2023/04/03/the-new-pause-lengthens-to-8-years-9-months/#comment-3704404
The main takeaway is that these models show that CO2 creates a small but persistent force that modulates the long term trend while cyclic processes modulate the short term variation.
However, mere correlation, however ingeniously fabricated, does not necessarily entail causation.
Statisticians never seem to understand this.
How many times have I pointed out to you that correlation does not imply causation? I have never claimed that a statistical correlation between CO2 and temperature proves the causation. All it shows is you are wrong to claim there is no correlation.
You, on the other hand, seem to believe that a lack of correlation is proof of a lack of causation, even when that lack of correlation only exists in a short period when you would not expect to see any correlation.
If you had even the slightest causative hypothesis to offer then your continued posting of the two would be acceptable. As it stands it’s no different than continuing to post the population growth of storks in Denmark vs the number of births. They are highly correlated. SO WHAT? Unless you can offer a causative hypothesis for the correlation then it just remains a spurious correlation!
Face it. You are dissembling. You continue to post the graph hoping some will take it as a causative relationship while continuing to deny that you are not assuming a causative relationship.
“If you had even the slightest causative hypothesis to offer then your continued posting of the two would be acceptable.”
Have you been living under a rock the past 100 or so years. The hypothesis that CO2 is a greenhouse gas, and that increasing it will lead to warming has been quite well documented for quite some time. You might not agree with it, but pretending you’ve never heard of it is a bit of a stretch.
“You continue to post the graph”
Which is much more than you do. You keep asking for time series analysis, you keep talking about Fourier analysis, you keep claiming that the pause proves CO2 has no effect on temperature, yet you won’t ever provide your own evidence to back any of this up.
“The hypothesis that CO2 is a greenhouse gas, and that increasing it will lead to warming has been quite well documented for quite some time.”
A hypothesis should also include causative relationship that is testable. THAT HAS NEVER BEEN PUT FORTH. All we have at its base is that the correlation between CO2 growth and the temperature rise exists and that somehow suggests causation.
The pause is evidence that natural factors drive the temperature both up and down, even while CO2 is going up. Meaning CO2 is a minor, minor player if it is a factor at all. So why are we bankrupting the globe over CO2? It’s not science. It’s power politics and money.
If CO2 *is* a factor because it slows down heat loss then it is one that drives up the MINIMUM temperatures – a good thing for humankind. And it has *never* been explained how a warmer Earth at sunrise isn’t radiating more heat into space than a cooler Earth at sunrise. That radiation continues all during the day, meaning more heat is lost over the 24 hour cycle than it would be from a cooler Earth. That’s a feedback cycle that is negative thus driving temperatures to a lower equilibrium over time.
If CO2 was *really* inhibiting radiation to space then we would be seeing MAXIMUM temperatures go up as well as minimum temps. Yet that just doesn’t seem to be the case at all.
It’s why focusing on an AVERAGE is so misleading to most people. You totally lose all the data you need to make an informed judgement.
You are going to have to do a MUCH BETTER job on your hypothesis before it is ready for prime time – just like the IPCC!
“A hypothesis should also include causative relationship that is testable.”
What do you think my graph is doing? It’s testing the hypothesis. If you mean it has to first predict the size of the effect, than I disagree. It’s fine to say there will be a relationship, but difficult to know the size. Then you can look at the empirical evidence to see how much of an effect is happening.
“The pause is evidence that natural factors drive the temperature both up and down, even while CO2 is going up. Meaning CO2 is a minor, minor player if it is a factor at all.”
and there you go, claiming that correlation is causation. Could you quantify how “minor, minor” the effect is from your cherry picked period? What natural factors are you including and what correlation do you see?
“And it has *never* been explained how a warmer Earth at sunrise isn’t radiating more heat into space than a cooler Earth at sunrise.”
My (limited) understanding is that it should be radiating more. That’s the general point, the hotter a body the more it radiates.
“That radiation continues all during the day, meaning more heat is lost over the 24 hour cycle than it would be from a cooler Earth.”
Correct. But first it has to be hotter.
“That’s a feedback cycle that is negative thus driving temperatures to a lower equilibrium over time.”
How on earth is that meant to work? If a body is warmer than it’s equilibrium it will radiate more heat and cool down until it reaches it’s equilibrium. If it cools down to below it’s equilibrium it will radiate less and warm up until it reaches the equilibrium. That’s sort of what the word equilibrium means.
The real question is what may change the equilibrium, and that could be from a change to the input radiation, (e.g. the sun gets hotter or colder), or something changes that changes the amount of outgoing radiation. That’s how the green house gas hypothesis works. GHGs reduce the amount of outgoing radiation that in turn means the world has to warm up more until output is again equal with input.
“If CO2 was *really* inhibiting radiation to space then we would be seeing MAXIMUM temperatures go up as well as minimum temps.”
We are.
“It’s why focusing on an AVERAGE is so misleading to most people. You totally lose all the data you need to make an informed judgement.”
Yet this article and your claim about CO2 having a minor effect is based on AVERAGE temperatures.
Lots and lots of whining this fine morning.
Stop moaning. I’ve as much right to respond to Gorman’s comments as you have to post multiple one line whimpers.
Irony overload.
““If CO2 was *really* inhibiting radiation to space then we would be seeing MAXIMUM temperatures go up as well as minimum temps.”
Here are the BEST land figures for TMAX and TMIN since 1970. TMAX is actually slightly faster than TMIN.
TMAX = 0.29°C / decade
TMIN = 0.24°C / decade
https://berkeleyearth.org/data/
Berkeley Earth? You are kidding, right? I went through their data a year ago, in *detail*. They show temps from the late 1700’s and from the 1800’s with uncertainties in the tenths digit!
So how do they come up with answers in the hundredths digit?
And if you believe the uncertainties for temps 200 years ago were in the tenths digit then you will believe anything!
“Berkeley Earth? You are kidding, right?”
This is getting tedious. You, and you alone, made the assertion that global maximum temperatures were not increasing. I provided evidence you are wrong. Rather than just ignore any data you don’t like – you have to provide the evidence that maximum temperatures are not increasing.
“And if you believe the uncertainties for temps 200 years ago were in the tenths digit then you will believe anything!”
In case you failed to spot the numbers, I was only looking at the data since 1970.
“What do you think my graph is doing? It’s testing the hypothesis.”
No, it isn’t. You’ve provided no testable causative relationship. Correlation isn’t causation. All you’ve done is test correlation. I know that’s hard to understand for a statistician but correlation proves nothing. It can *disprove* but it can’t prove.
” Could you quantify how “minor, minor” the effect is from your cherry picked period?”
History from the time the first two rocks forming the Earth decided to hang together. CO2 has been higher today while temps have been lower.
“My (limited) understanding is that it should be radiating more. That’s the general point, the hotter a body the more it radiates.”
“Correct. But first it has to be hotter.”
“We are”
Actually we aren’t. Fewer record highs. Fewer 100F days.
I googled “is the earth’s average maximum temp going up”.
Not a single entry on the first three pages had anything on MAXIMUM temperature. NOT ONE. They all addressed the “global AVERAGE temperature”.
I looked at McAlester, TX number of 100F days. The 1950’s were the winner. So tell me how max temps are going UP?
“All you’ve done is test correlation.”
What do you think testing a hypothesis means in statistics?
“Correlation isn’t causation.”
Correlation does not imply causation. Correlation means there may be causation. Lack of correlation can demonstrate a lack of causation.
“It can *disprove* but it can’t prove.”
Exactly. And as always the point of my graph is that despite your claims, nothing in the data so far has disproven the CO2 hypothesis.
Bellman: “Could you quantify how “minor, minor” the effect is from your cherry picked period?”
Tim Gorman: “History from the time the first two rocks forming the Earth decided to hang together. CO2 has been higher today while temps have been lower. ”
I’m not sure if you understand what the word “quantify” means.
“Actually we aren’t. Fewer record highs. Fewer 100F days.”
Again, provide evidenced that maximum temperatures are not increasing.
“I looked at McAlester, TX number of 100F days. The 1950’s were the winner. So tell me how max temps are going UP?”
One place, using one odd metric. Provide evidence for maximum global temperatures
bellcurveman talks out of many corners of his mouth at the same time.
I appreciate your constructive criticism and will give it all the attention it deserves.
With yet more whining no doubt.
Absence of correlation necessarily implies absence of causation.
CMoB said: “Absence of correlation necessarily implies absence of causation.”
The correlation between UAH and TSI is only r^2 = 0.01. For comparison purposes the correlation between UAH and CO2 is r^2 = 0.48. Since there is no correlation between UAH and TSI do we conclude that the Sun is not factor on the global average temperature?
“Absence of correlation necessarily implies absence of causation”
It does not, necessarily. There can be many reasons why you fail to see a correlation despite causation.
It might just be there is insuffient data. Or there may be additional causes that mask the the correlation.
Indeed, as I keep trying to explain about my own graphs. But, as bdgwx says, the evidence is “not inconsistent” with the hypothesis. that CO2 is causing warming.
The main problem is that many here take your “pause” as evidence that CO2 has no effect on temperature, despite the fact that it’s a short carefully selected period, which would have been expected to show no warming simply because of the ENSO conditions.
“But, as bdgwx says, the evidence is “not inconsistent” with the hypothesis. that CO2 is causing warming.”
This is nothing more than assuming a causative relationship that is unproven. The rise in postal rates correlates with the rise in temperature also. So if I hypothesize that postal rates drive temperature, the correlation is not inconsistent with the hypothesis. SO WHAT?
“So if I hypothesize that postal rates drive temperature, the correlation is not inconsistent with the hypothesis. SO WHAT?”
So now all you need is an explanation of how changing postal rates can cause a change in global temperature. Then you can use the correlation to show that your hypothesis has not been falsified.
Ideally you would have come up with that hypothesis before seeing the evidence, rather than making a post factum argument, but at least we can test the competing hypothesis. Just get the US to lower it’s postal rates and see if it results in a statistically significant reduction in temperature. Then we could do the same with CO2.
“So now all you need is an explanation of how changing postal rates can cause a change in global temperature. Then you can use the correlation to show that your hypothesis has not been falsified.”
EXACTLY WHAT I ASKED YOU ABOUT CO2 AND TEMPERATURE!
How does CO2 cause a rise in minimum temperatures without also causing a rise in maximum temperatures? If your hypothesis can’t answer that then it is just “assuming correlation is causation”.
“EXACTLY WHAT I ASKED YOU ABOUT CO2 AND TEMPERATURE!”
And I explained that it’s well known there is a hypothesis claiming a causative link between CO2 and temperature.
“How does CO2 cause a rise in minimum temperatures without also causing a rise in maximum temperatures?”
Irrelevant to the the question of whether there is a causative hypothesis. And nonsense, because both maximum and minimum temperatures are going up with CO2.
As always, you keep moving the goal posts. First you want to claim there’s some sort of equivalence between a non existing hypothesis that risisng mail costs will change temperature, and the well established hypothesis that rising CO2 will cause temperatures to rise. Then you switch to insisting I do a full attribution study to prove the link between CO2 and temperature.
“And I explained that it’s well known there is a hypothesis claiming a causative link between CO2 and temperature.”
What hypothesis? The only one I can find is the assumption that correlation is causation. I can’t find one single causative hypothesis that can actually be tested experimentally. NOT ONE.
Without that all you can possibly have is the assumption that correlation proves causation.
I’m not asking *you* to do any kind of a study. All you need to do is find a reference that shows an actual experimental confirmation of the proposed causative affect. All *I* can find is your “well CO2 is going up and so is temperature so CO2 must be causing the temperature rise”.
I’ll give you one. Higher temp cause mail trucks to use more air conditioning which the condenser then puts more heat into the atmosphere raising temperature further. Even has a feedback built in.
More likely I suspect is there is a correlation between postage rates and industrialization, inflation and fossil fuel usage.
Checking this for myself, here’s a graph of US Postage rates compared with Temperature.
The correlation is very good, with temperatures rising 0.0186C for each increase of 1 cent. R^2 is 0.73.
It’s clear that US postage were very flat until the 70’s and have been increasing at a much faster but more or less linear rate since then. This coincides with the point temperatures and CO2 started to increase at a much faster and more or less linear rate.
Here’s a comparison of postage rate (in red) and CO2 (in blue), using annual averages.
R^2 for postage is 0.80, for CO2 it’s 0.87.
Correct. It does not necessarily imply causation. But, it does imply that pauses are not inconsistent with it being a cause. And remember, CMIP5 says pauses lasting 9 years should be so common that we should find ourselves in one nearly 20% of the time.
“ But, it does imply that pauses are not inconsistent with it being a cause”
Malarky!
This is based on two basic assumptions.
If these assumptions were true we would be seeing global maximum temps going up as well as global minimum temps because the Earth wouldn’t be able to shed all the heat input received during the day. But that doesn’t seem to be happening.
It’s a false picture being presented by using an AVERAGE temperature vs CO2 where the average temp hides what is actually going on.
It’s still all based on the ASSUMPTION that the correlation proves causation.
What climate science needs to do is move to a measurement protocol that actually provides the data needed to prove or disprove the hypothesis. We’ve had the capability of collecting data for over 40 years to do something like an integrative heating/cooling degree-day calculation. Or to do an integrative average temp. Yet climate science adamantly refuses to even consider starting to actually collect and use this kind of data.
Agricultural science has moved on to using these methods for determining growing season factors. HVAC engineers have moved on to using these methods for sizing heating/cooling systems. Why can’t climate science do the same?
And trendologists will never acknowledge that endless averaging throws away valuable data.
Are you going to explain that to all the true believers in the pause here? And for that matter have you explained to Lord Monckton why his whole argument is flawed because it relies on the meaningless UAH data? Do you still claim the uncertainty of a monthly anomaly is grater than 1°C?
Or are you just going to continue to amuse yourself with the word “trendologist”?
Once again, Monckton is hoisting the climate alarmists on their own petard. You’ve been told this multiple times. Do you take Prevagin?
Don’t quibble, unless that’s all you have left by way of what passes for argument.
Are you agreeing with Tim, that the intention of your pause posts is to hoist “alarmists” on their own petards? Does that mean you don’t think there is any validity in looking at the trend over the last 8 years, and you are just hoping an almost will believe it?
Still can’t read, eh?
Still avoiding the question.
Yer daft—you’ve been told many many times that I refuse to play your word games.
So ask away, see how far it gets.
Which is what I mean when I say you are avoiding the question. I don’t expect you to answer, but anyone can draw their own conclusions about why you refuse to answer.
Yes, it’s such a skilfully done p*** take that even when it’s pointed out they won’t believe ye.
It’s on a par with the April Scientific American article decades ago about Europeans having drunk alcohol for millennia because the water wasn’t safe.
Even better, like Lucy, Charlie Brown, and the football, it works every time.
“?
?
?
?”
Yes, you are clueless.
I’ll take that as a no.
No, I won’t participate in your kook-dance. And you are no position to put demands on anyone.
Of course you won’t. That’s why your tantrums are so amusing.
If Bellman does not like the UAH temperature record, then let him get his Russian Embassy to complain to the State Department about it.
And if Bellman were less of a Communist and, therefore, more willing to learn, it would understand that on most other temperature datasets the New Pause is longer than on the UAH dataset.
I’m not the one who has a problem with UAH. It’s Karl Monte, who thinks the monthly uncertainty is at least ± 1°C, and therefore it’s impossible to know what the actual trend is.
And if Lord Monkton wasn’t so obsessed with libelous ad hominems, he might remember that I was the one who suggested that he should look at the length of the pauses in other data sets. The point was to counter his claim that pauses only happen because of the slow rate of warming. Most data sets show faster warming than UAH yet also have longer pauses – hence the length of the pause tells you little about the rate of warming.
That you lack real measurement uncertainty training, knowledge and experience is not my problem, bellcurvewhinerman.
Nice deflection. Do you have a problem with UAH data or not?
bellcurvewhinerman still posturing for the “lurkers” with goofy questions.
A summary.
Furtively pseudonymous karlomonte keeps claiming that UAH data is very uncertain and it’s impossible to tell if the overall trend is up or down.
He doesn’t think this is relevant when praising Lord Monckton for his posts all based on looking at the trends in UAH data.
When furtively pseudonymous Bellman questions him on it, Lord Monckton grabs hold of the wrong end of the stick and attacks Bellman for saying there is a problem with UAH – and being Monckton calls Bellman a communist for not believing in the accuracy of the UAH data.
Having corrected Monckton, Bellman is then criticized by karlo for not having real uncertainty training.
When Bellman asks karlo to make it clear if he does or does not think there is a problem with UAH, he naturally declines to answer, and digs deep into his short list of meaningless insults, rather than answer the question.
He won’t answer the question because if he says there is a problem with the UAH data, there’s a risk that his hero will attack the psudoneymous karlo in the same way and start labeling him as a Russian propagandist.
In Bellman’s world all measurement uncertainty disappears as you average the stated values. He doesn’t live in the real world.
Is this “real world” you live in the one where you ignore everything I’ve ever said and just make stuff up? I do not think that all measurement uncertainties disappear. I don;t know anybody who has said that. What I don’t think is that UAH data has a monthly uncertainty of 1 to 2 °C, or whatever is currently being claimed.
When I tumbled to the fact that a mid-range value throws away Tmax and Tmin, which are what actually determines climate, I knew the concept of a “global average temperature” was fatally flawed. When two different locations with different climates can have the same mid-range value you’ve lost the ability to differentiate climate using the mid-range value.
But we’re getting Pauses of order 9 years a lot more than 20% of the time: a further indication of the extent of IPeCaC’s over-prediction.
And it is a logical fallacy to found any argument for causation on a correlation, other than to say that the absence of correlation necessarily entails absence of causation.
A correlation in itself tells us nothing of causation. For there may, for instance, be a third phenomenon driving the correlated phenomena: or the correlation may be purely accidental. This one is beginning to look more and more as though it is accidental.
These trendology persons lack decent/proper science and engineering training, so they won’t understand.
You do realise these articles are based on simple linear trends?
Yes, you are clueless.
I’m just trying to figure out what you mean by “trendologist”. You seem to think it’s some sort of insult, yet apply it to me when I keep objecting to the trends presented here.
Trendologists, which includes many climate scientists, keep trying to “prove” something based on simple times series when time is not part of the functional relationship of CO2 and temperature.
LINEAR regression is used to show a linear relationship between two causal variables. When time is not a casual variable, a time series will never, ever prove anything.
Exactly right, trendologists study trends, as the literal sense plainly indicates, not climate.
If I type in “what is a trendologist” into a well known search engine, virtually every entry over the first few pages is talking about food trendologists. It seems to be very much that industries buzzword. The only other reference I can find to trendology is about real time marketing.
That sounds like a personal problem for you. Doesn’t bother me in the least!
He’s on an epic rant today.
It’s a personal problem for me in that I’m the one being insulted with some meaningless slur. It’s not a problem for you as nobody insults you with it. Maybe, rather than going on these epic explanations, I should just take the karlo method and start responding with one line taunts.
Try “chartist” instead of “trendologist”
“Trendologists, which includes many climate scientists, keep trying to “prove” something based on simple times series when time is not part of the functional relationship of CO2 and temperature.”
Could you give an example of a climate scientist or me doing this. And why are you still talking about functional relationships? There is no functional relationship between CO2 and temperature.
“LINEAR regression is used to show a linear relationship between two causal variables.”
It’s not that important, but linear regression does not have to describe a linear relationship.
“When time is not a casual variable, a time series will never, ever prove anything.”
Why do you keep being so absolute? A regression over a time series can show a lot of things. At the least it shows how something has changed over time. It doesn’t matter that time is not the direct cause of that change. Measuring how fast a car is going is useful even if time is not causing the car to move.
ROTFLMAO! Tell that to the IPCC and WMO. If CO2 is not the control knob that is going to destroy the world, why do all the scientists, modelers, and others contribute to the IPCC who, like it or not, has CO2 as the molecule necessary to reduce in order to stop global temperature warming.
What has that rant got to do with the question? You are claiming that people are proving things based on simple time series.
You can;t have it both ways. You can’t complain that people are treating time as the cause of warming and then say they are claiming COL2 is the only cause of warming.
Have you been sipping the everclear?
You should have said ATTEMPTING to prove. The hypothesis is that CO2 is increasing over time and temperature is also. A time series graph shows increasing temperature and we know CO2 is also increasing. CO2 is the cause of increased temperatures. QED
The fly in the ointment is that pauses are contrary examples to the hypothesis. The hypothesis is disproved, QED
“The hypothesis is that CO2 is increasing over time and temperature is also.”
No, that’s an observation, not a hypothesis.
“A time series graph shows increasing temperature and we know CO2 is also increasing. CO2 is the cause of increased temperatures. QED”
Nobody says that. And it’s got nothing to do with your claim that people are only looking at the change over time.
“The fly in the ointment is that pauses are contrary examples to the hypothesis.”
It is not. You still keep ignoring the point that the correlation between CO2 and temperature has increased over the pause period.
“The hypothesis is disproved, QED”
That’s not how it works. You don’t reject 45 years of data showing a significant correlation,, just because a small subset of the data doesn’t show a significant correlation.
Don’t be coy (leave this for beeswaxer), you know exactly what it means.
Much as you might think I’m some sort of genius who knows exactly what’s going on in your head, I really don;t know what you mean by the term.
I can see on the web lots of references to trendology and trendologists, but that just seems to be some trendy marketing BS for people who predict trends in fashion and food. It’s not something I’ve ever tried to do. I don’t know how many times it needs to be said, but I am not trying to predict the future, at least not as far as climate is concerned. All I’ve ever done is look at the past data to see what has happened, and to give the lie to claims that warming has stopped. I don’t even claim it hasn’t stopped, just that at present there is no evidence, and a meaningless trend over eight years proves nothing.
Again, the only person I see here making any forecasts based on the current linear trend is Monckton, when he says
CMoB said: “But we’re getting Pauses of order 9 years a lot more than 20% of the time:”
Of the 532 months in the UAH record only 118 have been included in a pause lasting 105 months. That is 118/532 = 22%. That’s a bit higher than expectation, but not by much.
CMoB said: “the absence of correlation necessarily entails absence of causation.”
You need to be careful with this statement. The lack of correlation could be caused by insufficient data or other factors that offset, dwarf, or otherwise hide the signal you are looking for.
For example, the correlation between TSI and UAH is r^2 = 0.01. That is about as low of a correlation as you can get. Yet nobody is going to seriously reject TSI as having a modulating influence on the global average temperature because of a the perceived lack of correlation here.
Total BS, “TSI” is itself an annual average that does not account for diurnal and orbital variations.
Such inconvenient little details are too tough to think about for climastrologers and trendologists.
If anyone is waiting for El Niño, they will be waiting a long time.

Sunspot number: 37

Updated 06 Apr 2023
Is there any possibility that the Earth’s temperature, as discussed here, is the result of the nature of the Earth’s orbit around the Sun. After all, CO2 currently is only 4/100th of one percent of the atmosphere. Thats not small, as someone suggested, that’s tiny. I also want to repeat what I said earlier about paying attention to the temperatures of the years from now until 2035. If the temperature pattern repeats then they should feature lower yearly temperatures. The rash of deadly tornadoes being experienced this year may be a harbinger of the Spring weather to come as colder air fronts persist later into the Spring than usual.
Clearly, the sun affects the climate. Firstly, the distance in orbit (that’s why the average temperature in the southern hemisphere in winter falls faster than in the northern hemisphere), and secondly, the angle of inclination of the Earth’s axis with respect to the plane of orbit affects climate changes over long periods. In shorter ones, solar activity is important, which affects the circulation in high latitudes. A measure of these changes, are changes in galactic radiation.
