Foreword
This report was originally written in mid-2019 in the hope that it would be published by the Competitive Enterprise Institute which had expressed an interest in its results. After some very slow editorial adjustments, its publication was postponed by the appearance of Covid. When Covid came to an end it was supposed to be published alongside a report by Pat Michaels. But it was left in abeyance when Michaels died last year. It only recently dawned on me that I could probably publish it on this website and I offer my thanks for the opportunity to do so.
Editor’s Note
With the imminent release of the 5th NCA expected sometime in the next few months, we felt this piece would be an excellent lens through which to view the upcoming report.
By Stan Liebowitz, Ashbel Smith Professor, Department of Economics and Finance, School of Management, University of Texas at Dallas
Most of the analysis and disputation regarding climate change is centered on how many degrees the climate is expected to warm over the current century. But an equally important question that has not received as much attention is whether there will be much economic harm from global warming. US legislation has required that the government study how an increase in temperature might affect the US economy in addition to the question of how much warming might take place.[1] These analyses, in the form of National Climate Assessments, take place every four years, with the last one (the fourth) in 2018 and the next one due in 2022.
On November 29, 2018, Black Friday, the federal government published Volume 2 of the Fourth National Climate Assessment (NA4), a 1,500+ page document examining the future economic cost of climate change.[2] The fact that it was made public during a holiday weekend was interpreted by many in the media as ominous evidence that the Trump administration was trying hide the report to limit political damage. The report, which the media nonetheless reported with great fanfare, was described as “dire” in The Atlantic, CNN, and Politico, as predicting “mass deaths and mayhem” by CBS News, “collapse and ruin” by Wired, and as demonstrating that “we’re screwed” according to Gizmodo.[3]
Admittedly, the tone of the NA4 is consistent with these apocalyptic descriptions in the media, describing unending fires, hailstones, storms, droughts, and floods, while showing riveting full-page color pictures of mountainsides blazing at dusk and houses being washed into the sea. That document is still the most recent official analysis of the costs of climate change harm to the US.
But despite all the doomsday descriptions, the projected costs of climate change found in the body of the report imply nothing remotely like doomsday. In fact, the damages estimated by the report are quite paltry in the big picture of things, less than 1 percent of future GDP, as detailed below. Certainly, the climate change damages portrayed in the report are far too small to warrant costly and disruptive actions, such as those proposed in the Biden administration’s version of the Green New Deal.
After the report’s release, Al Gore opined about the NA4’s results: “scientists and experts have made [the costs of climate harm] as stark and clear as possible.”[4] Unfortunately, this was not true. In fact, the lead authors of the NA4 meticulously avoid being “as stark and clear possible” by leading the reader to believe that the costs are much higher than those actually found in the body of the report.
The NA4 Examination of future economic harm.
The NA4 focuses on the year 2090 because the 1990 legislation that established the National Climate Assessment wanted predictions for the next century. The NA4 states that it is a “thorough examination of the effects of climate change on the United States.”[5]
Of course, any predicted future harm depends on the predicted actions that the U.S. and other countries take between now and then to mitigate the effects of climate change. The report discusses several possible types of actions countries could take to limit their emissions of carbon dioxide (CO2) and discusses various scenarios of greenhouse gas concentration levels. The most damaging and least realistic scenario, labelled RCP8.5,[6] assumes that global carbon emissions keep increasing through the end of the century to almost triple their current yearly rate, while overall concentrations more than double.[7] The NA4 also reports, with less emphasis, the harm from a less pessimistic scenario, RCP4.5. The Trump administration criticized the NA4 for focusing on the worst-case scenario (although it should have welcomed the findings given how small the predicted damage is). Since then, it has become more commonly accepted that RCP8.5 is overly pessimistic. In the work that follows, I report the evidence presented by NA4 for both the 4.5 and 8.5 scenarios.
The NA4 report predicts the 2090 economic damage from climate change. It estimates the dollar value of 22 different categories of potential damage from global warming, measured in 2015 dollars. These categories of damage include harms such as those predicted from rising oceans, mortality from excessive heat or poor air quality, costs from climate-related diseases such as West Nile Virus, and repairs for roads or bridges that are damaged by floods or erosion. Predicting anything 70 years into the future is normally considered a fool’s errand, but such prognostications are required when most of the harm is not expected to be manifested until many decades in the future.
These predicted 2090 damages represent the end product of the NA4 report.
What Is the Total Damage and Why Is it Hidden?
The dollar values (measured in 2015 dollars) of the predicted 2090 damages for these 22 categories of potential harm are found in the NA4’s Figure 29.2, reproduced below.[8] Note that in addition to the predicted damages under the RCP8.5 scenario, this figure also includes smaller predicted damages under RCP4.5, now generally acknowledged to be the more likely of the two. The analysis also pessimistically assumes that no technological improvements over the next 70 years will be used to mitigate the effects of climate change. I will assume that these NA4 estimates are correct (although many criticisms can be levelled at them). Thus, for the purposes of this analysis, I am not taking issue with their detailed results but instead with their summarization and presentation of the results.
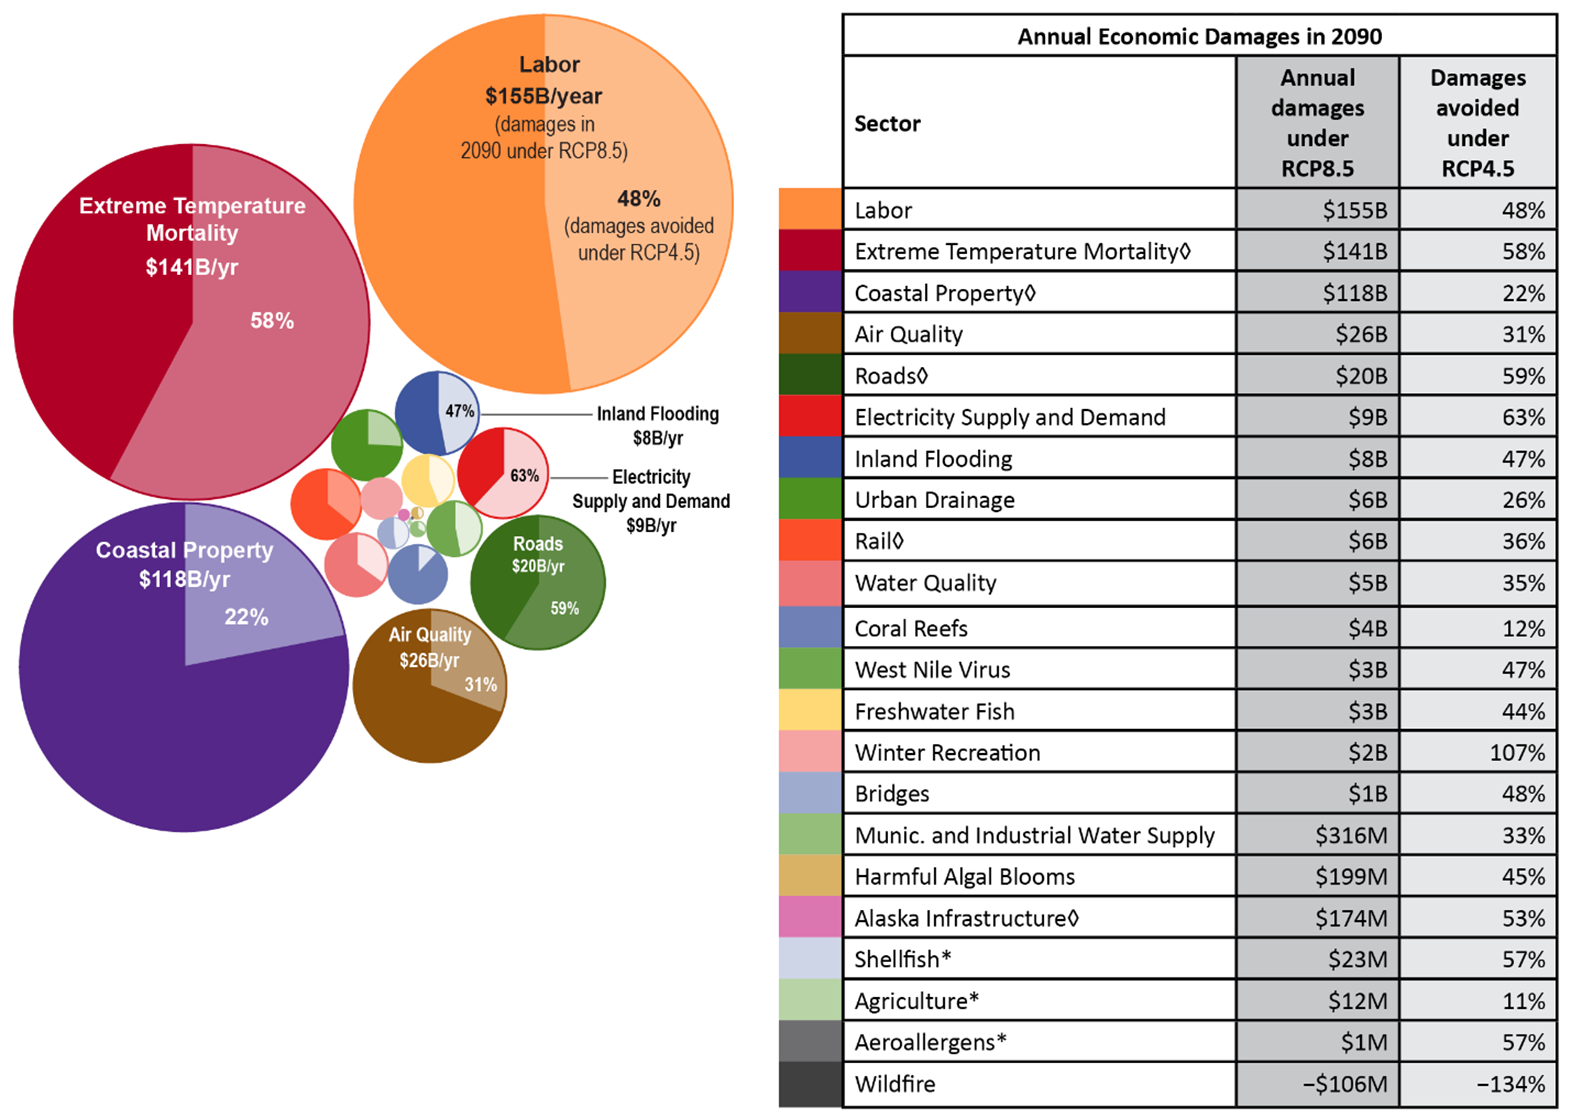
Figure 29.2 (from NA4)
Strangely, there are two tasks that the NA4 does not undertake. First, the 22 categories of climate-induced harm are never summed to determine the total dollar value of climate-induced damage.[9] Second, these damages are never compared to the approximately $70 trillion GDP (about three and a half times as large as the current GDP) [10] that NA4 believes will exist in 2090.[11]
It is stunning that the NA4 never explicitly total the twenty-two rows of climate-induced costs, since it is the sum of these harms that measures the total economic damage from climate change. Why create a table of harms and not add them together? Surely a single number that encapsulates all of these harms should be essential to any reasonable analysis of the issue.[12]
When the values in the rows are summed, the total 2090 damages are $508 billion annually (or $284 billion for RCP4.5), as seen in Table 1 below. A cost of $508 billion appears to be a huge number, but it needs to be put into perspective. The simplest way to do so is to compare this predicted 2090 cost with the predicted 2090 GDP, as is done in the last row of Table 1, which leads to a clear result that predicted climate change damages in 2090 represent slightly more than seven tenths (or four tenths) of one percent of the GDP. This value would be even lower if any of the advanced technologies certain to be created in the next 70 years were used to help reduce carbon emissions.
| Table 1: Adding the Damages and Comparing to GDP | ||
| RCP8.5 | RCP4.5 | |
| Total Damages ($Billions) | $508 | $284 |
| Damages as share of $70 trillion GDP | 0.73% | 0.41% |
The tiny size of the damage relative to GDP should be arresting to anyone who has paid attention to the climate change claims. Is a reduction in GDP of seven tenths of 1 percent seventy years in the future really something to seriously worry about? To even ask the question is to answer it. The stock market routinely loses 1 percent in a day and no one thinks it is a calamity. How many stores run advertisements proclaiming their 1 percent-off sales? Would most people even notice an unannounced 1 percent change in their paycheck? Realistically, 1 percent is not the type of value that gets people excited. It would normally be treated as a rounding error, not a value that should cause life-altering decisions.
These small costs should be further diminished because they occur far in the future and therefore should be discounted (converted to “present values” in economics parlance). The amount we should be willing to spend now should be far less than the nominal cost of these damages that occur far in the future.
Yet, the NA4’s discussions of the importance of the damages, to the limited extent they are undertaken, seem intended to mislead readers. Its authors’ main attempt to put these damages in perspective (in the initial summary of the report) is to contrast the three largest categories of 2090 climate-induced damage to the current GDP of small U.S. states, stating, “annual losses in some economic sectors are projected to reach hundreds of billions of dollars by the end of the century—more than the current gross domestic product (GDP) of many U.S. states.”[13] This comparison is disingenuous and wrong.
First, this is disingenuous because it is an irrelevant comparison. What difference does it make if some of these climate costs are larger than GDPs of some states? Some states have GDPs that are very tiny shares of the national GDP. Vermont, for example, generated only 0.16 percent of the 2021 national GDP. The climate change damages are calculated for the entire country, so the entire country’s GDP is the correct comparison, not the GDP of some small states. This is a misleading instance of comparing apples to oranges.
Second, it is a violation of basic economic principles to compare current economic values (state GDPs) to 2090 climate damages. As already mentioned, when comparing current to future values, we need to take present values. Further, the real (inflation-adjusted) GDP is expected to more than triple by 2090. We should want to compare these values in the same time period, as is taught in economics textbooks. We could adjust the value of 2090 damages to the present time in order to compare them to current state GDPs, which, with typical interest rates, would greatly lower the value of the future damages. Or, more simply, we could compare the 2090 state GDPs to 2090 climate costs. Adjusting current state GDPs to 2090 values,[14] and assuming that states kept their relative sizes, only Vermont and Wyoming would have 2090 GDPs less than the largest cost in Figure 29.2, not the “many” states claimed by the NA4.
Although it boggles the mind that the NA4 authors never perform the simple and obvious comparison found in Table 1, their failure was one of omission. Next, I discuss an offense of commission, the replacement of the results discussed in the report’s prior 1400 pages with those from a different study (with conflicting results), without alerting the reader to this switch.
Did the NA4 authors intentionally include misleading results?
Among the most troubling aspects of the NA4 is what appears to be a sleight of hand intended to disguise the unimportance of their estimated damages. It is bad enough to never straightforwardly perform an actual comparison of the predicted costs to the predicted GDP (as I did in Table 1), which is the most natural way to put the costs in perspective. But the NA4 authors go further and insert a diagram (Figure 29.3 which is reproduced nearby) that appears to make this comparison. But the right-hand portion of this diagram is taken from an entirely different study dropped into the NA4 essentially without comment!
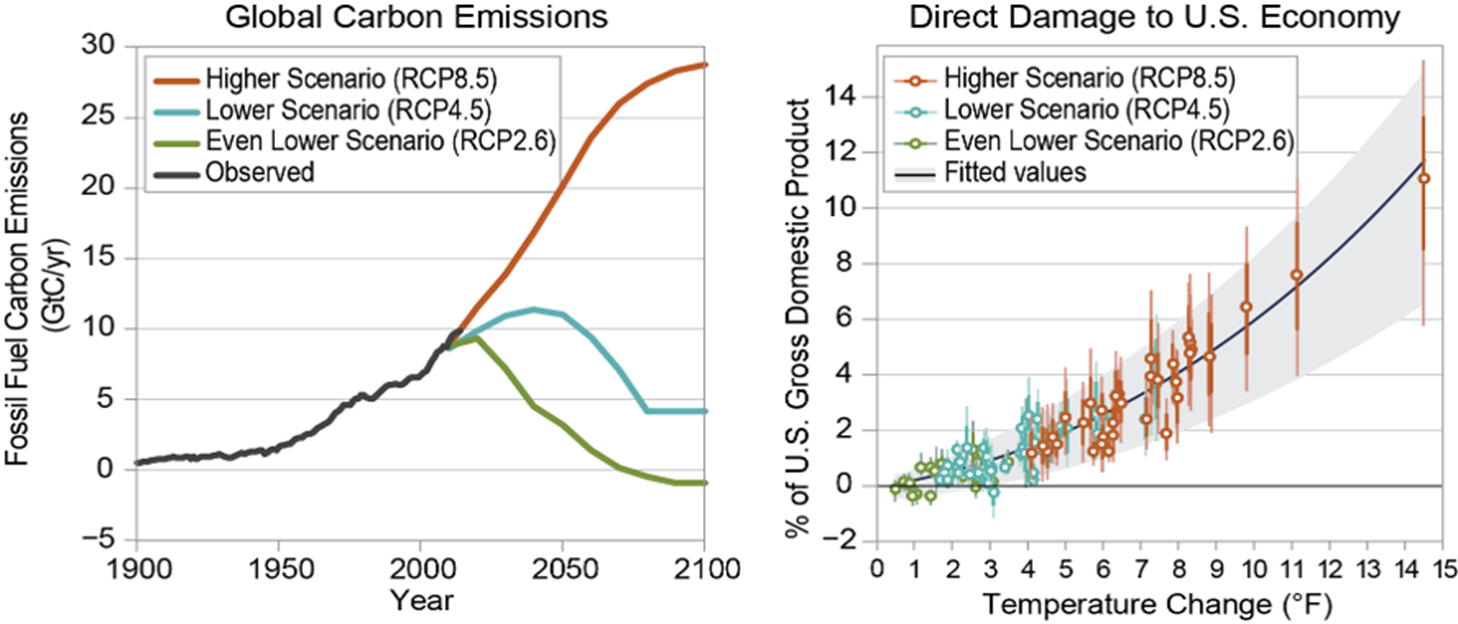
Figure 29.3: Estimates of Direct Economic Damage from Temperature Change
The NA4 authors apparently hoped to induce readers to draw their own incorrect conclusions because readers are not told in a clear and direct manner that the diagram is the product of a different analysis. That diagram comes from a 2017 study published in Science, which includes only 5 of the NA4’s 22 categories of harm, but adds the category of “crime” which is predicted to increase with global warming.[15] Any confusion about the provenance of this graphic is important because the Science study estimates that climate change damages would be about six times higher than those found in the NA4 report for comparable increases in temperature. The Science study also considers temperature increases outside the NA4’s expected range.
A casual reader encountering Figure 29.3 and its heading is likely to think that the damage values in the right-hand side of figure are taken from those reported in the prior 1400 pages of analysis and then converted into share of GDP. But it is not. The only size comparison of climate harm relative to GDP made by NA4 authors from their own analysis is the already discussed unsuitable comparison with the current GDP of small states.
The reader might ask: “how can that be, given the inclusion of this diagram?” The answer is that the NA4 authors do not comment on this figure. The only statement by the authors regarding Figure 29.3 is: “Looking at the economy as a whole, mitigation can substantially reduce damages while also narrowing the uncertainty in potential adverse impacts (Figure 29.3).”[16] But the NA4 authors had already made this point in a lengthy discussion of Figure 29.2 (the list of 22 types of economic damage shown previously), particularly its right-most column showing the lower costs for RCP4.5. Figure 29.3 was completely unnecessary to make this point.
In spite of these shenanigans, the NA4 authors have technically protected themselves from a claim that they are trying to mislead readers because they (the NA4 authors) do provide a citation to that Science study which allows them to claim that readers should have understood that the right-hand portion of 29.3 is not based on the NA4 analysis. But to understand this requires that readers go the very end of a 219 word note at the bottom of the figure where it lists sources, and then draw the correct inference that it is not based on NA4 results. In reality, they have hidden this information from most readers.
If the goal of the NA4 authors was to have readers come away believing that the NA4 predicted climate change damages were much larger than the actual NA4 numbers, the authors appear to have succeeded brilliantly. For example, they fooled Steven Koonin,[17] a physicist at New York University and former Undersecretary of for Science in Obama’s Energy Department, who thought that NA4 damages were about six times higher than the actual number because he apparently didn’t realize that the right-hand portion of Figure 29.3 came from a different study. This misreading appeared, ironically, in his opinion article (recapitulated in his very useful recent book) claiming that the NA4 costs were surprisingly low even though the costs he thought were low were inflated by a factor of six.[18]
Also falling into this trap (most likely willingly) were virtually all major media outlets, with many making claims that the NA4 predicted a 10 percent future GDP decline due to climate change—e.g., The New York Times and CBS News.[19] This belief would seem to have necessarily come from seeing the highest circle in the chart because there is no analysis in the rest of the report that might allow a reader to reach that conclusion. Note that it is doubtful that rational people would consider even a 10 percent reduction in GDP 70 years in the future to be large enough to warrant major transformations in our way of life. As Koonin realized (but the Times and CBS did not), even these exaggerated measures of harm are fairly innocuous. A 4% reduction in 2090 GDP (which is Koonin’s understanding of the Science chart) is made back after two years, so that the final GDP is achieved in 2092 instead of 2090. Similarly, a 10% reduction would postpone this level of GDP only until 2095.[20] Of course, as we have seen, the actual predicted NA4 damage is a much smaller 0.7 % or 0.4 % under RCP8.5 or RCP4.5. This means that climate change’s effect is to postpone the 2090 GDP to be reached on March 1, 2090 or May 1 2090, instead of January 1, 2090, for 4.5 and 8.5 respectively.
Given these findings, I find it hard to avoid concluding that the NA4 authors intentionally tried to mislead readers about the small size of the expected climate-induced economic damage. Perhaps there is a more innocent explanation than the one put forward here, but it is far from clear what that might be.
Looking at these damages through a slightly different lens
Finally, the climate harms found in the NA4 can be put into a slightly different perspective other than to just compare it to the GDP. The authors of NA4 use the economic concept “value of a statistical life” (VSL) when measuring some climate harms. VSL measures how much people would pay to avoid a greater risk of death.[21] Using VSL allows us to make a different type of comparison that might provide more intuitive understanding of the size of the predicted climate change damages found in NA4.
For example, people dying from falling is currently an important cause of accidental death in the US. The VSL-estimated damage from people dying after falling, relative to GDP, is more than three times the NA4 estimated harm from climate change relative to GDP, using the more realistic RCP4.5 scenario.[22] Alternatively, the current damage from suicide deaths is four times as great as predicted climate damage (relative to GDP), and deaths due to flu or pneumonia (prior to Covid) cause five times as much damage as predicted climate damage. Damage from all cancer deaths, ignoring treatment costs, is more than fifty times as great as climate change.
The category of death with costs most similar to projected climate change damage is cancer of the esophagus (whose costs are only thirty percent higher). This means that we should consider climate change as a problem similar in size to that of esophageal cancer. Imagine if world leaders were to suggest spending $120 trillion over the next 15 years, an amount currently estimated as the cost of fighting climate change, to combat cancer of the esophagus. Or spending that much to combat accidental falls. It would likely be considered absurd by any rational person.
Although society tries to reduce deaths from falls, suicides, and esophageal cancer, no one has suggested uprooting our entire economy in order to reduce one of these causes of damage. Even efforts to find a cure for all cancer, whose damages dwarf the predicted harm from climate change, do not evoke calls for the type of disruptive economic efforts that are being suggested by the Biden administration and many others to reduce climate change. And remember, these numbers are not mine, but instead come from the National Climate Assessment. All I have done is to put them in perspective.
Conclusion
The Fourth National Climate Assessment is supposed to be a thorough examination of climate change impacts. If the authors have done their job and looked at the most consequential costs due to climate change, the current NA4 should provide their best expectation of the likely harm from climate change in the United States.
As such, the findings of the NA4 report are clear although unreported: The harms from climate change in 2090, assuming 70 additional years of the world belching out carbon emissionswithout any restraint (8.5), are fairly trivial. Even if the NA4 predicted damages were too low by a factor of 10, the expected harm would inflict only mild pain on the economy.
The logical conclusion to draw from the NA4 report is that the problems from climate change are smaller than many other quotidian problems such as deaths due to falling—and are much smaller than serious problems, such as cancer.
Therefore, it is illogical to provide massive resources and efforts to limit the damage from climate change. However, much of the news media have misrepresented the results found in the report, abetted by the NA4 lead authors failing to properly explain the climate change damages found in the Fourth National Climate Assessment.
The fact that the NA4 lead authors failed to be honest with their readers is inexcusable, and not what “scientists” should be doing. I presume that we can expect the same type of product from the next National Climate Assessment. The country and world deserve better.
[1] The Global Change Research Act of 1990 at http://www.gpo.gov/fdsys/pkg/STATUTE-104/pdf/STATUTE-104-Pg3096.pdf
[2] U.S. Global Change and Research Program, Fourth National Climate Assessment, Volume II: Impacts, Risks, and Adaptation in the United States, November 29, 2018, https://nca2018.globalchange.gov.
[3] The quotes from CNN, Gizmodo, Politico, and Wired come from a list of tweets collected by the Daily Kos: https://www.dailykos.com/stories/2018/11/24/1814915/-Reactions-to-the-US-Fourth-National-Climate-Assessment. The Atlantic quote comes from “A Grave Climate Warning, Buried on Black Friday,” Robinson Meyer, November 23, 2018, https://www.theatlantic.com/science/archive/2018/11/national-climate-assessment-black-friday/576589/. The CBS quote is found in “Mass deaths and mayhem: National Climate Assessment’s most shocking warnings,” Jason Silverstein, CBS News, November 24, 2018, https://www.cbsnews.com/news/national-climate-assessments-most-shocking-climate-change-warnings .
[4] Found at https://algore.com/news/statement-by-former-vice-president-al-gore-on-the-national-climate-assessment-released-friday-november-23.
[5] Page 1 of the NA4.
[6] RCP stands for Representative Concentration Pathway.
[7] Figure 1.1 in “Multi-Model Framework for Quantitative Sectoral Impacts Analysis, A Technical Report for the Fourth National Climate Assessment” May 2017
[8] Figure 29.2, found in two locations, pages 1349 and 1358.
[9] A footnote to this table claims that it is not a complete list of all climate-induced harms (and it does not look at all possible harms within a category). But if this analysis is to be of value, and if it is the “thorough” analysis it is claimed to be, this listing must contain what the analysts thought were the likely greatest harms from climate change. Thus, it seems reasonable to assume that it is at least a ballpark estimate.
[10] The NA4 projects that the real (inflation adjusted) GDP more than triples by 2090 and most of this is due to increases in per capita GDP since the population, estimated as the median U.N. population projection for the U.S., is expected to grow by less than 50 percent.
[11] This predicted future GDP value is found in NA4’s Technical Report, Figure 1.5.
[12] This point seems to have escaped almost all commentators except, to my knowledge, the Wall Street Journal’s Holman Jenkins. “Press Is the Enemy of Climate” Holman W. Jenkins, Jr., Wall Street Journal, December 4, 2018, https://www.wsj.com/articles/press-is-the-enemy-of-climate-1543966906.
[13] This quote can be found on page 26 of the NA4.
[14] Since total GDP is thought to grow from $20 trillion to $70 trillion, we assume that state shares remain constant and multiply the current state shares by the predicted 2090 GDP to derive the 2090 state GDPs.
[15] The citation is Solomon Hsiang, Robert Kopp, Amir Jina, James Rising, Michael Delgado, Shashank Mohan, D.J. Rasmussen, Robert Muir-Wood, Paul Wilson, Michael Oppenheimer, Kate Larsen, and Trevor Houser, “Estimating economic damage from climate change in the United States,” Science, Vol. 356, Issue 6345 (June 2017), pp. 1362-1369, https://science.sciencemag.org/content/356/6345/1362.
[16] NA4, page 1359.
[17] Author of the recent book “Unsettled” which looked critically at the more alarmist aspects of the climate change movement.
[18] Steven Koonin, “The Climate Won’t Crash the Economy,” Wall Street Journal, November 26, 2018, https://www.wsj.com/articles/the-climate-wont-crash-the-economy-1543276899?mod=article_inline. Although Koonin was arguing that the implications of Figure 29.3 were not very dire, based on his view of the amount of warming in 2090, although the Science study has much higher harms than found in the actual NA4 results.
[19] “US. Climate Report Warns of Damaged Environment and Shrinking Economy” Coral Davenport and Kendra Pierre-Louis, New York Times, November 23, 2018, https://www.nytimes.com/2018/11/23/climate/us-climate-report.html. “Mass deaths and mayhem: National Climate Assessment’s most shocking warnings,” Jason Silverstein, CBS News, November 24, 2018, https://www.cbsnews.com/news/national-climate-assessments-most-shocking-climate-change-warnings.
[20] Using the NA4 assumed growth rate of 2%.
[21] VSL is considerably larger than what a typical person would have earned in a lifetime and is generally thought to be about $7 million per life.
[22] This calculation takes the current number of deaths (found at https://www.worldlifeexpectancy.com/usa-cause-of-death-by-age-and-gender) and multiples those values by $7 million to arrive at the total current loss due to mortality. Those value are then divided by $20 trillion, which is an approximation to the current US GDP.
The government exaggerating risks? Who would have imagined!
Something is wrong with the numbers, given that they have stated a mitigation cost of 1% of GDP.
Just considering my tiny part of GDP. My Canadian gas heating bill is 40% higher alone due to federal carbon taxes that will go from $30 to $50/tonne in April. The amount is much more than 1% of my income, even including the “no net revenue” refund checks of a couple of hundred bucks they used to sell the plan…however someone else seems to be getting most of what I pay….and to date the only mitigation seems to involve payments for CO2 sequestration to oil companies that were using the CO2 for tertiary oil recovery anyway.
Crony capitalism anyone.
I think it is wonderful that in the EH, great white north, the leftist government it paying FF providers to “sequester” CO2 in the ground, and that CO2 is being used to produce more FF.
Why the same scheme can so easily get through the congress in the US.
NOT free enterprise, crony capitalism, like bank bailouts for billionaire Democrat donors and oligarchs. Oh, but I repeat myself.
The only oligarch billionaires the MSM questions are the Koch brothers, only one left I believe. But that is MSM Whack a Mole hit the one that does not conform, as in ALL the extremely rich and powerful are on the side of the Statist Democrats and their massive largess through crony capitalism.
I analyzed the first chapter of NCA3 (2014) in essay ‘’Credibility Conundrums’ in ebook Blowing Smoke. Every single example was grossly misleading. Designed to create alarm absent context, Essentially a pack of ‘official’ lies and misrepresentations.
So not surprised that NCA4 continued the practice.
The US needs a Sign Your Name bill, where each PARAGRAPH of every government report or regulation must have the name of the LOWEST level bureaucrat who was the primary author of that paragraph. Any document not providing such shall not be published or otherwise leaked to the public, and any higher level bureaucrat or, more importantly, political appointee who falsely claims authorship, or uses another’s name to cover their involvement, shall be guilty of Felony perjury, each offense REQUIRED to be prosecuted separately, with no allowance for prosecutorial discretion.
Any other bureaucrat or political appointee amending the paragraph must be named and the original language MUST be kept on record so as to be able to determine the named author’s original intent.
The report makes the assumption that increases in the amount Carbon Dioxide in the atmosphere will cause additional warming. This has never been proven outside of the laboratory or greenhouses. That it will cause global warming is just an unproven hypothesis.
What is a FACT, however, is that decreases in the amount of SO2 aerosols in the atmosphere will cause temperatures to rise (since they reflect quantities of the incoming solar radiation away, fewer aerosols will result in more warming) .
Current Net-Zero efforts to ban the burning of fossil fuels (which also produce SO2 aerosols) and continuing global “Clean Air”, efforts to reduce SO2 aerosol emissions, are reducing the amount of SO2 in the atmosphere, and temperatures are rising.
Rather than preventing additional warming, these actions will CAUSE additional warming.
See: “Net-Zero Catastrophe Beginning?”
https://doi.org/10.30574/wjarr.2022.16.1.1035
:
You might wish to consider natural emissions of sulfur compounds besides volcanic emissions. The most dominant is carbonyl sulfide from plankton with annual emissions in the tens of Gg/y range. It’s photolyzed to sulfate aerosols in the stratosphere.
Scissor:
In addition to volcanic eruptions, I have identified 3 other causes of decreased SO2 aerosol emissions that result in temperature increases: Idled factories during American business recessions (34 since 1850), periods of 3-4 years or more between volcanic eruptions, and a couple of large “Clean Air” decreases in SO2 aerosol emissions.
The natural emissions would be expected to cause some cooling, but it appears to be only a very small amount.
With all due regard, we know without any doubt that CO2 has absorption lines throughout the thermal spectrum, and as a result it must contribute to some warming. This is even measured by sensors on satellites, aircraft and balloons and any reasonable mechanical engineer knows it has a profound effect in boilers and furnaces; so it is beyond the laboratory. Now, if you were to say its ultimate effect might not be to warm as much as alarmists claim I would probably agree with you, but to say it has no proven effect is simply not so.
Comment say:”… any reasonable mechanical engineer knows it has a profound effect in boilers and furnaces;…”
True, but our atmosphere is not at the temperature nor pressure that boilers are at. Hottel and others have shown that the emissivity of CO2 is almost zero where we live.
SO2 is not an aerosol, it is a gas.
SO2 is inevitably oxidized to SO3 then forms sulfate aerosols via coalescing reactions.
Prof. Liebowitz is or was Co-Director of the Center for the Analysis of Property Rights and Innovation (CAPRI). But the CAPRI web site seems to be gone. Is CAPRI defunct?
This is the last version of the CAPRI web site that I found in The Wayback Machine:
https://web.archive.org/web/20220307045459/https://jindal.utdallas.edu/centers-of-excellence/capri/
Here’s an earlier version:
https://web.archive.org/web/20160119225016/http://jindal.utdallas.edu/centers-of-excellence/capri
Here’s an even earlier version:
https://web.archive.org/web/20060830102130/http://som.utdallas.edu/capri/
This is really important and needs to get out to the public. This needs to be reported ad nauseam and the authors of NA4 made to account for their sloth. My hat is off to Stan Liebowitz.
A question. Are the costs NA4 list total costs or costs in addition to what we are already paying, always have payed and always will pay?
What leave out is that the US spends $1.8 TRILLION on new construction every year https://www.statista.com/topics/974/construction/#topicOverview so any “adaptation” expenditures would be subsumed (and disappear as a tiny blip) into that figure.
I like many here spend all this time trying to be informed citizens and voters on this and all kinds of other complex subjects and it really is becoming pointless. Am I the only one feeling this way? It is like we are whistling past the grave yard hoping that some how integrity will miraculously return to our political system and society in general.
There is one area where the evidence is absolutely clear: our political system is corrupt and absolutely broken. I’m not going to go into a rant on the weaponization of the judicial system that is taking place- but that is just one of many serious issues along with nut zero time lines – that we’ll for lack of a better term ,could cause people to just “snap” and the system to break maybe sooner than later.
And the author is wondering why it wasn’t published?
Is he unaware of the thought police of narrative control?
I thought RCP was the measure of sensitivity to CO2 increase, not the increase itself. And far from RCP4.5 being likely, current observations give a figure of RCP1.5.
“RCP1.5” doesn’t exist.
The CMIP5 round had a “most optimistic” pathway of RCP2.6.
CMIP6 including SSP1-2.6 as an update to RCP2.6, and extended the range with SSP1-1.9.
– – – – –
“Cuurent observations” of (fossil-fuel and industry) CO2 emissions are shown in the attached graph, along with the various “projections” from CMIP5 / AR5 (2013) and CMIP6 / AR6 (2021).
Note that the IPCC now classifies SSP3-7.0 and SSP5.85 as “counterfactual”, while SSP2-4.5 (and RCP4.5) are now the “assuming no additional climate policies” option, i.e. the new “worst case / business as usual” scenario”.
See AR6, WG-I report, section 1.6.1.4, “The likelihood of reference scenarios, scenario uncertainty and storylines“, page 239.
[ Multiple expletives deleted ] … Hit the wrong button !
Graph attached here.
Are the RCP numbers reversed here (or maybe the dates reversed or wrong)? Isn’t RCP 8.5 assumed by the NCA team to represent more harm than RCP 4.5 and thus delay the GDP growth longer?
Ric
The US has a built in global warming experiment which never seems to be consulted. The average temperature of Maine, for example is about 54F while that of Florida is 72F, a full 18F higher. So where are the deaths and destruction resulting from 18F of consistent warming found in Florida vs Maine? Surly either Maine is dead from all the cold or is it Florida from all the heat?
It can’t be shown that the slight warming we’ve experienced since the LIA has caused any economic harm whatsoever. In fact, it is far more likely that warming has, and will continue to have overall economic benefits. The entire premise of these “climate assessments” is false. Furthermore, we don’t know if warming will continue, or if instead we get cooling. And cooling would be far more likely to cause economic harm.
Article says:”…approximately $70 trillion GDP…”
Biden and friends are trying hard to ensure the above estimate is much lower so the percentage of damage is , say all together now, “much worse than we thought”.
Another great article with sensible advice and perspectives.
The damage from Net Zero policy will cause considerably more damage than these projected estimates by weakening our electrical grid, impairing access to synthetic fertilizer, and insisting on eliminating everyone’s access to the internal combustion engine in about a decade. Those follow on costs would cause considerably more damage to our economy than the global warming costs that might occur if we followed an adaptation approach. Perhaps they should add such an annex to their report?
Their report is an imaginary apocalypse predicated on a fiction supported by mythological numbers conjured from thin air by hallucinatory doomsayers deep in thrall to a collective nightmare of their own making. If anyone involved in this project were even slightly impartial or rational they would wonder why the enormous, tangible benefits of a warmer planet are not included in the calculations; why another degree or two of warming is somehow bad while the past several degrees of warming were good. The extraordinary effort wasted to produce this bovine effluent cannot be mocked enough. Brought to you by the same people who dreamed up Cash for Clunkers. Not our best and brightest.
When you total up the plusses and minuses of climate change, you end up with net zero.
The population problem and global warming will easily be fixed by Ted Turner and his UN Foundation … https://twitter.com/_ClimateCraze/status/1638146322669731840