Jennifer Marohasy
It is repeated, non-stop: glaciers and ice sheets are melting, and so the sea levels are rising. We are all doomed. We will all be drowned, said Hanrahan.
So, each year on the highest tide I go see how much the ocean has risen.

Each year I go to that rock platform with the wave cut notch expecting to be drowned.

Alas, at the moment of the highest astronomical tide for 2023 – officially 8.32 am on Sunday 22nd January – the waves didn’t reach to the wave cut notch; not anywhere near it.
That notch, it must be a relic from a time of higher sea levels.

It was so much fun! This morning. Being out on the rock platform under Boiling Pot Lookout in Noosa National Park.


Fun, because I was with some friends, the sun was shining, and my drone took off. And, of course because it was the morning of the highest astronomical tide. And we didn’t get washed away.
Thanks, Jennifer, for the post, and thanks, CTM, for cross posting it here at WUWT.
Regards,
Bob
A verse for those studying sea levels:
Rock of Ages, cleft for me,
let me hide myself in thee;
let the water and the blood,
from thy wounded side which flowed,
be of sin the double cure;
save from wrath and make me pure.
Amen !
Love this! Direct and un-fudgeable observation of reality. AlGore:The Goreacle and Lurch Kerry are going to be quite cross with you, ma’am. I am surprised youbloob did not put a “misinformation” label on this video.
Very nice.
But… we’ve all been rooned, said Reuters, and the AP, and the BBC, and CNN, and the NYT, and WaPo, and the climate models based on Science. Obviously, this is evidence of catastrophic damage to the molecular properties of water itself, brought about by oil companies and their nefarious plans.
As I recall one of the early “Climate Skeptics”, John Daly, found some notch cut in the rocks by an English explorer (Captain Cook?) which indicated there had been no noticeable sea-level rise since Australian was first investigated by Europeans.
When John passed away in 2004, the Climate-gate Emails reveal some loathsome rejoicing occurred among the so-called scientists perpetuating this scam.
It is hard to get John’s old posts through the security of modern computers, but here is a post discussing the sea-level changes (or lack of them) from twenty years ago:
https://john-daly.com/deadisle/hobart-msl.htm
Yes. This is an picture by Daly
Who say
‘However, the man responsible for putting the mark there, explorer Sir James Clark Ross stated explicitly and several times in his 1846 book [3] that the mark was placed at MSL …
but we do have one positive measurement of where the benchmark stood relative to sea level taken in 1888 by the then Government meteorologist, Commander J. Shortt R.N. He found the mark to be 34cm above sea level – only 2½ cm different to its current position [7] [5].
This suggests a sea level rise since 1888 of only 2½cm, not 13cm as claimed by the study”
www*john-daly.com/deadisle/ as theres no https
Lets organise to go and revisit that spot! Jen
It would be nice to get an update as it has been about 20 years since John covered it:
Part 1
c,mon, man… What does a golfer know about Climate Skepticism?
Considering the researchers working on the story of pacific atolls find the same thing. Of those they study some are getting smaller , most are getting bigger.
The media concentrate on a few that have become heavily overpopulated and have land area loss near the populated area but maybe not on the far corners of what is a large ring shaped ‘sand bar’
https://www.auckland.ac.nz/en/news/2020/11/30/low-lying-pacific-island-has-more-land-above-sea-level-than-in-1.html
‘
“In this work and in previous studies, we have found islands are resilient in the face of rising seas and that sediment supply to some atolls is out-pacing sea level rise…’
For that notch to have been cut into the cliff thare can be several explanations principally
The mean sea level was at that height for long enough for waves to cut the notch
The sea level was high enough for high or low tides to cut the notch
There has been a rise in the land mass in that area.
Taking the first two you can say a higher sealevel for longer than we’ve had the current level.
The other point is that there is no normal sealevel over geological time, it goes upand down like the proverbial by a couple of hundred metres. The only problem is inconvenience to life forms including humans who have to follow these changes if they want to live by the sea.
The sooner people realise there are lots of areas where land based life used to live now given over to aquatic life formsthe better
You are not allowed to mention that it has ever been warmer than today.
Even this recent detailed analysis of a pre historic flower preserved in amber from the Baltic region
‘This fossil represents the first record of Symplocaceae from Baltic amber and supports affinities of its flora to evergreen broadleaved and mixed mesophytic forests of present-day East and Southeast Asia.’
Current these types of forest only grow in warmer SE Asia, but evidence shows they existed in the baltic region over 35 Ma yrs ago
https://www.nature.com/articles/s41598-022-24549-z
And where was the Baltic during the Eocene ?

Wherever it was I bet it was cold!
So, the post 1980 Brisbane data is FOS? It shows a current rise rate of ~8 mm*year^-1, but an acceleration in that rate of ~0.1 mm*year^-2. If that were extended to 2100, that sea level would rise by ~1.22m*.
I’m not dissing your 1/year family outing measurement. I would just like to see the actual numbers, and to hear more on why it is better than that of:
https://tidesandcurrents.noaa.gov/sltrends/sltrends_station.shtml?id=680-078
Am I using the wrong station? Is it anomalous to other nearby stations? Subsidence?
> It shows a current rise rate of ~8 mm*year^-1
Please define “current”. Over what period are you calculating that “current rise rate”? I don’t see anything like 8mm per year anywhere in that data. In fact the most recent four years of data on that page(Jan 2015 to Dec 2018) shows a negligible 0.96 mm per year and the most recent three years shows a NEGATIVE 8.4 mm per year.
Per my comment, current. Now, actually yesterday. It is a matter of:
Calcuting the acceleration of sea level rise, from the quadratic evaluation of the data.Calculating the changing “instant” rise rate, from the 2ax +b relationship.Finding that rise rate for yesterday.
Oh, BTW, I have not done this for awhile and made the rookie mistake of posting the acceleration of sea level rise as half of actual. It should have been ~0.2 mm* year^-2. Strange that no one here caught that…
How can you derive a “current, actually yesterday” rate from data which ends in 2018? :
As for the “rise rate for yesterday” The last two data points are:
2018,11,7.295
2018,12,7.286
That’s a decrease of 9mm in one month or a rate of NEGATIVE 108mm per year.
Sorry StuM, not how these evaluations are performed. We use ALL of the relevant data. You can see ups and downs all of the time. I’m sure that you wouldn’t like it if I cherrypicked a big “up”.
The chart states that the rate from 1966 to 2018 is 1.21 mm/year with a 50% error bar.
Where did you get 8 mm/year post 1980? (304 mm over 38 years) That is certainly NOT fit to the graph you linked.
Did you you pick the anomalous low of 7.06 meters around 1986? If we add .304 meters to that, then the chart should end at 7.364 meters. It definitely does not.
If you cherry pick the lowest point and the highest point, then you might get your rate, but it is hard to support an accelerating rate when sea level has DECLINED from the high.
I agree that that is what the chart says. I evaluated from 1980 on because that is the best period for physically and statistically significant evaluation. The mid century aerosol era was waning and the cumulative effect of modern AGW forcings were becoming more apparent. FYI, over 3/4 of the worlds stations with post 1980 data show such acceleration.
Yes, I did not cherry pick data. I used it all.
then you stuffed up completely .. as is your MO !
For you, apparently “evaluated” is synonymous with “made it up out of whole cloth.” The long-term trend is 1.21 mm/yr, right there on the chart. If you were so foolish as to take the last 2 months, it’s declining at 9 mm/yr. Data and methodology, or it’s just made up.
I didn’t dispute the irrelevant long term trend. I merely used the longest physically/statistically significant trend that would best reflect the influence of modern, cumulative forcings.
But here’s the comparable extended rise to 2100, and the 1/2023 instant rise rate using all of the data, and the inconvenient acceleration component..
2100 sea level rise – ~1.54 m
1/2023 rise rate – ~9.5mm*year^-1
Acceleration – ~0.27mm*year^-2
Compare to my earlier values. Keep diggin’?…
Extrapolation from nonsensical calculations
“I didn’t dispute the irrelevant long term trend. I merely used the longest physically/statistically significant trend that would best reflect the influence of modern, cumulative forcings”
You cherry picked. You have a significant negative trend for the first decade, which doesn’t reflect the propaganda, that gives you your acceleration that you use to support your propaganda. Not remotely sciencey.
Good try. Especially for someone who doesn’t actually do the evaluations themselves. Unfortunately for us all, post 1990 evaluation actually gives us a higher acceleration of ~0.24MM*year^-2, and a higher 1/2023 “instant” rise rate of ~9 mm*year^-1. But a bone throw. Extended additional rise from 1/2023 to 2100 is now “only” ~1.4m.
If you want to avoid future correction, just aks me how to do the actual work, including the inclusion of 2 sigma error curves. It’s easy…
You have nothing to teach anyone but a used car salesman.
I’m on a smart phone and have no desire to waste time going to a computer to fit a function to the data when it’s blinding obvious that there is no significant acceleration, and what there is would be negative after 1995.
I also have no desire to figure out how you botched the calculations. I’ll just assume that your brain is drowning in hubris.
“I’m on a smart phone and have no desire to waste time going to a computer to fit a function to the data when it’s blinding obvious that there is no significant acceleration.”
WUWT hysterical blindness at work. But pictures are always better, and for some are necessary.
Maybe avoid commenting on what I didn’t say. Specifically, I didn’t predict that this trend would continue.Well, actually you did. In fact you said:
If that were extended to 2100, that sea level would rise by ~1.22m*.
So you posted the exact alarmist impression that you wanted to give, and then tried to wiggle out of it by posting the *comment. Do you think we are stupid?
So in fact you are admitting with the cover your @ss comment that you can NOT use acceleration measured over a short period of time to extrapolate long term. Here’s my version of that:
You are a disengenuous creep.*
*I would never call anyone disengenuous and a creep.
I extended the trend, hypothetically. But yes, since it was an extremely well established trend, it is up to others to either:
Guilty as charged.
Click my name to find out how often I have used juvenile epiphets in the past, karlomonte/davidhoffer style. And not only that, but then immediately deny it. Typical WUWT repartee…
Oh, then you can answer my expiicit and implicit questions….
You claim you used the 1980 on years for evaluation because that is the best period. Who said? What makes that the best? Why didn’t the agency doing the graphing use that period when they said 1.21 was the trend?
You are just making things up.
“Why didn’t the agency doing the graphing use that period when they said 1.21 was the trend?”
Probably because they wanted comparable data sets for different stations. It is the single easiest trend to draw. No allowance for lost data. No consideration of AGW. OTOH, my reasons are strong enough that you have no technical rebut for them.
Why give allowance for AGW when there is no such thing? I haven’t yet read your criteria. That line about physically significant is again based on something you are claiming only.
Here is the NOAA comparison of tidal gauges along the east coast of Australia.
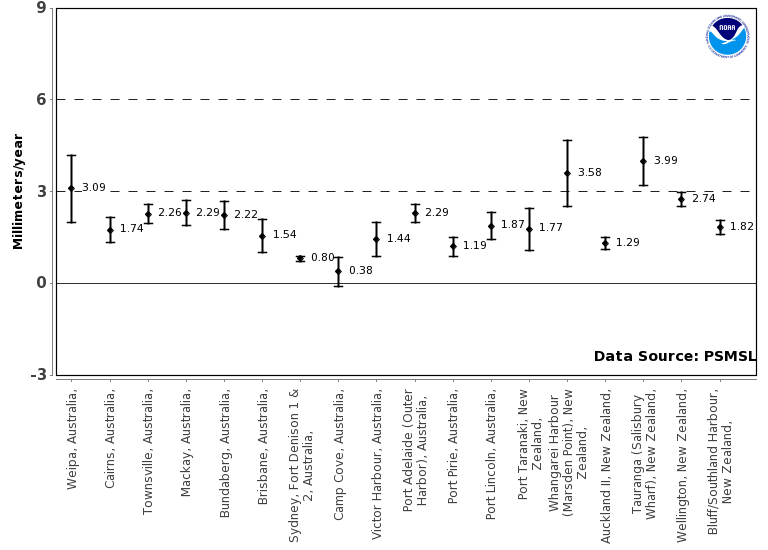
Noosa is just to the north of Brisbane, a bit to the south of Bundaberg. Last time I looked the Sonel.org showed land subsidence for Brisbane at minus 1.8 mm/year and for Bundaberg minus 0.8 mm/year. :-).
Thanks. I’ll check these out individually, using post 1980 data. But remember, most of these stations show much more post 1980 acceleration and SLR than when using older data with less cumulative AGW forcing.
I’ll get back to you…
Read another Grimm Bros book first.
See if you can imagine another fairy-tale. !
Woollangabba shows a subsidence, “Velocity (mm/yr):-2.02 +/- 0.41”
https://www.sonel.org/spip.php?page=gps&idStation=3217. PMSL for Brisbane (West Inner Bar) provides no vertical component.
Subtract that 2.02 from the measures 3.3mm/year
You get a SLR of around 1mm/year.. same as Sydney’s Fort Denison.
Seems that big oily blob is LYING, as usual. !
?
The ‘Gabba is nowhere near a seashore.
Follow the link.
Yeah I did that, but I still don’t get the relevance of The Gabba to sea level rise.
Cleveland is logical, it’s foreshore to Moreton Bay.
But Woolloongabba? (14 miles up Brisbane River from its mouth into Moreton Bay).
You may as well use Warwick (160k inland from Brisbane).
Does it need to be closer to the foreshore when using it for a guesstimate 150 km away?
It suggests that the there is subsidence overall in that part of Australia but, obviously, not proof of subsidence at Noosa, and neither would another coastal measurement 100 km away be.
8mm/year…. ROFLMAO !!
Your lies continue.
Here is the data from Sydney showing basically 1mm/year on average, with the high tide rising at around 0.75mm/year.
And data from BoM for Brisbane Bar (which is sinking a bit)
Shows a SLR of 3.3mm/year…
And no, there is no measurable acceleration.
the oily blob is fantasizing, yet again.
Anyone who’s lived by an ocean for a period of time will tell you they cannot perceive any rise. They still can stand on the same rocks at high and low tides and not get wet. For myself and the Pacific Ocean it has been 77 years.
“Anyone who’s lived by an ocean for a period of time will tell you they cannot perceive any rise.”
That is very true which is why we have very clever satellites that do it for us and they tell us the sea is rising.
Who are you going to believe? The satellites or your own eyes?
I’ll believe the satellites over some person who thinks they can detect sea level rise by standing on a rock. Call me crazy.
Waves, tides, air pressure, major ocean currents, even la Nina/el nino phases can have much higher surface levels than some altimetry measurements taken every 10 days.
Even NASA says it’s a sythenised result combing results from other sources as well as satellites.
A bit like Mann’s hockey stick
“Waves, tides, air pressure, major ocean currents, even la Nina/el nino phases can have much higher surface levels than some altimetry measurements taken every 10 days.”
Very true which makes it so silly to write an article like this and expect it to mean anything at all.
Measure sea level at tide gauges shows SLR is generally less than 2mm/year
Live real-life data… accept reality for a change. !
Funny how skeptics love the satellites when they measure temperature not so much when they measure sea level rise…
Again Slimon shows his abject ignorance in how satellite SL measurements work.
Thinks the oceans are a flat non-moving surface
OMG, them/they is a complete scientific ignoramous.!!
Funny how Simon thinks that radar altimetry with a resolution of 3 cm can detect a change of 3 mm.
We know you are crazy, and have absolutely zero comprehension of how badly satellites measure sea level.
REALITY is something you never will be able to allow yourself to accept..
You cannot allow yourself to accept that you have been CONNED !!
Tides get no higher now than they did 20 years ago…
…. and somehow you still “believe” it is rising.
You really have lost the plot !
Buried in a stinking mire of your own idiocy !
“Tides get no higher now than they did 20 years ago…
…. and somehow you still “believe” it is rising.”
Hold on didn’t you just say real world observations say rising by 2mm a year?
“Measure sea level at tide gauges shows SLR is generally less than 2mm/year”
So you believe it is rising too, but you say I’m crazy for believing it is rising? Ok this is getting silly.
Are you FOOL enough to think a natural rise of 2mm/ year is noticeable. Yes you are !
Does a SLR rise of 2mm/year SCARE you into abject PANIC. !
Obviously it does.
You really are a pathetic chicken little, aren’t you.
A pathetic chicken little (although not really a good choice as CL thought the sky was falling not the sea rising) I might be but I am in good company…. this is what Noaa think.
“In urban settings, rising seas threaten infrastructure necessary for local jobs and regional industries. Roads, bridges, subways, water supplies, oil and gas wells, power plants, sewage treatment plants, landfills—virtually all human infrastructure—is at risk from sea level rise.”
Cluck, cluck!
You mean the satellites that have error bars of 33mm? Those satellites?
Mmmmm got a reference for that?
“The primary instrument on Jason-3 is a radar altimeter. The altimeter measures sea-level variations over the global ocean with very high accuracy (1.3 inches or 3.3 centimeters, with a goal of achieving 1 inch or 2.5 centimeters).”
https://sealevel.jpl.nasa.gov/missions/jason-3/summary/
You’re welcome. 😉
“GRACE-1 led GRACE-2, with the onboard cold-gas propulsion system used to separate the two satellites at a distance of 170 km to 270 km. The GRACE system accuracy was sufficient to determine a change in mass equivalent to a volume of water with a depth of 0.01 m over a radius of about 400 km. GRACE had a 30 days repeat cycle to determine the new gravity field each month.”
You are most welcome….
Oh so, you have a changing gravity filed, and you still think you can measure the mass of moving water over magma sacs etc
And it says absolutely nothing about measuring sea level change with any accuracy
Try not to continue to be a complete failure.
The GRACE system accuracy was sufficient to determine a change in mass equivalent to a volume of water with a depth of 0.01 m over a radius of about 400 km.
0.01 m equals 10mm. How do you measure sea level to sub-millimeter precision with an instrument with a resolution of more than 10 times worse than that?
Surely that’s just giving an idea of the mass, not water depth. It’s an alternative to Olympic swimming pools, London buses or African elephants
Pi time 400,000 metres squared times 0.01 metres is 5 billion cubic metres.
If I didn’t muck up the calculation, that’s 5 billion tonnes, at 1 tonne per cubic metre.
That’s 2 million Olympic swimming pools at 2,500 cubic metres, or 770 million African elephants at 6.5 tonnes.
London buses are left as an exercise for the reader.
So Grace is 3 times less accurate than the altimeter. Good to know.
NASA states 33 mm is for a pulse of 1000 measurements. The real error bar is 1.2 meters!
Just like there is no “the temperature”, there is also no “the sea”. This averaging nonsense needs to stop.
Leaving beach front property owners like Al Gore out of the eaquation why are rising sea levels a problem?
Where is Gore’s beach front property?
I once found he bought a place for his “ex” with an ocean view.
Key words are “beach front” and “ocean view”.
“Leaving beach front property owners like Al Gore out of the eaquation why are rising sea levels a problem?”
Oh I dunno…
Maybe this”According to a report from the National Ocean Economics Program, 42 percent of the U.S. population lived in coastal shoreline counties in 2013. That’s more than 133 million people. Those same counties produce $8 trillion worth of goods and services per year, which is about 48 percent of the U.S. gross domestic product. As sea levels rise, coastal communities can expect more frequent and more severe flooding from high tides and storm surges.”
As more people flock to the coast expect compaction to some degree. 😉
“For myself and the Pacific Ocean it has been 77 years.” Yes, me too, and 77 years ago the Pacific, on the king tides, used to cover our lawn by an inch and trickle into the well if we didn’t keep a levy around it.
At this current highest astronomical tide, sea levels were lower by about an inch than those of 1946 to 1953.
Some of the later HATs during the 77 years have been up to a foot lower than the earlier ones but when corrected for BP and sea surge, none have never been higher.
Recent information has also shown that this area is sinking at the rate of a couple of millimetres a year which means that local sea levels are probably falling even more.
If this is the story with the world’s biggest ocean then SLR awa Global Warming are a non-event.
Simon will inform you that satellite measurements of SLR trump your observations.
As soon as you throw the word/name trump in there you know there is a lie hiding somewhere.
Simon is too thin-skinned to be an effective troll.
Is what I posted false?
Oh dear.. another I looked out the window and the water was not rising comment.
This is what Noaa has to say and I trust them a whole lot more than some randoms telling me their toes arn’t wet this year….
“Sea level is primarily measured using tide stations and satellite laser altimeters. Tide stations around the globe tell us what is happening at a local level—the height of the water as measured along the coast relative to a specific point on land. Satellite measurements provide us with the average height of the entire ocean. Taken together, these tools tell us how our ocean sea levels are changing over time.”
“Sea level rise at specific locations may be more or less than the global average due to local factors such as land subsidence from natural processes and withdrawal of groundwater and fossil fuels, changes in regional ocean currents, and whether the land is still rebounding from the compressive weight of Ice Age glaciers.”
Maybe stick to real science not voodoo stuff.
You need to get with the facts, not your voodoo religion.
When taking into account only the short history of GPS chips on tide gauges the average absolute rate of rise is +0.125 mm/yr for the biggest ocean area in the world:
https://www.degruyter.com/document/doi/10.1515/nleng-2020-0007/html
In another decade that one eighth of a mm/y will go negative.
Classic. Did you even read the headline? Can I suggest you do and when you have get back to me.
Here I’ll hold your hand. It says “in Oceania…”
Which covers the western Pacific
Oh dear….Oceania is not the planet. And if you knew anything about sea level rise you would know it is not uniform.
Here’s the thing Mr Cocky…Sea level rise is complex. Which is why you find some of the smartest people on the planet researching this stuff. It may surprise you but they don’t just dip their toe in the water. It’s why I laugh when I see articles like this that think you can make an assumption by looking at a rock in the sea at a specific place. Just silly.
You have to start somewhere. Having the technology to accurately determine elevation changes of tide gauges is a start, and the Oceania analysis builds on that.
Western Pacific sea levels are influenced by ENSO, as is the eastern Pacific in the opposite direction. The corresponding analysis for western South America for the same period then gives a reasonable idea of the entire south Pacific.
btw, you are assuming that my pronouns are he/him 🙂
“Oh dear….Oceania is not the planet.”
Oh dear….some people just don’t get it, do they.
Oceania covers a huge amount of ocean and if it averages almost no SLR, maybe you should pay attention to what it’s trying to tell you.
“And if you knew anything about sea level rise you would know it is not uniform.”
Is that riiiight?
Do you know why that is, at all?
Vertical land movement, d’ya think?
That’s precisely what this paper is all about.
And it tells us that when that is taken into account there is virtually nothing happening with SLR.
Got it now?
A bit early for 22nd February, 2023, isn’t it …? (and that’s a Wednesday and not a Sunday …)
Working alone. Tired last night. Yes. It should be ‘January’ not February where I placed the text in the drone photograph! My bad.
Easy done, unfortunally. Please fix it before some scam artist notice it …
Related, I have somewhere a photo from Rodós, Greece (known as Rhodes, incorrectly transcribed – I use it to avoid confusion with Rhode Island …), taken just a few years ago, showing old coastal cavitation at the Mediterranean Sea. It reaches over one meter above present sea level. No land rise in the region, for a very long time.
Charles can substitute this image, with February overwritten with January, when he has time. Cheers,
We had tropical Cyclone Hale hit the East coast of the North Island recently and the Mercury Bay Yacht Club House was undermined because it was built on sand .
The building had to be moved temporarily and the news media were all over the story blaming it on climate change .
Had they never heard the parable from the bible about the man who built his house on sand and the one who built his house on rock.
Over 2000 years ago they knew that sand could get washed away in storms .
The average sea rise around the New Zealand coast is under 1.5 millimeters per year and there is no sign of acceleration .
That is not even a six inch rise in 100 years.
Of course there is coastal erosion when storms occur during high tides but a 10 meter high sand dune can soon wash away as the bottom is eroded.
That is nature .
Did you watch that Attenborough programme on TVNZ1 last night? That was the one where the walruses fell down a cliff when surprised by his photography crew – but no mention of his subsequent admission and apology. Full of the usual nonsense, none of which could be substantiated!
Wouldn’t the wave notch be the bad storm reach point? Bad storm at highest tides?
Most geological water deposits are catastrophic or near catastrophic events. Takes the deposits out of ordinary processes. I watched a 3 day storm in 2013 Calgary transform the Bow River gravel bars from a 50+ years status quo. Add 4m to the riverbed below Elbow Falls and remove 100m of 100+ years old forest over several square kilometers.
Transgressive or regressive shorelines. None of them show any change not easily attributable to rising/falling land masses or changes in up stream sediment flow and load. Just as Pacific islands are expanding, due to local desire for more land area, faster than sea level rise can shrink them. Same for New York and San Francisco harbors.
Oh, well.
This post doesn’t present a valid objection but fun and will drive the alarmists crazy because they don’t understand geological processes any better than Al Gore understands climate science.
You would expect that high tide, twice per day, would cut into the rock face a lot more than a storm at maybe once per month.
The ocean has not cut into the cliff face in a significant number of years. This is suggestive of the sea level being lower now than in the past. How far back….. I don’t know, but if you dug at the cliff, took samples, looked for key indicators at the erosion face, then you could probably work it out.
However, the whole point of this visit at the highest astronomical tide is NOT to necessarily tell exactly when it happened but instead to educate the masses that the sea level has been higher before and has changed without the interaction of any man made event. I think the visit has shown that quite well.
It would be good to make such a pilgrimage a much larger newsworthy event with picnics, musical performances, barbecues … a big tourist attraction –
Yes. Let’s do that. Let’s build my annual pilgrim into something more substantial. Can you play the guitar? 🙂
Yes I can, but I’m 10,000 miles away. But here’s far a superior guitarist I admire in your own country.
https://www.musicradar.com/news/tommy-emmanuel-guitar-heroes
And Tommy Emmanuel has a song ‘Fear of Rain’, and how good is this: https://www.youtube.com/watch?v=gQOA01LkFtQ
Forget tide gauges or satellite altimetry.
Global sea levels are best assessed by packing the family into the car and heading to the nearest beach to eyeball it for ourselves.
Think of the money that can now be saved.
Exactly what I have been thinking. :-). Though they are not mutually exclusive, either. ;-).
Jennifer, I think that comment was TFN’s attempt at /sarc.
Have a look at this paper (2020):
Relative sea-level rise and land subsidence in Oceania from tide gauges and satellite GPShttps://www.degruyter.com/document/doi/10.1515/nleng-2020-0007/html
It is based on the absolute SLR records (GPS corrected) of 5 tide-gauges in the Pacific: Oceania, Fremantle, and Sydney in Australia, Auckland, and Dunedin in New Zealand, and Honolulu in the Hawaii Islands, United States of America.
“All the LTT tide gauges of the Pacific consistently show a small sea-level rise, with a significant contribution by subsidence, and NEGLIGIBLE ACCELERATION. This result is well-matched by the land increase, rather than shrinking, of the Pacific atolls’ islands recently highlighted by other researchers.
See also: https://wires.onlinelibrary.wiley.com/doi/abs/10.1002/wcc.557
The so called worrying “acceleration” in the recent SLR satellite records observed by the IPCC is a complete farce !
Very interesting Jack. I was hoping someone would do a detailed audit of all the tide gauges compared with their vertical movements.
They say that the average absolute rate of rise is +0.125 mm/yr after making allowances for the GPS recorded sinking.
When they eventually get a bit more history on the sinking of those gauges, that one eighth of a mm/y SLR may not survive either.
IOW, nothing happening wrt SLR, as the late Nils Axel Morner always said.
That notch, it must be a relic from a time of higher sea levels.
yes there is evidence of past higher sea level, which PROVES the future can never have higher levels
An that the sea level is far lower than it has been.
No evidence of any human influence.
Inane comment, even by Mosher’s standards.
never said anything about the future. just that for the moment it hasn’t got any where nearly as high as the past. :-).
Nothing on the whole spectrum of the “climate crisis” hasn’t happened in the past.
And all the elements could possibly happen again in the future.
But that will again be Nature’s Ways, nothing peoplekind (h/t Justine) can do about it, except ADAPT.
Though, I generally agree with the conclusion, I don’t think that the cliff at that spot is necessarily a good argument that sea level is not rising.
One factor is the rocks themselves. If there is looser “mortar” rock separating layers, or perhaps a crack running vertically in that area, rocks could fall of their own accord, without the sea level being an important factor. Or perhaps it involves some combination of geology, storm surge and actual sea level.
An 85 y/o neighbour was parroting what the media said about sea level rise. I pointed to the bay in front of our house and asked how it was different when she came to the island as a 19 y/o bride. She said “Oh!, its no different!”. She is now a skeptic.
way to go. :-).
The photo is dated wrong………..
Yes. I mistakenly wrote ‘February’, fixed in this image that I’m hoping Charles can substitute. :-).