Guest Post by Willis Eschenbach
Christopher Monckton recently put up a fascinating post entitled “The Final Nail in The Coffin Of “Renewable” Energy”. In it, he references the work of a man named Douglas Pollock who has proposed that there is a limit to the share of energy that a given renewable source can supply to the grid without battery backup. Further, Pollock says that the limit is the “capacity factor”, the fraction of the nameplate capacity that a renewable source can actually supply.
A rebuttal of this was put up as a post entitled “Sealing The Coffin Of “Renewable” Energy May Take A Few More Nails“, and Lord Monckton posted up a re-rebuttal entitled “Why Climate Skepticism Has Not Yet Succeeded“.
(Unfortunately, in the comments of the latter post I fear I waxed wroth when Christopher falsely accused me of being “openly and deliberately dishonest” … ah, well, I know that science is a blood sport, but I won’t take that from any man. However, I digress …)
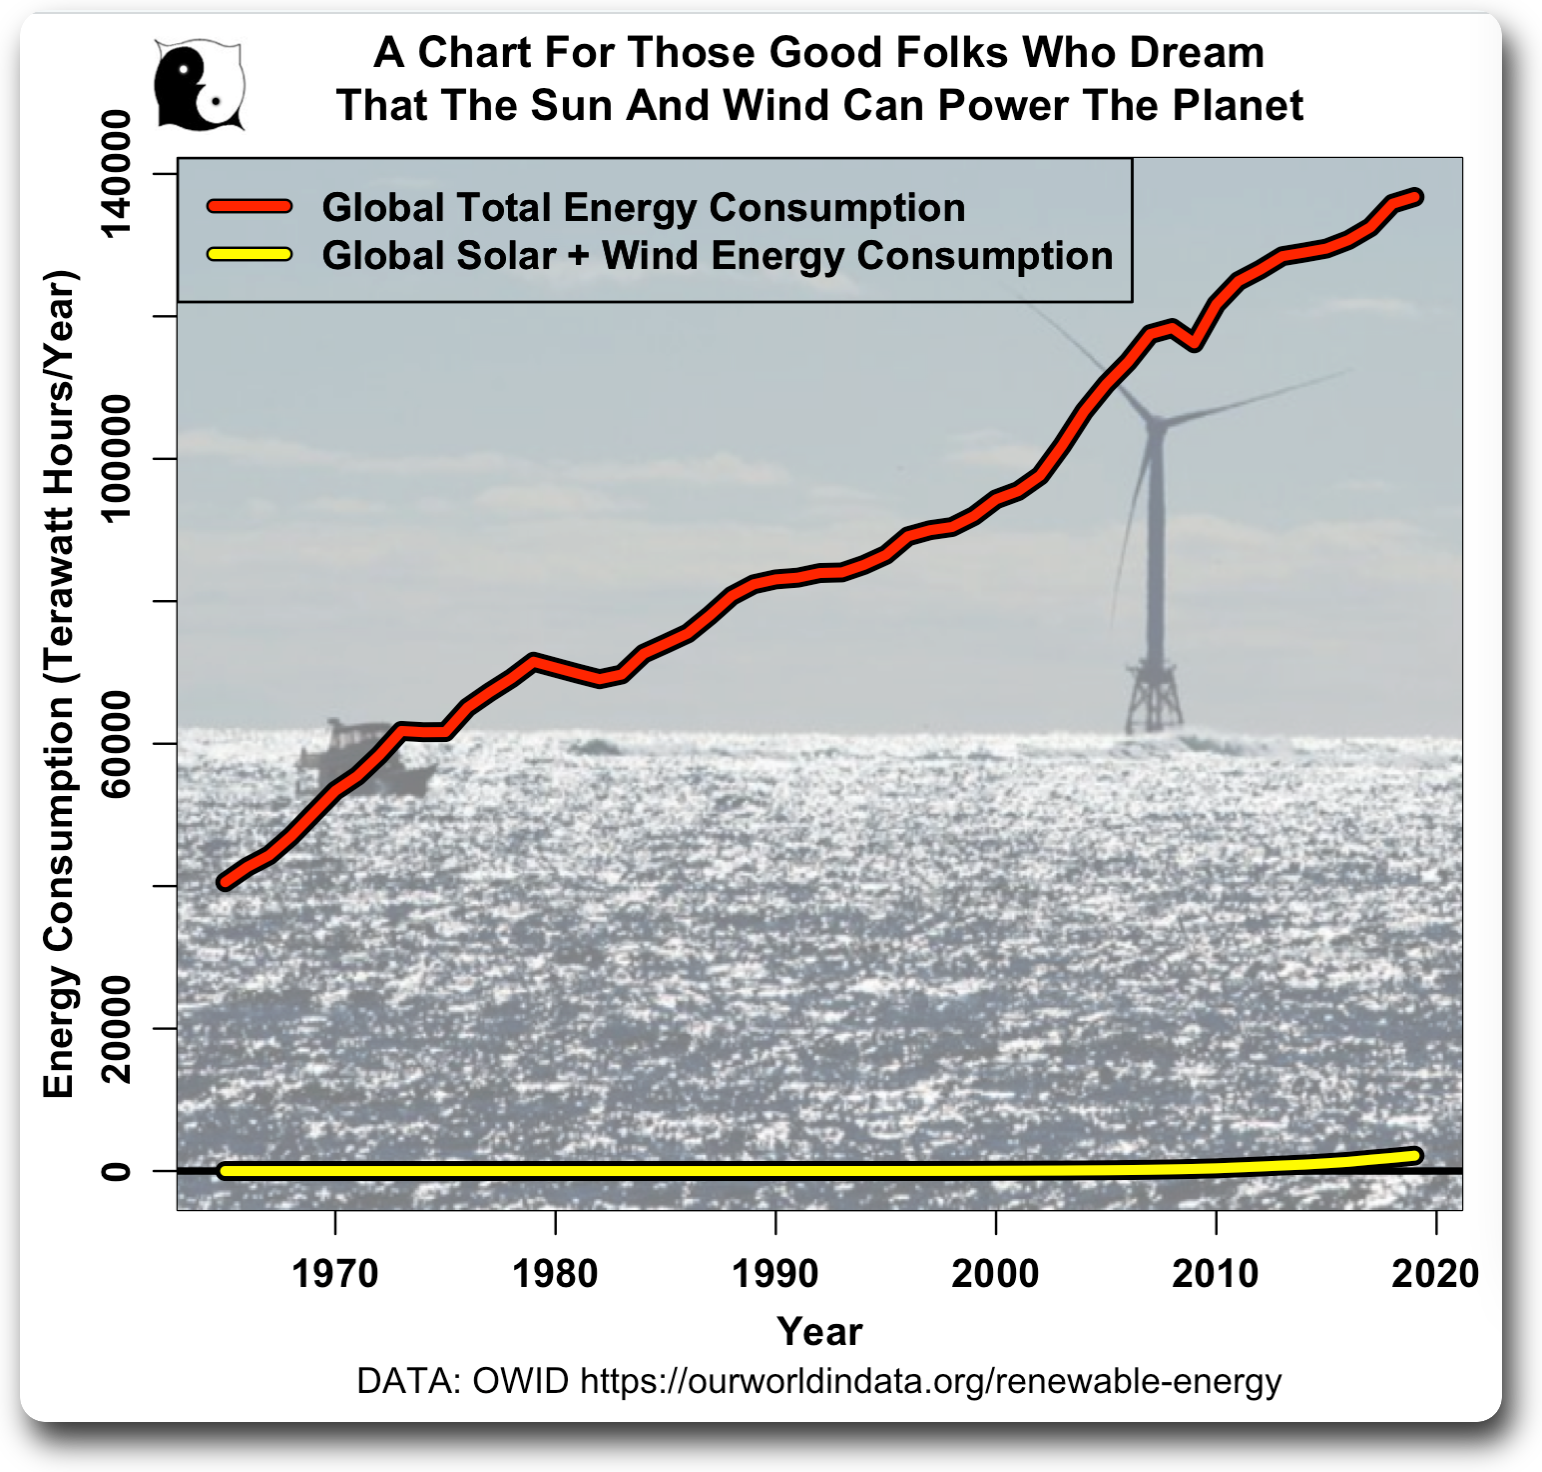
While interesting, Lord Monckton’s posts are theoretical exercises. He has not provided any actual data to back them up. And when I looked at the data, I found a problem—most countries are well below the “Pollock limit”, and thus they can’t say anything at all about what happens when the windpower share of total electrical generation nears the Pollock limit.

Figure 1. Percentage of electricity from wind by country. Dotted line shows the global average wind capacity factor, which is the average fraction of the nameplate capacity that a wind turbine can actually supply in the real world.
However, a couple of countries have renewables shares that are above the Pollock limit. I picked Ireland as a test case. I got the annual information on the Irish electrical supply from the BP Statistical Review of World Energy. Here, on a year-by-year basis, is the annual windpower share of total Irish electricity versus the annual installed capacity (red/black line), as well as the annual capacity factor (yellow/black line).

Figure 2. Annual Irish wind share versus installed wind capacity, and wind capacity factor. 2022 values are from here and are preliminary.
There are several interesting insights from Figure 2. First, in contradiction to the proposed numerical value of the Pollock limit as being equal to the capacity factor, the wind power share of total Irish electricity is well above the wind capacity factor.
Next, it’s interesting how much the wind capacity factor varies year to year, swinging about ± 5% above and below the average value,
Next, in agreement with the concept of the Pollock limit, as the installed capacity has increased, the windpower share has moved more and more in parallel with the wind capacity factor.
Finally, the last four years are particularly interesting. From 2019 to 2022 Ireland added about 4 TWh of wind nameplate capacity … but the share of the total generated by wind only increased slightly. So it certainly appears as though it’s approaching some kind of limit.
These facts taken together suggest that there is a limit, as the Pollock limit states, but that in the Irish case, it’s higher than the capacity factor.
To visualize this in a different way, I looked at the annual windpower share as a percent of the annual capacity factor. Here’s that result (yellow line), along with theoretical calculations of what it should look like if the Pollock limit were 100% of the capacity factor (blue/black dashed line), and also what the real limit curve might be (red/black line).

Figure 3. Irish annual windpower share of total generation as a percentage of annual wind capacity factor (“Pollock limit”)(yellow), along with theoretical Pollock (blue-dashed) and possible real-world (red) limits.
In Figure 3, the curves show the situation when as the share of total generation approaches some physical li limit, each addition of wind capacity will make less and less difference as it slowly approaches the limit.
So … is there a limit?
The Irish data strongly implies that such a limit exists. And at least in the case of Ireland, it’s likely higher than the current value of 22.5% above the Pollock limit. Is it on the order of 40% above the Pollock limit as the speculative red curve illustrates? Perhaps. Perhaps not.
The problem is that we don’t really have enough data to say definitely what the limit is for Ireland, or even if such a limit exists. What’s shown in Figure 3 could just be a temporary slowdown … or not. A few more years should make things much clearer.
And that’s what I have found out about the Pollock limit. I have exactly zero idea why Ireland is able to exceed the Pollock limit. The claim is that, absent grid-scale batteries, the Pollock limit is a real physical limit equal to the capacity factor. But that is certainly not the case for Ireland. It’s already 22% above the capacity factor. Why? How?
The reason cannot be economics, because Christopher’s mathematical derivation in his original post doesn’t contain any economics-related terms. (Or alternatively, if economics is the reason, then Christopher’s math must be incomplete.)
All thoughts on that question considered, although perhaps not replied to. So many drummers, so little time …
My best to all, and thanks to Christopher, Lord Monckton for highlighting Pollock’s most interesting theory.
w.
As Always: When you comment please quote the exact words you are referring to. I can defend my own words. I cannot defend your (mis)interpretation of my words. Thanks.
A Footnote Worth Noting: I am an honest man. I do my very best to tell the truth as I know and see it. Yes, I have been wrong, and more than once. And when I’m wrong, I admit it. Heck, I even have a whole post called “Wrong Again“, and to cap that off, another post called “Wrong Again, Again — who does that but a scrupulously honest man?
But despite being wrong at times in matters big and small, wrong far more times in my life than I’d prefer, I do my honest best to not ever lie, shade the truth, misstate facts, or deceive people.
So I’ll thank everyone to avoid accusing me of any of those misdeeds, as it angrifies my blood. And if that happens, it may well result in me conjecturing about the probable species and personal hygiene of some of your recent progenitors … and it also would involve a significant chance of me politely inviting you to engage in anatomically improbable acts of sexual auto-gratification and self-congress …
The whole analysis fails due to this choice. Ireland is not an isolated network. There are interconnections to Northern Ireland, Scotland and Wales.
Interconnections allow one region to use the other region as a battery having the power capacity of the interconnector but infinite storage capacity. That means that the local grid has the equivalent of substantial storage so overbuilding results in achieving penetration greater than the capacity factor.
I expect you will find France is the bunny that tolerates the intermittency on its mostly thermal generation.
Selecting Ireland is a strange mistake by Willis. As you say it has inter-connectors that flows power in both directions so they acts as a battery yet as I understand it the Pollock limit specifically excludes there being a battery in the system.
NB : My ICT data for the GB grid is from the ESO (National Grid) website, and has some inconsistencies with the Irish ICT (Moyle and East-West) data provided by the EirGrid website linked to by “It doesnot add up”.
For detailed graphics of ICT flows for the Irish grid I would recommend using their data, not mine !
Following the various “Pollock limit” posts here I isolated the ICT data (from ESO) for the GB grid for all of 2022.
Note that “24 GWh per day” of energy production is (to a first approximation) equivalent to a constant power flow of 1 GW.
From April to November the GB grid was exporting to France, at a rate of 1 to 3 GW, while EdF flew in experienced American welders to repair the pipes in their nuclear reactors.
I have read that Germany also exported a lot of electricity to France during this time period as well.
That process is now slowing down (it should be completed around March/April), and is a “one-off” situation unlikely to be repeated in the near future.
Power cuts here in France in the next few weeks are more likely to come from strike action than production / grid stability issues.
I think that EdF already announced they were planning to return some plants to maintenance in February having pulled out the stops to bring back capacity temporarily to cover cold weather demand in December. IFA1 is due to return to 2GW in the next few days, so if the weather turns cold and windless across Europe it could still be “interesting”. GB tends to outbid France during shortages: in December they were pleading to be let off their contracts guaranteeing supply to the UK under the Capacity Mechanism, and now they will have a bit more at risk.
That will certainly help UK green credentials.
I would like to know if France is importing intermittent power to the detriment of their nuclear generators under normal circumstances or if they just schedule them to maximise their economic value to France.
In Australia, the coal generators have to bid significant blocks of energy at negative prices so they undercut what the intermittent generators are willing to accept. Scheduling is entirely based on pricing with the occasional oders and compensation for dispatchable generators to remain connected to provide stability services. The FCAS market income is sometimes insufficient to cover losses in the energy market within the market operation so “orders” work outside the normal generator scheduling.
My data are only for the GB grid, but my “ICT sum” numbers were dominated by the IFA and IFA2 links until (at least) Q4-2021 / Q1-2022.
The “dip” from March to November 2022 in the attached graph correlates well with the (daily) graph at the end of my OP, which would indicate that the French demands on the Europe-wide electricity market for that particular time period can indeed be considered as “unusual”.
France built their nuclear fleet in the 1970s and 80s in reaction to the early 70s oil crisis. By scheduling refuelling and maintenance over the summer they were able to provide some seasonality of nuclear output. They used hydro and a small amount of gas to provide intra day balancing, and added exports to neighbouring countries as a further means of balancing. They were willing to take cheap French power at the margin, and provided small amounts of support in the other direction.
Because the nuclear plants were built in a surge they are all coming to the end of their lives at similar times, and the EPR replacement design of reactor has been in trouble ever since they attempted to build the first one. Macron’s first energy minister, the former clown, Hulot, decided to resolve matters by aiming to “replace” half the nuclear fleet with wind. It allowed him to ignore the festering problems for the nuclear fleet, while cozying up to German Greens in their anti-nuclear stance as a way of helping Macron to secure more influence within the EU. The French now have a problem that their previously neglected nuclear needs attention (“grand carénage”) so they are running short of capacity and have been importers from most of their neighbours paying top prices last year. The wind has not been a great success, and falls far short of anything useful anyway. In fact, if they continue to pursue it, it will become a nuisance because of the inflexibility of nuclear output. They will become importers at high prices when the wind doesn’t blow, and curtailers or exporters at low or negative prices when it does, while ruining the economics of their nuclear. They should revert to the successful grid design of the past.
Interesting, but once again we’re having the wrong discussion.
All adding wind and solar into the grid does is (1) make electricity more expensive and (2) make the grid less reliable. There is no benefit. There is no upside.
As for debating what percentage of wind and solar constitutes a practical limit to the share of energy that a given renewable source can supply to the grid without battery (or some other) backup, the answer is simple. ZERO percent.
Because when the wind does not blow hard enough, or when the wind blows too hard, windmills produce NO electricity. When the Sun is set for the day or there is heavy clouds or fog or the panels are covered in snow, the solar panels produce NO electricity.
In any of these cases, 100% of the electricity that would otherwise be generated by the windmills or solar panels must be dependably produced BY SOMETHING ELSE. They therefore REQUIRE 100% BACKUP. The “practical limit” is ZERO, unless we’re ready to return to kerosene lanterns and coal or wood stove heating.
While I sympathize with your conclusion, it is for economic rather than physical grid reasons. As a practical matter, most grids maintain a 12-15% spare backup capacity to insure absolute reliability. Some of that is hot spinning reserve, some is peaker. So a small renewable low single digit penetration is not a grid problem. Anything above becomes an increasing problem, incurring extra costs for backup and grid inertia. UK, Germany, and ERCOT are to the point where there are now BIG grid stability problems.
There is the argument on fuel savings. I don’t know if that actually reduces net costs but the idea is that some amount of wind or solar will be more that paid for by the fuel it saves at the thermal generation plants.
The thermal plants are necessary backup unless periods of no (or too little) power available is acceptable. They could supply all the power needed all by themselves but they use fuel to do so. By curtailing them when W or S is producing well, the fuel savings can/will more than pay for the W and S costs. As I said, I don’t know about the validity of this claim but whether or not it is a valid argument depends on the numbers, not the emotions.
It also ignores the severe medical effects of wind turbines.
See my links to posts at Euan Mearns’ site where the impact of wind on CCGT efficiency was dissected for the Irish case. Another way to look at it is that for the GB grid, the average efficiency of CCGT is about 48% compared with potential if operated as baseload of almost 60% (the best units manage slightly more). It’s quite a fuel penalty.
If All of the time =1, and Part of the Time is zero, 1, what’s bigger?
1 = 5/3
2 5/3 – 5/12* Part of the time. I.e. 2. must be less than 1, for all possible values of Part of the time, except zero.
So, tell us more about his “fuel penalty”.
Folks, now the 2 cycle engine powered goal posts…..
Folks, kindly belay this post. I still contend that that the “fuel penalty” is bogus, but this was a bad case of distracted posting. Arithmetic mistake and all. The first d.t. would be mine, if it was allowed. It will be superceded.
The fuel penalty is real. What it means is that the fuel savings from allowing more wind on the system are a lot less than assuming that specific fuel consumption per MWh generated is unaltered. Moreover, it was documented in a detailed study for the Irish grid.
A better comparison than the one I boned – badly. You either use free fuel most of the time, and fuel that costs 25% more than what it would cost for if you used it all of the time, a tiny part of the time. So, pick a use fraction, and then do the evaluation based on the parameter that you chose – fuel use.
It’s more of a technology mix question.
Solar and CCGT seem to be complementary (at least in places like Australia and Texas), because solar output is reasonably predictable.
Similarly, wind and OCGT seem to be complementary because wind is far more variable over short time periods and OCGT can respond quickly.
Sufficient pumped hydro might help in both cases.
Calculating the optimum mix to a first or second order approximation for various locations could be an enlightening exercise.
According to https://www.energymagazine.com.au/australias-top-performing-solar-pv-asset-in-2021/, solar in Australia has a capacity factor of around 27%, and wind around 40%.
OCGT uses around 50% more fuel than CCGT, so it seems the solar/CCGT and wind/OCGT mixes come out around the same fuel use.
bigoilbob January 22, 2023 10:49 am
With wind having a global average capacity factor of 25% and solar at 15%, your claim of “a tiny part of the time” is simply wrong.
With the benefit of a good portion of my lifetime having been spent at sea, I am intimately familiar with the old sailor’s saying, viz:
“The wind is free … but everything else costs money.”
Which is why just looking at fuel use is a fool’s game …
w.
You would need to do a cradle to grave economic analysis of hydrocarbon fuels consumed by the W&S industry, including mining of raw materials, smelting, transport, construction and disposal/rehabilitation.
I cannot recall any such study, though it might exist.
You cannot simply decide that W&S is cheaper because operational fuel costs might be. It is rather more complex.
Again and again, it makes me wonder why people have bothered to revive discarded technology like windmills. Geoff S
“Again and again, it makes me wonder why people have bothered to revive discarded technology like windmills.”
Yes, the cradle to grave analyses to date suffer from the bias of renewable subsidies. But renewable cost evaluations include most of your referenced costs. FYI, the relatively tiny (and diminishing) green start up helps are ~an order of magnitude lower than the (also skipped) externalized ES&RC and AGW fossil fuel costs that are now communized upon the rest of us.
I’m happy to have future decisions based on incremental, stochastic economic ROR evaluations of all the costs.
bigoilbob January 22, 2023 9:29 am
That’s not true at all. For example, the recent US bill provided $369 BILLION for renewable energy, and you can bet that the overwhelming majority of that never shows up in any renewable cost evaluation.
And as another example, the Lazard Levelized Cost Of Energy doesn’t even mention the cost of the necessary backup power for intermittent renewables, or the costs of the necessary grid stabilization equipment …
“Relatively tiny“??? Get real! Over the last two decades the Manhattan Institute calculated that we’ve spent $5 TRILLION on wind and solar. $5 trillion dollars, that’s equivalent to spending a million dollars per hour 24/7 for 570 years … and here’s what we got for that money.
We’ve subsidized wind/solar/biofuels $5 trillion over 20 years.
OWID says that they’ve delivered 9.12 petawatt-hours in 20 yrs.
That’s $0.55 PER FREAKIN’ KILOWATT-HOUR! Show me where that, or even half of that, shows up in the bogus cost calculations of wind and solar.
Finally, I don’t mind small subsidies if they deliver valuable goods. But here’s the comparison of fossil and renewable subsidies …

Sorry, not impressed.
Best regards,
w.
“That’s not true at all. For example, the recent US bill provided $369 BILLION for renewable energy, and you can bet that the overwhelming majority of that never shows up in any renewable cost evaluation.”
Another way of saying what I said.
““Relatively tiny“??? Get real!”
Your Manhattan costs are not for any real evaluations of projects. They are a lump of many years, which don’t include the recent geological and petroleum engineering/economic trends in CONUS oil and gas production. Nor do they include the exponentially declining renewable costs. And BTW, your subsidy v subsidy chart is FF industry bloviation. Most of thiri shirked costs aren’t included. Not the ES&RC costs Ben Dovered by regulators, not the AGW costs, not the 11-12 $ figures of asset retirement costs (just in the CONUS) now being shirked by either bonding at pennies on the dollar, or being “delayed” altogether because these Chevrons and Exxons will certainly make good on them.
I say again, I’m happy to look at actual incremental,stochastic evaluations that include ALL costs. But this picking and choosing from someone who still believes that the 2/21 Texas storm cost us less than $16B, is a nonstarter.
https://comptroller.texas.gov/economy/fiscal-notes/2021/oct/winter-storm-impact.php#:~:text=14%2D20%2C%20and%20almost%20half,%2480%20billion%20to%20%24130%20billion.
My apologies if it was Andy May who pulled out this boner.
bigoilbob January 22, 2023 10:26 am
Renewable costs are NOT “exponentially declining”. In fact, after declines in the early years, solar PV costs are hardly declining at all.
SOURCE—NREL
The same is true about wind power.
SOURCE—EIA
Decreasing, but hardly exponentially. And maintenance costs are increasing, not decreasing.
Note that as always, neither of these include the cost of load-balancing gear, synchrony gear, or backup generation … and those cost are going up with increased market penetration.
“Exponentially decreasing renewables costs” is just more alarmist bafflegab.
w.
At the same time though the W and S are also forcing up the price of the fuel used by, for example, gas plants in the UK because they do not know when they will be called upon and so cannot secure long term contracts with the gas suppliers.
Another data point
“Wind power production in Saskatchewan went into negative territory”
http://www.smalldeadanimals.com/2023/01/19/wind-power-production-in-saskatchewan-went-into-negative-territory/
dear gods what a mess – how can supposedly clever people blind themselves with their own brilliance.
While nobody has the balls, ‘cept maybe willis here, to call them out on it.
Moncton in his imitable style, far too mat words, has confused everybody and its not clear why or how.
So, take a really simple trivial case of, lets say, My House
In my house I use, on average 1kW or 24kWh per day
I want renewable energy so what’s to stop me planting a 100kW nameplate windmill at bottom of my garden.
In its depressing state in the UK, it will produce its 25% capacity factor of 25kW.
So on average, I will have 24kW of electric I can either give way or ‘feather’ the turbine and let it blow away to the next turbine or wherever.
How Is That A Problem for me?
At first sight I have masses of electric and its all renewable.
The only problem I would have is if the wind stopped blowing all together.
C’mon peeps, play the game. We’ve been through this via the UK agency charged with rolling out renewable energy.
I forget their alpabettispagetti name but they asserted that wind could power the UK apart from only 7 days per year = 7 days when there was No Wind across the UK incl. territorial waters
The essay we had here at WUWT asserted that that was pie-in-the-sky dreaming. That anyone could go look at UK weather history to see that the wind stopped for 70 (seventy) days per year and not 7 (seven) as claimed by the BSIESSRESISEESSIS Agency, or whatever they call themselves now.
See now where Pollock went wrong?
Pollock has confused the capacity factor of the actual turbines with the capacity factor of the wind itself
So: UK turbines have a capacity factor of 25% of their nameplate, as recorded, but the UK wind itself has (as recorded in the climate record) a capacity factor of (365-70)/365 = 80%
……and if you built enough turbines that is what you’d get.
Hence Ireland and theirs should be even higher, sitting out in The Pond as they do with an endless stream of anticyclones tracking along the Gulf Stream
Et Tu Monkton: Ipsum Laudum Loadium Confusium Bullshittium Et Bolloxium
The question is really about how the costs of obtaining that 80% vs the benefits increase over buildout, not about whether it is, in theory, possible. The cost considerations is what the Pollock Limit is about, not the possible maximal generation.
To make an analogy, the really stupid ‘Social Cost of Carbon’ arguments only address the (supposed but quite irrational) detriments of using fossil fuels while refusing to compare any downsides with all the benefits, or with the detriments of curtailing fossil fuel use.
Another analogy is to how non-linearly costs increase with the efforts to increase efficiency or cleanliness or any other desired gradient between the real world and human aspirations.
AndyHce January 19, 2023 4:40 pm
NO!!! That is simply not true. Look at the math claimed to underly the Pollock limit. There’s not one term in there about costs, or overbuilding. It is claimed by Monckton to be a “FUNDAMENTAL LIMIT” (his words) on what, sans battery backup, a renewable source can supply. Not a cost limit, not an overbuilding limit, but a fundamental physical limit.
w.
WE wrote:
Which, as I tried to explain (poorly apparently), for solar PV it cannot be such—calculating a capacity factor from the “nameplate” power rating on a PV module is a very bad metric with little connection to how much energy it might deliver when installed. Pick a different power rating, and you get a completely different Pollock limit (yes, there are alternative power ratings).
You said “And that’s what I have found out about the Pollock limit. I have exactly zero idea why Ireland is able to exceed the Pollock limit. The claim is that, absent grid-scale batteries, the Pollock limit is a real physical limit equal to the capacity factor. But that is certainly not the case for Ireland. It’s already 22% above the capacity factor. Why? How?”
A bit more analysis: If a particular type of renewable is 100% on for part of the time and producing 0% for the rest of the time, then Pollock’s limit would be true. When the capacity was sufficient during the time the renewables were producing 100% of capacity, there would be no point in adding more since it would be unused unless there was storage. But consider solar, it produces 100% for a few hours in the middle of the day but decreases to almost nothing in the morning and afternoon. Adding more then the Pollack limit will have a small benefit since a bit extra will be produced in the shoulder times even though power produced at the peak time will be wasted. The cost/benefit trade off is terrible because the extra panels will only be useful at a time of day when solar panels can’t produce much power anyway.
That’s the trade-off for one type of renewable. If there are two types that produce power at different times, for example solar and wind, then it can pay to exceed the Pollack limit in total as long as neither does alone, since sometimes one will operate at peak power while the other is at low power.
Storage changes the equation again. At present, I think the only feasible storage is pumped hydro.
One way to estimate the cost of it all is to run a simulation. I did one in VBA. I set a % output for solar for each hour of the day, and set the % of wind to be random. The profiles were set to add up to the capacity factors. I set %s for power requirement at each hour compared to average usage. The simulation stored excess power as pumped hydro and could assume 80% or 90% return on pumped hydro after allowing for pumping losses.
I can send you the code for the simulation if you like.
The limit would be load on the grid after all other baseload and dispatchable sources have been displaced off the grid since generation and load must balance. Battery storage is a farce; ridiculously expensive to ride through lulls that last a few days. As other reporters have noted on this site, generation has to be overbuilt by several times actual load for net zero – 3x-6x wind/solar + 1x baseload + 0.3x dispatchable.
The Pollock Limit is fishy
The Flounder Limit is correct
(Nobel Prize pending)
Politicians will force spending on unreliables untli the money runs out ( they can always print more ) or until a nation’s grid flounders with a big blackout.
If that nation happened to be getting an average of 35% of electricity from wind and solar, then 35% will be considered the danger zone for other nations. The 35% will be their arbitrary Flounder Limit.
And this ain’t no fish story.
PS to Willis E:
You have not lived until Monckton has called you a climate communist, as he did to me in a comment. I put that on my resume — could get me a job in the Biden Maladminstration.
“Flounder Limit”
I like it! 🙂
It is just pollocks.
Perhaps others have already pointed this out. I have not yet read any comments but in relationship to Willis’s statement, exactly quoted here, That is NOT what the Pollock limit says.
What it says is not that electricity above the average capacity cannot be provided through wind generation but that total costs will rise sharply if generation capacity above that average capacity, is built. For reference look at California’s solar generation, and the UK and German wind generation vs total electricity costs.
Also, it isn’t completely clear to me if the ‘Pollock Limit” value considered here for Ireland is actually for Ireland or the globe average shown in figure 1. I think Monckton’s inclusion of figure 1 was a tactical mistake. It apparently led to many people believing that particular value should be used everywhere while in fact it is a variable, dependent upon location.
As most of us understand, wind and solar produced electricity often does not match demand for electricity in the time domain. Constraint payment to producers, or payments to other geographical area to take the excess generation off the hands of the producer, rise sharply during hours when generation is high and demand is (relatively) low. Another theoretical way to handle this is storage, which is even more expensive than constraint payments or ‘I’ll pay you to take it away’ payments.
I’m not arguing that the Pollock limit is complete correct or incorrect, I included some questions in the Monckton articles that were not addressed. In fact, my second post, addressed to Monckton specifically, in which I tried to rephrase and be more detailed. Apparently did not pass moderation. It isn’t there.
I will try to repeat the question here in a hopefully intelligible form.
Is the claim that the calculation of the Pollock limit is independent of the generation temporal distribution, such as over a year’s time?
If the distribution of electricity generated over the year were to be normal (seems unlikely but is a simple example), 50% of the time generation would exceed the average capacity factor. Does that effect the costs bias that the Pollack Limit is supposed to predict? Does it effect storage requirements or constraint payment requirements? It seems likely to me that it does even when build is somewhere significantly below the Pollock Limit, if said figure is calculated based simply on the average capacity factor.
As a particular example, some years ago, in a discussion about the future of wind in Iowa (not on WUWT) I obtained data from an official Iowa web site. One interesting factoid was the extreme between the six coldest months vs the six warmest months. The capacity factor for the warm times was 16%, for the cold times it was well above 40%; I think it was 48%. Perhaps that has changed but I don’t see why it would unless Iowa weather has changed markedly.
I don’t see the average for the year (32%) as having any meaning whatever. Any overbuild of less than 6+ times would still mean an average deficiency during the warm months and any overbuild of more than 2 times would mean considerable excess during the cold times (except perhaps during some exceptionally cold storms where heating requirements rose extremely – if wind still worked under that circumstance).
‘ total costs will rise sharply if generation capacity above that average capacity, is built.”
Nonsense. The cost of building a new wind farm, or a new solar farm, does not depend on the existing percentage of electricity created by wind and solar energy.
The capital costs for wind farm #133 should be similar to the capital costs wind farm #3, adjusted for inflation. Maybe lower if the windmills used are more efficient.
The incremental value of new wind and solar farms should gradually decrease, from being almost a total waste of money for the first farm, to a total waste of money for later farms. That is assuming the first wind farm will be built in an exceptionally windy location, and the first solar farm will be built in an exceptionally sunny location. There will be diminishing returns as the best locations are used up.
But the bottom line is really that EVERY wind farm and EVERY solar farm is overbuilding.
Iowa viewed in isolation has winter peaked demand and windiness. For the ConUS 48, demand is heavily summer peaked for aircon, with only subsidiary peaks in winter. The low demand seasons are in Spring (April) and Fall (October). The result is that you need an admixture of solar to minimise the amount of storage or backup TWh of generation (but you still need lots of GW of backup generation).
The storage/backup requirement is surprisingly insensitive to the wind/solar ratio over quite a wide range. However, higher solar deployments require more grid/storage input capacity if they are not to be wasted.
This chart shows the distribution of electricity generation/demand for the US lower 48 by month and over the year as a whole, using hourly EIA data.
Your smooth sigmoidal curves look to have empirical support so far but the worry is that the numerator of your ordinate axis “Annual Share of Generation” which, unlike the weather-determined “annual capacity factor” in the denominator, is a function of the thinking, intentions and actions of those that determine energy policy/infrastructure build in governments/generators. Since outbreaks of irrationality/hysteria (e.g. climatophobia) are unfortunately too common in human thinking, often driven by malign forces, there is no guarantee where the empirical trend could go (i.e. does it have a theoretical upper asymptote? – given the above, the answer is no i.e. massive and continued overbuild makes it linear not sigmoidal if you do not run out of raw materials). After a good start I had a bleep in my early career being employed as an econometrician but thankfully I steered back to biometrics (statistics applied to biology) for the remainder. As an econometrician how does one project future fossil fuel prices when a meglomaniac in Russia out of nowhere invades Ukraine and causes more than a major bleep??
Your megalomaniac claim is wrong. I would explain why but every post I have ever made here criticizing Ukraine has been censored, so why bother?
“And at least in the case of Ireland, it’s likely higher than the current value of 22.5% above the Pollock limit.”
Although not covered in Monckton/Pollock theoretical math, the limit itself may be closer to correct when you take into consideration real world degradation of cap. factor over time – they are found to lose 1.6 ± 0.2% of their output per year, with average load factors declining from 28.5% when new to 21% at age 19 (calculated using UKs 282 wind farms). So, you would have to know the progress of cap factor increments over time, to do calcs. (decommissioned in the 20th year after cap factor has declined to 74%). Perhaps we are seeing a real inflection point and things will flatten at current levels over the next several years.
BTW, Monckton did mention the cap factor reflected the regional weather conditions so they are higher or lower for various countries. Ireland may be windier than average.
Ireland does have the ability to export electricity, maybe that is how they are able to get higher than the Pollock Limit.
The external grid acts as a defacto battery.
I think the “Pollock limit” would not depend on the average capacity factor of the world, but on that of Ireland, which apparently is well suited for wind power.
It should also depend on what storage is available, and of course depend on how much your neighbouring countries are willing to buy your excess power.
One could conceivably install 100% wind capabilities if there’s generous neighbours available with deep pockets.
And I think geography will come into the equation, put only once wide spread grids become available so that windy areas can share with calm areas. That happens now but not on the scale large enough. Imagine if Texas could share power with California or New York, or Portugal with Germany, on a scale of 10s of gigawatts.
I don’t think a renewable grid will be reliable and cost effective, but it’s amazing to me that green fanatics are pushing more for money to be spent on the power lines to create continental grids, or even transcontinental grids (Africa – Europe – Asia) instead striving to build with the current turbines and panels that will be obsolete and junk in a few short years. In last few years quite a lot f resources have gone into using 10-14 MW turbines, but recently 16 and 18 MW units have been announced. While it’s fine installing a few current models here and there as test pieces, but it doesn’t make sense to build out GW farms with them.
Better to save our resources by waiting until we can put 25MW on a stick or perhaps 100MW, whatever it is when we get closer to the practical limit. Or course its best to forego the fad and just stick to ccgt and super critical coal plants, whichever works best with the resources in your area (like the way nuclear and hydro work really well for Ontario)
Willis,
Two issues, I have hesitated posting either here or on Manhattan Contrarian, but they may be pertinent. Ah don’t raht so gud, but here goes:
First, near to a year ago, featured in WUWT and nearly simultaneously in some other online publications, Stein and Stacey describe why nameplate ratings alone (for renewables vs reliable energy sources), and capacity factors derived from ratings, are unfit for evaluating the contribution of usable renewable power an electrical grid, and propose an alternative: https://wattsupwiththat.com/2022/01/29/we-should-not-compare-electricity-sources-using-nameplate-ratings.
Misleading are the public relations efforts intending to make people feel good about weather dependent electricity from wind and solar “taking root” and “replacing” traditional continuous uninterruptable means of making electricity.
Comparing nameplate ratings of various electrical generating powers sources is comparable to using IQ as the only or most appropriate measure of the value of an employee to the company he or she works for… If everyone had the same health level, skillset, and work ethic, it might suffice. But we don’t. And neither do different kinds of power plants.
…
For wind and solar “nameplate rating” is neither a measure of expected electricity generation over time nor their contribution to system reliability. Yet time and time again we see government entities, grid operators and especially news media spouting GENERATING CAPACITY (nameplate rating) in comparisons with conventional generating technologies.
…
PJM, the largest wholesale electricity market operator in the world seems to agree in this statement describing the priorities in their most recent renewables transition study: “Correctly calculating the capacity contribution of generators is essential: A system with increased variable resources will require new approaches to adequately assess the reliability value of each resource and the system overall.”
This speaks directly to the importance of accurate system adequacy contribution comparisons between different generating technologies as the headline metric of value – instead of nameplate rating.
…
A better way of estimating system adequacy contribution looks at recent historical generating patterns of renewables in the context of the load patterns and amplitudes they might serve, independent of the existing generation mix. We favor one called “Mean of Lowest Quartile generation across peak load hours (MLQ) suggested by the market Monitor in its 2012 SOM report on MISO.
—
Realistically, by this metric, the following shows both nameplate capacity (outlined, not color-shaded) and system adequacy contribution (color-shaded) of the US electricity mix as of the end of 2018.
{Failed attempt to paste S&S image here, with the above caption, but better viewed at the Stein/Stacey article linked in first paragraph. Image may appear below)
At a glance, Stacey/Stein appear to be on scale with Pollock per Monckton.
Second, From your statement
“… in contradiction to the proposed numerical value of the Pollock limit as being equal to the capacity factor, “
seems to itself contradict the Monckton text you have quoted above https://wattsupwiththat.com/2023/01/19/the-pollock-limit/#comment-3668590
“…the maximum possible fraction of total grid generation contributable by unreliables turns out to be equal to the average fraction of the nameplate capacity of those reliables that is realistically achievable under real-world conditions.”
[emph mine]
..
My reading puts the Pollock limit per Monckton, not as the same as the wind generation capacity factor, but equal to the Mean Hourly Demand divided by the Hourly Average Capacity factor of the RELIABLE portion of grid generation capacity.
By adding short time dependencies to both demand and generation, Pollock may be addressing the same concerns as described by Stein and Stacey.
Remarks and color commentary,
Monckton’s hyperbole aside, while different both S&S and Pollocks approaches seem to support one another in their answers, and at least undermine calculations made from public “happy” claims by press releases from European government and industry.
Generally I find Monckton alternately supercilious, hilarious, hyperbolic, annoying, sometimes educational, and entertaining; and often all of those within a single sentence. Among other occupations, he is a past professional maker of logic and math puzzles, and in what I’ve read, it seems that he delights in posturing, puns, non-sequiturs, and laying of small traps for the unwary (ie agreement among skeptics as a measure of success seems especially absurd), but seldom does he place any of those in a piece where they might directly contradict his main point. While he may be, as another Brit once quipped “so sharp that he cuts himself,” I am nowhere close to being able to challenge his, yours or F. Menton’s reasoning or math. In this case I think you may all be talking past one another, and I’ve hesitated to post rather than amplify the noise. But your “value of the Pollock limit as being equal to the capacity factor” is not in line with my (sadly labored) reading of Monckton, and may require your attention.
Illegitimi (et Trolli) nil carboundum.
Stripped of graphs and blather, it is easy to understand the Pollock limit and why it can be exceeded.
In short if you add more renewable energy to the grid so that the peaks exceed the demand ( or the average exceeds the Pollock limit) there will be times when you have excess energy available that you simply have to dump.
You can simply throw it away – this happens on a local basis when the cost of paying wind farm operators to shut down is less than the cost of building a bigger cable from e.g. Scotland, where the bird mincers are, to England, where the electricity is consumed.
You can export it to somewhere else at super low cost), whose intermittent renewables haven’t yet reached THEIR Pollock limit. In the case of Denmark, for example, Sweden has masses of hydroelectricity and is no more than a couple of miles away across a shallow strait. Plain hydro power isn’t exactly storage, because not much of it is pumped, but when you have hydro capacity, but not so much rainfall, you can conserve your water in times of (someone else’s) high wind.
Or you can pump water up hill and store a percentage of the surplus nearby.
Note that, in theory, all these are possible solutions, but all of them are expensive solutions, And that explains the dichotomy.
Ultimately if all grids become interconnected, then the Pollock limit holds as the limit of unaffordable production, and above that renewables become completely ruinous.
In the case of intermittent renewables plus hydropower, in a closed isolated grid, Pollock limit still holds as the point at which you start throwing windpower away. In an interconnected grid, you can’t really talk about e.g. Denmark in isolation, because it isn’t. It’s sharing its limit with Sweden. And Germany, and indeed, all the way down to Spain and Switzerland. Western Europe has but one grid in reality, although interconnections between the national grids can be severed and are not of infinite capacity.
My conclusion is neither of the people in this fight actually understand the real facts.
The first misconception is that the Pollock limit is anything other than financial.
The second misconception us that national figures have any meaning in an interconnected world.
I hope this clarifies.
A useful comment. The answers lie somewhere between examining the positions of individual countries, and the “copper plate” grid assumption that surpluses and deficits can be matched anywhere and everywhere. The latter assumption is often compounded by “wind is always blowing somewhere” assumptions, coupled with completely unrealistic assumptions about the performance of future wind turbines and solar panels when studies are done in support of justifications for net zero type policies. There is no way that 500GW of wind will be built in Greece and its output distributed across the EU, just because wind in Greece shows low correlation with NWE.
Willis, I have no idea whether the Pollock limit is real or not. My intuition says not because the ecoloons don’t care whether overbuilding makes economic sense, although that will be their downfall in the long term.
I also often find CMs arguments difficult to follow because of his overblown style and need to inject latin tags at every opportunity. He makes lots of good points that imo don’t always get across to people because of his style.
I sometimes don’t follow your maths either (my bad), but your style is very clear and understandable and I suspect there is some jeaiousy about this.
Keep up the good work both of you !
Maybe I am finally understanding how the Pollock limit might happen? Which is to say, why there should be a correlation between the percentage of power you can get from intermittent source (say wind) and the capacity factor of that source (your wind plant).
Imagine a country where the wind is very constant but light. Then it can generate a very high proportion of its power from wind. But its capacity factor (assuming it does not ridiculously overbuild) will also be very high, because the wind is continuous and it will be generating all the time.
Now imagine a country like the UK with long dead calms, lots of low wind periods, also lots of high wind periods. The capacity factor has to be lower (assuming again no ridiculous overbuilding) because adequate provision will require more capacity than in the first case, but it will be idle quite a bit of the time, and also overgenerating quite a bit.
You could raise the percentage in the second case by doing something useful with the excess generation, like charge batteries.
So I can see that capacity factor could be rough proxy for the percentage of generation you can get from a rationally planned intermittent installation. Its because there will be a correlation between the capacity factor and the distribution of the generation.
If the distribution of your intermittent generation is pretty much flat due to the local environment, this leads to both high capacity and continuous supply. If its very sharply peaked with long tails, this leads to lower capacity factor and more times when it produces a very low percentage of demand.
The argument would be that in almost all of the world wind generation distributions are pretty much the same, having the same peakedness and spread, so the capacity factor is a decent rule of thumb for how much of your demand you can expect to meet from wind.
Is this right? I think, if I have understood them its pretty much in simplified language what quite a few others have said in different ways on this and the other threads, particularly “It doesnot add up”.
The way to make the point to politicians is not algebra. You have to say, this is how generation in your country works. Show a graph of the distribution. Then say, because this is how the local winds are, you are never realistically going to get to a higher percentage of generation than [this].
You could also show them why it works – different distribution patterns, different max percentages.
I tried that. They chose to suppress my evidence.
Yes. None so blind as those that will not see.
Yes, it’s not complicated. Incredible how many commenters went to extremes trying to find some trivia to discount the accuracy of the Pollock Tool; and even more effort into finding fault with Monkton’s description of its usefulness and application. Petty and Nasty IMHO.
Dear Willis,
In fact there is a practical limit for the maximum amount of renewables that can be allowed on any network: that is at about 70% of the total production.
Germany has a an overbuilt number of renewables of near 160% of average winter use: 130 GW of wind and solar installed:
https://energy-charts.info/charts/installed_power/chart.htm?l=en&c=DE&year=2022&chartColumnSorting=default
and maximum winter working day use around 80 GW:
https://energy-charts.info/charts/power/chart.htm?l=en&c=DE
That means that they need to dump (even at negative price!) some 60% of their wind and solar capacity at the neighbors when there is maximum wind and sun. Up to now, that is possible, as the neighbors have not the full amount of renewables installed, but when these catch up, they have to get their windmills and solar panels stopped.
Moreover, there is another important constraint: renewables have no own frequency (solar) or an independent frequency (wind), that needs to be converted to the 50 Hz of the main network.
Up to now, the converters use the 50 Hz of the network itself to convert the DC or other frequencies to the 50 Hz of the network.
That only works when there is enough “spinning” production from water/steam/gas turbines/generators and on the other side enough users with spinning motors to keep a stable 50 Hz in the network.
That “spinning” minimum is around 30%, or any disturbance (like a lightning strike on a high voltage line) is enough to get reinforced by the non-spinning sources and the whole network shuts down…
Could it be something to do with Ireland being connected to the UK grid?
In Ireland, the average demand is about 3500-4000MW, and there is something like 4500MW of wind installed. So we can get in or around 35%-40% of energy from wind – at times it will be significantly curtailed / dispatched down. However through a sleight of hand, the regulator deems any wind above system demand as market oversupply – so you have an oversupply category and then a dispatch down category where you curtail wind for operational reasons. The government plan is to reach 80% wind, which will involve installed something like 12000-15000MW of wind, so that the average value taking into account capacity factor is around 4500MW. How all this gets paid for, or how many birds will be killed, well the government and regulator don’t bother with those sorts of details. Of course the whole thing is madness, and is driven by green party policies and EU policies, and a permanent government / civil service class who refuse to ask the hard questions.
Note that the interconnector flows (HVDC) to GB are driven by market prices, and can flow in either direction. It is not correct to say we just export excess wind – Scotland and Wales have plenty of that already, they don’t need ours.
Ireland will export at least as long as they get a positive price for it. I suspect they even on occasion accept a negative price rather than go through the expense of rebalancing the system. Irish export prices consistently average below GB system prices, and their imports average higher, as you might expect being tail end Charlies on the European grid.
The Pollock limit is nonsense in one key sense; has real world impact in another and there’s a 3rd hand. Apologies in advance for a long post.
The nonsense part is name plate capacity of intermittent supply vs. the same capacity in dispatchable.
Intermittent = solar PV and/or wind; dispatchable = fossil fuel and/or nuclear.
Pollock is clearly trying to say that the ~30% capacity factor of wind and ~20% capacity factor of solar PV do not equal the 60% to 80% (or more) capacity factor of dispatchable even if net installs of capacity factor equal out. While this is absolutely true, the problem is that he is failing to recognize that this can be offset by simply overbuilding to an enormous degree. If 2-30% GW of wind is not equal to 1-60% capacity factor coal plant, then just built 3-30% GW of wind and 1-20% GW of solar PV. If that’s not enough, just add more.
The real world impact, on the other hand, is valid.
In reality, both solar PV and wind have serious mismatches vs actual demand. Solar PV supplies electricity primarily between 10 am and 2 pm – which is the lowest point of demand in waking hours. As such, solar PV beyond a very small percentage is always going to be supplying electricity when it is not wanted – and this is a serious problem for the grid because grids are designed with “input only” controls. Or in other words, a grid operator has zero control over demand and thus must break supplier contracts when supply exceeds demand by a significant degree. This is where curtailment costs come from: 807 million euros for Germany in 2021; 200 million GBP/year average for the UK in the last 2 years and $210m/year for Texas (excluding Winter Storm Uri 2021 which would skew the average up by a multiple).
For wind, at least in Texas but likely everywhere, it turns out that a significant portion of generation occurs at midnight. Midnight is also a period of very low demand – hence curtailment cost as grid operators break wind supplier contracts. Breaking a supplier contract means paying for power even if it isn’t actually used. In theory – once this initial set of contracts expires, there should be new contracts where the curtailment costs are reduced/negated but politics may make this impossible as it would very possibly cause wind/solar PV projects to be uneconomic going forward.
The third hand point, and the most important, is probably where Pollock and Monckton are trying to get to. That is: wholesale electricity prices whipsaw enormously from literal negative prices (it seems around 30% of the time = wind cap factor?) to infrequent but severe situations where shortfalls cause ginormous price spikes due to intermittent suppliers output.
This is problematic for many reasons.
First: because the negative prices are completely unpredictable – nobody can make use of them (yet. What I am working on, can).
Second, as the overbuild of intermittent supply increases, there is a real possibility that the price spikes become so unpredictable that dispatchable backup becomes uneconomic to maintain. The fossil fuel types call this the “spark spread” – the difference between the fuel cost burned to make electricity vs. the actual price paid for electricity. Prior to the advent of mass intermittents/overbuild into the grid, there were some plants that were economic to operate simply because the normal morning and evening duck curve spikes induced price increases such that a dispatchable plant could be economic to operate even if it only turned on during those periods. However, if a massive overbuild of intermittents (beyond even present levels, such as the Inflation Reduction Act is likely to induce), then the massive overbuild – despite curtailment cost – is potentially going to even make that model uneconomic. At which point, the dispatchable operator either sits around waiting for a Winter Storm Uri type situation or just mothballs the plant. The latter seems most likely. And the result would be bad – which means the actual outcome will be even more payments to dispatchable operators because the variability of solar PV and wind on short, medium and even annual time scales is such that you pretty much are forced to have significant dispatchable capacity. It isn’t actually 100% for a large grid like Texas, but it isn’t that far off either.
I’ve posted in the past 2 different days in the summer last year where Texas hit record demand. The amount of electricity supplied by wind or solar PV on those 2 days varied A LOT – this gives an idea just how much intermittent variability is a problem for 1st power electricity supply reliability. On day 1 (7/11/22): intermittent supply was 897 MWh wind with solar at 12005 MWh. On day 2 (7/13/22) intermittent supply was 4975 MWh wind and 6573 solar. You can see that on these 2 days just 1 day apart – wind and solar varied dramatically even in a very extreme heat case. And on both days, the vast majority of actual demand was met by dispatchable (66882 MWh and 67015 MWh, respectively).
When I read Monckton’s latest post, I was concerned that there didn’t seem to be any discussion of the fundamental physical reasons for the Pollock limit. Did I miss something?
No. Intermittent energy sources would not have access to the grid but for the political alignment of climate alarmism and economic rent seeking.
Is Monckton proposing the limit on an economic basis or physical basis? The mention of battery storage suggests that is physical, but I can’t be sure.
This essay gives a single example from a rather small island country. No indication is given or any uncertainty, error bars or even C.I.s, or any other idea of whether or not the data is accurate or is all estimations.
Given the uncertainties that must be involved, your “back-of-an-envelope” calculations seem to confirm Pollock’s hypothesis of a limit, rather than refute.
Remember, “neither Mr Pollock nor [Monchton] was asserting that it was physically impossible to exceed the Pollock limit.” Only that doing so could/would lead to problems.
And Ireland’s grid did have, and continues to have, problems.
In any case, this one little incomplete example certaintly does not disprove Pollock.
Kip,
I’m uncomfortable with Pollock’s ‘proof’, since it necessarily assumes that both f = f_max and an aggregate estimate for the renewable capacity factor, R, necessarily apply under the specific condition that N = D. These clearly make for a short, back of the envelope, derivation, but are they true?
But to your point that Ireland’s grid may not be representative, I took a look at PJM, which is the grid operator in my former neck of the woods. They’re a big grid operator, with a lot of renewable generation, given their operations includes several REGGI states. Anyway, I looked at the load / renewables problem the same way a portfolio manager might look at managing financial risk, i.e., by hedging. Here’s my data:
PJM RTO: 2022 Load and Renewable Generation
2022 Hedge Ratio from Hourly MW Changes
Load 1.00
Wind -0.49
Solar 1.51
Renewable 0.35
2022 Hedge Ratio from % Hourly Changes
Load 1.00
Wind -0.01
Solar 0.00
Renewable 0.02
Portfolio Characteristics in MW:
Load Only Load – Wind Load – Solar Load – Total
StDev 16,116 16,602 15,818 16,288
Min 60,754 54,360 60,750 54,366
Max 147,716 143,385 144,810 140,373
Average 90,766 87,173 89,762 86,169
NB: Hedge Ratio = corr * sigma_Load / sigma_Renewable
None of the hedge ratios suggest that covering load with wind, solar or both are appropriate ‘hedges’ for PJM’s load, and in fact, wind is actually anti-correlated with load, meaning one would rather short it than own it. And while both wind and solar do make a contribution to load and reduce the amount of conventional power that needs to be scheduled (min, max and average), wind, and the combination of wind and solar actually increase the variability (stdev) of conventional energy scheduling.
A more comprehensive analysis would need to incorporate costs, but it’s safe to say that these would need to be demonstrably lower in the case of adding renewables to off-set the increase in load uncertainty. My gut feel from looking at CA, UK and Germany is they aren’t.
Frank ==> Monckton/Pollock Limit isn’t my issue….the men who would know is Lars Schernikau or Willam Hayden Smith who wrote “The Unpopular Truth about Electricity and the Future of Energy”
The issue isn’t something that can be comprehensively proposed as an hypothesis or refuted in a blog post or two…certainly not by one-off quicky analyses of a single non-representative local grid.
Sounds like a good read, thanks.
I am inclined to agree. I have now spent almost a decade looking into renewables performance and assumptions made for future projections of what is claimed to be feasible in very different circumstances in terms of natural endowment around the world. Most politicians show zero interest in reality, and prefer to push towards systems that are becoming increasingly costly and fragile, and risk failing to support a modern economy and way of life. For some that is their objective anyway.
When I dissect studies produced by consultants commissioned on behalf of governments I regularly find all manner of hidden assumptions that allow them to pretend that everything will be hunky-dory, and so the politicians plough on. They seem able to recruit senior professors who should know better (Dame Julia King is a classic example). Politics trumps science and engineering.
I have found that there is really no substitute for detailed and lengthy calculation, using as near to real data as I can get at high resolution. If you want to get some idea of the risks on a 1 in 50 year basis, a one year study incorporating an artificial yet carefully callibrated difficult week will not crack it. If you want to understand the value or hazard of interconnection it does not do to assume that the other end of the line will solve your problems. You have to look at the real grid implications, rather than assuming a “copper plate” where local surpluses and deficits are automatically diffused. Proper understanding of the sensitivities is also essential for pointing out the risks.
When you do a lot of this work, you do get some feel for how things work and how they fail. It is certainly true that beyond modest levels of penetration costs start escalating. The detail depends on local circumstances of resource and demand and the interaction between them. Over the course of these threads I have tried to illustrate some of these things.
The Irish problem is the same with many grids that are attempting to push renewables heavily. They end up short of dispatchable capacity, often the result of political whim (see Alok Sharma blowing up Ferrybridge and Sturgeon blowing up Longannet, Germans closing nuclear etc.). EirGrid had at least identified the problem and told politicians they need more CCGT capacity, and that they needed to be prepared to restrict exports at times of system stress, which they have since done.
First, I did not say that the Irish data “disproves Pollock”. Read the post. I said:
Next, the data is from the source listed in the graph. They don’t give any CIs on the numbers. I can only work with the data I have. So sue me.
Next, you say “neither Mr Pollock nor [Monckton] was asserting that it was physically impossible to exceed the Pollock limit.”
In fact, Monckton said EXACTLY that, and then he had to backtrack and did so very poorly. This is from his second post:
That is not a “corollary” in any sense of the word. That’s a totally different claim that he is making in a pathetic attempt to fix his foolish error. And if that was his meaning, yes, he DID need to state it. He made a claim he couldn’t back up, and then, in his second post, he’s trying to put peanut butter over the giant crack in his claim in the hopes no one will notice.
Finally, Ireland only down-dispatches about 11% of wind generation, but they’re 22.5% above the supposed “fundamental limit”. Go figure …
w.
w. ==> I gave up trying to reason with you long ago, Mr. Eschenbach. Chris Monckton should have too after the first exchange.
I gave clear, referenced answers to the points you raised.
I see you don’t like my answers, so you’re running for the door. Run away all you want, Kip, doesn’t bother me.
w.
Mr. Hansen has written a number of guest posts about things I thought and still think he knows more than I do, so I provisionally accepted what he wrote. But words have meanings, and so does math, and I’m now reconsidering in light of his above-betrayed inability to comprehend what Lord Monckton clearly wrote and to draw the conclusions logically to be inferred from it.
Is the Pollock limit particularly meaningful when any amount of installed wind capacity can result in zero or close to zero power when the wind doesn’t blow? And what is the value anyway of variable and intermittent energy as compared to reliable and dispatchable energy?
A more important calculation is surely the overbuild necessary for intermittent wind energy to provide a guaranteed amount of dispatchable/reliable power, such as by using hydrogen as a store of energy:
Electrolysis to produce hydrogen from excess wind power -> stored, compressed hydrogen gas -> electricity from standard generators as and when required (viz when the wind drops).
The calculation is as follows :
Suppose we want P GW of power to be “dispatchable”, meaning always available “on demand”.
Let us start with P GW of installed wind turbine power and calculate the extra installed capacity required to produce P GW of dispatchable power.
Now the capacity factor of offshore wind turbines is 33% (onshore is less), so the average amount of power over a year supplied by a wind turbine is 0.33P GW and consequently we will require 0.67P GW of storage.
The efficiencies are :
Electrolysis : 60%
Compression : 87%
Electricity generation : 60%
So overall efficiency = 60% x 87% x 60% = 31%
So the amount of excess power required to produce the missing 0.67P GW is 0.67P/0.31 = 2.16P GW.
Since the capacity factor is 33%, this means we will need 2.16P/0.33 = 6.55P GW of additional installed wind power to provide the needed 0.67P GW of dispatchable power.
Hence a total of P GW + 6.55P GW = 7.5P GW of installed wind turbine capacity is required to provide P GW of dispatchable power.
Note : Any reductions in efficiency or losses will result in the figure of 7.5 being even higher of course.
This makes wind power very expensive unless the customers can (be made to) accept intermittency…..
Suggest the answer lies in when and where the turbines stop producing. If one area fails, while another is 100% producing, can the 50% drop in local faceplate production equal 25% drop in deliverables while the fridge is still fully functional?
I’m having trouble visualizing the math here …
Methinks the error in the Pollock Limit is an assumption that renewables all drop to zero for the average %l oss of faceplate time.
Or is it this: could the reduction in generation occur during reduction in consumption such that one cancels out the other?
If a 50% drop in both occurs at the same time, the grid will remain operational as if nothing happened.
So the change in volume of renewables provuded has to be plotted against the change in demand. You don’t need 35% of electricity when demand drops 25% but you have 10% additional emergency if short-term backup.
Willis – I greatly appreciate your well presented articles. However, it seems to me using penetration numbers compared to capacity factors for interconnected countries does not disprove the proposed Pollock Limit, Effectively, interconnections relieve both the need for electricity storage and backup generating capacity in the short term for the presently over achieving countries. If as proposed, all countries convert to wind and solar, these constraints will drive all systems toward the Pollock limit absent an affordable, effective means of storing electricity. I can not find any reported interconnections for the Falkland Islands, so perhaps their values are encouraging. Penetration is high but I suspect so is the capacity factor (I have been unable to locate any) since wind resources there are reported as some of the most consistent on earth. I agree with Francis Merton, somewhere on earth build or present a demonstration that achieves adequate and reliable supply comparable to what exists now without fossil fuel, hydro or nuclear backup. That should be easy-peasy since wind and solar are so cheap.