By Christopher Monckton of Brenchley
The New Pause has shortened by a month to 6 years 8 months on the UAH data, but has lengthened by a month to 7 years 7 months on the HadCRUT4 dataset.


I visited Glasgow during the latest bout of UN-sponsored hand-wringing, where such inconvenient truths as the absence of global warming for six or seven years were not on the menu. Mere facts were, as usual, generally absent from the discussions.
I gave two hour-long talks at the Heartland side-event – one on climate science and the other on economics and policy. They are available at heartland.org. As always, if anyone would like a copy of the slide-decks just write to monckton{at}mail.com.
A single slide on the economics of net-zero emissions by 2050 summarizes just how pointless the climate panic is: for even if there were to be large warming (rather than none for the best part of a decade), and even if that warming were potentially harmful (rather than actually net-beneficial), the trillions spent on attempting to abate it would make practically no difference to global temperature.
No government that has committed itself to the trashing of its economy in the name of Saving The Planet has done the very simple calculations that are necessary to establish the abject futility of attempting to tell the weather how to behave. Let us repeat them:

The British hosts of the conference – particularly Boris Johnson, described as a “Prime Minister”, have proven themselves to be even more scientifically and economically illiterate than most. If Britain were to go in a straight line from today to net-zero emissions by 2050, the cost, according to the grid authority, would be a staggering $4.2 trillion.
Yet, even on IPCC’s own current midrange estimate that getting on for 4 W m–2 warming in response to doubled CO2 would eventually warm the world by 3 K, the British taxpayers’ $4.2 trillion (the grid authority’s deeply conservative estimate) would buy an abatement of just 1/220 K of global warming by 2050. So negligible an effect cannot be measured by modern instruments. Even if it could be, one would first have to determine that a climate warmer than today’s would be net-harmful, which one could only do if one had thought to calculate the ideal global mean surface temperature for life on Earth. But that calculation does not appear to have been done.
If, however, the feedback regime that obtained in 1850 were to obtain today – and there is no strong reason to suppose that it would not obtain today, in an essentially thermostatic system dominated by the Sun, which caused 97% of the reference temperature that year – Britain’s $4.2 trillion would buy not 1/220 K but just 1/550 K abatement. The calculations are not difficult.
Even if the whole West were to gallop to net-zero by 2050 (and it won’t), the warming abated would be 1/8 K if IPCC’s equilibrium-sensitivity estimates are correct and 1/18 K if the 1850 feedback regime is still in effect.
The late Bob Carter once gave a fascinating talk to a Heartland conference, saying that in 2006 the Institute for Public Policy Research – a far-Left front group – had circulated other totalitarian extremist groups with innocuous-sounding names to recommend that, if the Western economies were to be destroyed, “the science” should no longer be discussed.
Instead, the climate Communists should simply adopt the position that The Debate Is Over and Now We Must Act.
However, in the traditional theology of evil it is just at the moment when the bad appears to triumph over the good, the false over the true, that evil collapses. And it often collapses in upon itself because it becomes visibly laughable.
Though coal, oil and gas corporations were not permitted to exhibit at the Glasgow conference (for free speech might bring the house of cards down before the Western economies had been frog-boiled into committing economic hara-kiri), there were many silly manifestations. Top prize for daftness goes to the island of Tuvalu, which, like just about all the coral islands, is failing to disappear beneath the rising waves. As the late and much-missed Niklas Mörner used to say, coral grows to meet the light and, if sea level rises, the corals will simply grow to keep their heads above water.
At the Tuvalu exhibition stand, half a dozen mocked-up polar bears were dressed in bright orange life-vests. Well, Tuvalu is a long way from the North Pole. It appears no more aware than was Al Gore that polar bears are excellent swimmers. They are capable of traveling hundreds of miles without stopping. That is one reason why their population is about seven times what it was in the 1940s.
The Archbishop of Canterbury, who, like just about everyone at the UN conference, knows absolutely nothing about the science or economics of global warming abatement but absolutely everything about the politically-correct stance to take, was wafting about in his black full-length cassock, looking like Darth Vader without his tin hat.
Boaty McBoatface (a.k.a. David Attenborough) bleated that the conference Must Act Now. He has been bleating to that effect ever since his rival environmental specialist, the late David Bellamy, a proper scientist, was dropped by the BBC because he had dared to suggest that global warming might not, after all, prove to be a problem.
However, at last some of the UK’s news media – not, of course, the unspeakable BBC or the avowedly Communist Guardian or Independent – are beginning to mutter at the egregious cost of Government policies piously intended to achieve net-zero emissions by 2050.
The current British Government, though nominally Conservative, is proving to be the most relentlessly totalitarian of recent times. It proposes to ban the sale of new gasoline-powered cars in just eight or nine years’ time, and to require all householders to scrap perfectly good oil and gas central heating systems and install noisy, inefficient ground-source or air-source heat pumps – not a viable proposition in a country as cold as Britain.
It will also become illegal to sell houses not insulated to modern standards. In the Tory shires, policies such as these are going down like a lead balloon.
In the end, it will become impossible for governments to conceal from their increasingly concerned citizens the fact that there has not been and will not be all that much global warming; that for just about all life on Earth, including polar bears, warmer weather would be better than colder; and that the cost of forgetting the lesson of King Canute is unbearably high.
But one happy memory will remain with me. At Glasgow Queen Street station, while waiting for my train to Edinburgh, I sat at the public piano and quietly played the sweetly melodious last piece ever written by Schubert. As the final, plangent note died away, the hundreds of people on the station forecourt burst into applause. I had not expected that Schubert’s music would thus spontaneously inspire today’s generation, just as those who imagine that the evil they espouse has at last triumphed will discover – and sooner than one might think – that it has failed again, as it always must and it always will.
Another wave of cold water reaches the central Pacific with the Peruvian Current.
In October, due to circulation, the highest troposphere anomaly occurred in northeastern Canada.
The North Pacific heat spot is associated with a stationary high. Similarly, the influence of surface insolation is seen in India and Africa.
Very good article Lord Monckton. We must always hope and believe that good will triumph over evil.
My sentiments, exactly!
There is an apparent decrease in the latitudinal velocity of the jet stream since 1999, which can be linked to a decrease in solar activity.

It is perfectly clear to me that the circulation in high latitudes responds very quickly to changes in solar wind speed (solar magnetic field).
Don’t think this is right. They are after all used in Scandinavia. There is a difference between ground source and air source. Its probably true that when it gets very cold, air source becomes vanishingly inefficient. There is just not that much heat in the outside air to be extracted.
Ground source on the other hand will continue to work because the ground remains at a relatively constant temperature if you go deep enough.
The problem with ground source however is that it takes 100s of feet of trenches to be filled with the piping. Its not possible in cities. And if the ground is subject to a high water table, as in much of East Anglia, the trenches will freeze solid, so the heat transfer will not work, and you’ll just have made permafrost at great expense. I think vertical wells to install the piping are also possible, but are very expensive to drill, unserviceable once installed, and much less predictable.
The real objection to the Government’s heat pump plans isn’t so much that they will not work. They will be almost all air source. Though they will work, the colder it gets the worse they will work, so in the occasional very cold winters in the UK, the more you need them the less they will contribute. All the same, given a program of heavy insulation and reinstallation of piping and radiators to large dimensions, it would be possible to heat the country using them.
The objections are
The whole project is impossible to the point of insanity, and its internally inconsistent.
Perhaps the last word on the grid strategy was spoken by the author of ‘Renewable Energy without the Hot Air’. The late and much-missed McKay said that to convert to wind and solar, and he was speaking of current demand, not the far greater additional demand of EVs and heat pumps, you would have to convert the Lake District and Wales pretty much in their entirety into pumped storage reservoirs.
And that the end of the day, after doing all this, you will have reduced global emissions by less than one percent. At the price of huge disruptions of the economy and of the way people live, work, play and shop, greatly reduced mobility and raised cost of living. China and India will more than make up the reduction in about a month of their increased fossil fuel uses.
Both UK political parties, no all three of them, have gone completely mad. They have lost all ability or wish to reason clearly and consequentially. They are basically legislating fantasies, fantasies which are not only unachievable, but which are also internally contradictory. Its a recipe for the rise of some new UKIP led by some new Farage. It is going to happen when the true madness becomes apparent to the electorate.
The problem is that as soon as you turn on a ground sourced heat pump, the ground starts to cool off.
As a result, the size of your collector is determined by the rate at which heat is coming up from deeper soils. Some soils transmit heat better than do others. Also if there is a magma chamber not too deep, there will be more heat available.
Additionally, you can’t place these collectors too close to each other, otherwise they start cannibalizing heat from each other.
If you’ve built your home 100m above a magma chamber, how to heat your home should be the least of your problems!
A thoroughly rousing speech here at
COP26 Climate Reality Forum, Day 1 at 94minutes :
https://youtu.be/R7p1O6aYlnE?t=5619
“Your Royal Highness now listen to this, you need to pay attention for once because I have warned you privately, and I warn you publicly that it is the constitutional obligation of a future constitutional monarch to remain absolutely silent on all matters of politics, and you may think, as Dr. Wilkerson pointed out, that there is such a consensus on all sides, that therefore, that somehow takes it out of politics! Well, let me remind you, for you perhaps have not read any history for some time, in the 1920s and ’30s, one hundred years ago, when all the major parties represented in Parliament—in fact, 425 of the 450 of the Members of Parliament then sitting—were in favor of appeasing Hitler’s Germany. And they were wrong to do so! So, you cannot say that just because there appears to be an albeit manufactured political consensus about global warming, that therefore, you are safe in pronouncing on this matter. If, sir, you wish to be King, then henceforth and for aye, be silent on all political matters, or you will have to resign the throne for yourself and for your heirs and successors forthwith and for all time. We are not prepared to accept a constitutional monarch who does not obey the necessary constraints upon a constitutional monarch. Be silent or go, sir.”
This is available with the youtube transcript also….
Quote:”If Britain were to go in a straight line from today to net-zero emissions by 2050″
Haha, sums up my (mis) adventure this morning – in fact – Complete Zero sums it up
There is a road in England called the A47 – it goes roughly from Leicester to Norwich (of UEA infamy) and on to Gt Yarmouth (Norfolk Broads) from where can be seen majestic flocks of ocean going windmills out in the North Sea.
The Complete Zero was to be found on the A47 (single carriageway section) just south of Wisbech where a southbound electric SUV had simply switched off and bolted itself to the centre of the southbound lane.
Nobody or nothing could push it, pull it or drag it out of the way. A big white shiny 2 tonne+ plus roadblock. (The sort of car that English ‘estate agents’ drive – Posh Spice used to have one similar)
A 4 mile queue of traffic waited patiently on either side as a lone plod attempted ‘points duty’ to keep things moving. Boy, did he look pissed off or what? His poxy little patrol car could sat nicely on the back seat of The Beast
From everyone in that jam: Thank you Boris
UAH is a multiply adjusted proxy rendition of tropospheric temperatures, which disagrees with other observations like RSS of the same atmospheric temperatures.
It is run by people who are predisposed to the idea that climate change isn’t as the consensus believes it to be.
In short, on its own it isn’t in any way a reliable indicator of climate trends
La Niña will not allow the temperature to rise.
ren
Typical nonsense.
If you start a plot with the highest value of a time series, your trend inevitable will be negative.
Moreover: what does that have to do with the current La Nina?
Bindidon typical nonsense.

As for La Niña, I advise you to look at the end of the chart.
Live by ENSO, die by ENSO. If one is using a relatively short period ending on a Super El Nino to predict climate disasters, one should not claim foul when somebody counters with a relatively short period beginning with a Super El Nino.
RSS is a multiply adjusted proxy rendition of tropospheric temperatures, which disagrees with other observations like UAH and balloon radiosondes of the same atmospheric temperatures.
It is run by people who are self proclaimed climate alarmists who are predisposed to the idea that climate change isn’t as science and reality says it is.
In short, it isn’t in any way a reliable indicator of climate trends
RATPAC 850-500mb is +0.210 C/decade
RSS is +0.214 C/decade
UAH is +0.135 C/decade
RSS is a better match to RATPAC balloon radiosondes.
UAH is the satellite temperature record with the best agreement with radiosondes.
https://www.drroyspencer.com/2019/04/uah-rss-noaa-uw-which-satellite-dataset-should-we-believe/
According to the link I posted, the “Ratpac radiosonde data shows spurious warming when compared to the average of 7 other radiosonde and reanalysis datasets for TLT”.
So says UAH using IGRA which has this statement on their website.
“IGRA can be used as input to air pollution models, for studies of the detailed vertical structure of the troposphere and lower stratosphere, for assessing the atmospheric conditions during a particular meteorological event, and for many other analyses and operational applications. NCEI scientists have applied a comprehensive set of quality control procedures to the data to remove gross errors. However, the data may still include jumps and other discontinuities caused by changes in instrumentation, observing practice, or station location. Users studying long-term trends may prefer to use the NOAA Radiosonde Atmospheric Temperature Products for Assessing Climate (RATPAC) or one of the available non-NOAA IGRA-derived, homogeneity-adjusted radiosonde datasets.“
The IGRA scientists advise the use of RATPAC for assessing long term trends.
Please provide a link showing that the ratpac radiosonde data have been corrected to remove the spurious warming.
What spurious warming?
You obviously haven’t read the link that I provided.
I read it the day after Dr. Spencer made that post. I also read the paper. That’s how I know that of all the dataset being compared in the publication RATPAC is tied for the second lowest trend with their own adjusted version of IGRA. The lowest trend being the unadjusted IGRA data. The publication is also myopically focused on the 20S – 20N region which only accounts for 35% of the global surface area and omits the remaining 65% where most of the RSS and UAH disagreement is.
You still haven’t provided a link showing that the ratpac radiosonde data have been corrected to remove the spurious warming. In case you don’t realise what I am talking about, it is the later addition to the article which John Christy provided.
That’s because I don’t have a link. I don’t even have independent evidence that there is spurious warming at all. All we have is Dr. Spencer’s graph on his blog which has never been reviewed to see if it has egregious mistakes and isn’t consistent with the Christy et al. 2018 publication. If you can post a peer reviewed publication that says there is a bias in the RATPAC warning trend I would love to review it.
I think that I will go with the word of John Christy rather than that of an anonymous troll.
You shouldn’t go with a single person’s word. In fact, you shouldn’t go with the word of anyone really. Instead you should go with what the abundance of evidence that has been presented by these people. If the abundance of evidence says RATPAC has spurious warming then so be it. Let’s get it adjusted so that it no longer has spurious warming and then we’ll use that instead.
The problem is that your history of anonymous posts on WUWT does not inspire any confidence in your credibility or competence in any field of science. I now assume that you are lying until proven otherwise.
My name is Brian Gideon which I’ve mentioned on this blog before. I use the bdgwx handle because that’s what I’ve used on various weather forums for the last 2 decades.
These averages are meaningless.
If global mean temperatures are meaningless to you then Monckton’s pause, the blog post in general, and perhaps even the WUWT site itself is probably going to be meaningless to you as well.
What a good point!
Just like bellman, you’ve missed the point entirely.
The global average is meaningless to plants, animals, and all living creatures. The only relative meaning is for us to ponder what meaning if any there is in the changes we see.
Bill Toland
” … which disagrees with other observations like UAH and balloon radiosondes of the same atmospheric temperatures. ”
My point is not to agree with the commenter you replied to.
But what you write about radiosondes allegedly agreeing with UAH: that’s really a bad joke.
The agreement between UAH LT and radiosondes is limited to a minuscule subset of the latter: RATPAC (85 of over 1,500 IGRA stations).
The RATPAC subset has been highly homogenized following a technique developed over a decade ago at Vienna university in Austria, based on… satellite data.
Some years before, John Christy himself published in 2006 a paper about the calibration of 31 – US controlled, hum hum 🙂 – radiosondes using his own satellite data.
Here is a graph I made years ago, comparing at 500 hPa
Thus, when comparing all radiosondes with UAH (this time at 700 hPa), you very certainly won’t obtain anything like this
Translation, only those who have fully bought into the narrative are to believed.
All others are pagans who must be ignored.
I’m still waiting for some evidence for this so called consensus that is capable of withstanding even mild scrutiny.
Again, global average temperature, of whichever ilk, are NOT climate and cannot show the Holy Trends.
People who are “predisposed” to considering alternative “beliefs” ?!?
Well … [ splutter ] … “we” definitely can’t allow that sort of thing !
Hopefully La Niña will send the UK a very very cold winter and people just might wake up to the absurdly of quickly going fossil fuel free in a country at the same latitude as Canada.
The past doesn’t change. The ‘fact’ that a pause got shorter is evidence that someone is changing the past.
These official records of the past are not records at all, but are changing. Therefore, they are false.
Or that the pause is based a meaningless statistical technique involving looking for a new start each month in order to find the longest possible “pause”. The data doesn’t nbeed to change, the start date changes to reflect the additional data at the end.
Who cares? Global average temperature is a meaningless number.
I’m not the one starting an article, using meaningless global average temperatures to claim there has been a pause of exactly 6 years and 8 months.
Methinks the Bellhop he doth whine too much. Could it be that he fears an inexorable lengthening of the New Pause, contrary to the Party Line?
Considering that he has predicted that the pause will lengthen I don’t think that is what he fears. I don’t know who the “Party Line” is. If we polled most scientists I think most would agree that the Monckton pause will length so I’m guessing the “Party Line” is not predominantly scientists. Personally I too think the pause will lengthen given the expected La Nina this winter. My biggest fear is that it doesn’t lengthen because that would mean my prediction was wrong.
Why would I fear a lengthening pause? If the pause represented an actual stop to warming, surely that would be a good thing. Are you frightened by the fact that UAH shows warming of nearly 0.40°C / decade since December 2010, a period of 10 years and 10 months? Or do you understand why that’s just as meaningless a statistic as your pause?
I expect the “pause” will continue to lengthen over the next few months, or longer. The coming La Niña will be the cause. I find it amusing how many here keep predicting this and don;t seem to realize that it’s because they can predict it, that it is not a disprove of AGW.
The other amusing thing this last week, is that as UAH showed a higher than recent value for October, we now have so many people trying to throw UAH under the bus, insisting that it’s not fit for purpose, that the monthly values have an uncertainty of at least 0.7°C, and that any trend derived from it is worthless and dishonest.
It would be useful if for once, rather than attacking me you could address Carlo, Monte’s point; do you consider the global average temperature a meaningless number?
Don’t whine.
Good comeback, but you missed the bit where you say if you agree or don’t agree with the trend for the last 10 years and 10 months.
Just for the record, I have never belonged to a party in my life – rarely get invited to them either.
I hold Boris Johnson in the same contempt as you do, and have for years.
All I can say at this point is:
WHOOOOOOOSH.
That’s pretty much all you ever say. Wake me up when you feel like saying something relevant.
I’ve attempted to enlighten you previously to no avail, so why type again?
Good idea, if I were you I’d stop typing.
But have you considered there may be an audience out there besides me. Maybe they see you saying global average temperature is a meaningless number and wonder if that applies to Monckton’s pause. Maybe they want to believe the pause is real and hope you can assure them it is.
Here, straight from the author:
https://wattsupwiththat.com/2021/11/09/as-the-elite-posture-and-gibber-the-new-pause-shortens-by-a-month/#comment-3385545
Jim Gorman has told you many, many times why a GAT is meaningless; in short, a tremendous amount of information is thrown away and ignored.
Then something else to think about: go into your nearest Home Depot/Lowe’s/DIY store armed with a tape, and measure the length of every piece of wood inside the entire store, including those broken in shipping and remnants of custom cuttings. Average the lengths and tell everyone what the result means.
And return to this uncomfortable datum, the histogram for a single month of one-minute data (not the watered-down Tmax-Tmin data used by the Averagers) from a single site, with the decidedly non-normal distribution of temperatures — what is the meaning of the 7.4°C standard deviation and 42°C range?
Yes I found the actual quote, it’s talking about ENSO adjusted data. But as we are talking about how uncertain the data is, and as you seem to think that uncertainty affects the trend estimate, how do you compare your very uncertain trend against a model? If the trend is that uncertain you are much more likely to see deviations between the trend and the models, even if the models are spot on.
Again, you make the same mistake as TG in claiming that a global average is meaningless, just because it doesn’t tell you everything. Summarizing data is useful, it’s useful if you want to see if anything is changing over time for example, and it’s useful if you want to see if there’s been a slow down in warming or even a pause. And you do not ignore all other information. I never understand why you lot think that. Just because you have a global average does not mean you cannot look at the data in more detail – see how different regions or seasons are changing for example.
Another of your famous strawmen.
No. Again you go back to confusing error with uncertainty.
I’m not confusing anything. We established last time that it’s possible to conceptualize “uncertainty” sans error, but the results are the same. If the trend is more uncertain are you going to see bigger or smaller deviations from reality? It doesn’t mater if you see the uncertainty as a description of the range of errors, or as fuzzy measurements, the results will be the same.
“Again, you make the same mistake as TG in claiming that a global average is meaningless, just because it doesn’t tell you everything. ”
Really? “it doesn’t tell you everything”. HA, IT DOESN’T TELL YOU ANYTHING! Every mean, even that of two numbers, has a standard deviation. To HAVE ANY MEANING AT ALL there must be a standard deviation. You are trying to justify a grade school level of finding a mean as a valid statistical analysis. You got the data, Office, Libre, Sheets can all give you a standard deviation.
What on earth makes you think I don’t know what a standard deviation is?
Aside from anything else, you need to know the standard deviation to determine the standard error of the mean, which has been what caused this whole imbroglio in the first place.
Continued.
And here you go again wanting me to measure bits of wood. Just because you can get meaningless averages,, does not mean all averages are meaningless.
You keep asking me these context free questions about the standard deviation of a monthly set of data. What do you want to know about them? Any statistical text book will explain how to calculate the standard deviation. It’s meaning is that it’s a measure of the dispersion of data. The meaning of the range is that it’s the difference between the hottest and coldest measurement over the month. If you think there’s some deeper meaning that I’m not telling you about, why don;t you tell me what it is rather than going through these pointless riddles?
In the mean time, could you explain what you mean when you say the uncertainty of the mean temperature would be at least 7.4°C?
Context free? Averaging temperature time-series is how these plots are generated!
You have absolutely no reference for how data is generated in the real world.
Oh no, don’t run away again—what does this s.d. mean to YOU?
“Oh no, don’t run away again—what does this s.d. mean to YOU?”
I’ve really no idea what you want me to say or why you are so obsessed with this.
I don’t have any emotional connection to the standard deviation of this one site in an unspecified month. The standard deviation is the square root of the variance. It’s in indication of the overall dispersion of temperatures in this month at this site. Judging from the graph it means most of the time during the month temperatures were between -5.0 and +9.8°C. If it was a normal distribution you could say 68% of the measurements were between those values. I’d estimate from the graph it might be a higher proportion. Without knowing the location or the month I couldn’t tell you if this was hotter, colder, or more variable than usual.
What it does not mean to me, is that the actual mean temperature could really be -5.0 or +9.8. If that’s what you want me to tell you, you’re going to have a long angry wait.
So you don’t think a standard deviation that is that large would have a large effect on anomaly uncertainty?
Guess again!
These aren’t anomalies. The size of standard deviation affects the size of the standard error of the mean. If these were random samples you could divide the standard deviation by the square root of the sample size to get the SEM. With this number of samples that’s about 200, so the SEM would be 0.04°C.
But as I keep trying to explain to you, these are not random samples, it’s a univariate time series, and given the sample rate I would expect the uncertainty of the mean to be much lower, but it would still be scaled by the standard deviation.
But as i also said, the bigger problem in this case would be the uncertainty in the measurements. If these were all independent they would be even less than that caused by the sampling, but I suspect they wouldn’t be independent.
In no case can I see how the uncertainty of the mean can be, as Carlo claims, at least as big as the standard deviation.
Do you believe that:
SEM = SD / √N (where N = sample size)
Are people finding mean of the values?
Are they using samples or an entire population?
If samples then you should be multiplying by the √N not dividing.
If a population why are you finding an interval where the mean of sample means would lie (SEM)? Finding the true mean is rather straight forward.
Perhaps this web site will provide you some information on univariate time series. I don’t recall ever seeing you address the issues or do the math to perform a correct univariate time series analysis.
https://www.itl.nist.gov/div898/handbook/pmc/section4/pmc442.htm
You’ll notice that a frequency analysis is recommended as I have proposed multiple times on this site and specifically to you. Performing what is basically grade school averaging without any concern about uncertainty in measurements or standard deviations is not doing scientific analysis.
“Do you believe that:
SEM = SD / √N (where N = sample size)”
That’s the standard formula for SEM, for random independent samples. As I keep saying, that is not the case when taking a measure every minute.
“Are people finding mean of the values?
Are they using samples or an entire population?”
These are samples, but not random.
“If samples then you should be multiplying by the √N not dividing.”
Why? You and Tim have been saying this since the start of the argument with no explanation. Multiplying by √N will give you the standard error of the sum of the values, not the average. In this case multiplying by √N is going to give you a value of around ±1500°C. Do you really thin this is the uncertainty of the monthly average? would you feel the average would be more certain if you reduced the measurements to hourly? Or just a single measurement?
“If a population why are you finding an interval where the mean of sample means would lie (SEM)? Finding the true mean is rather straight forward.”
In this case you are not exactly taking a population. Temperature changes area continuous function, but it is pretty close assuming there are no big changes in temperature in a minute.
However, that does not mean the average is exact because of the measurement uncertainties.
“Perhaps this web site will provide you some information on univariate time series”
Irrelevant in this example. We are not trying to analyze the time series, just determine the mean temperature over the month.
And exactly what are you measuring every minute? Why does this formula only apply to random independent samples? Why are temp measurements from different stations not random and independent samples? Random implies Gaussian. Sampling can be used on any populations distribution to develop a normal sample means distribution. Did you not follow my link to the website that lets you input any distribution you like by using your mouse? Here it is again.
Sampling Distributions (onlinestatbook.com)
“Irrelevant in this example. We are not trying to analyze the time series, just determine the mean temperature over the month.”
You didn’t read the site at all did you?
“Another approach, commonly used in scientific and engineering applications, is to analyze the series in the frequency domain. “
“The term “univariate time series” refers to a time series that consists of single (scalar) observations recorded sequentially over equal time increments.”
Temperature is based on frequency from daily temps to monthly temps to seasonal and all kinds of varied oscillations. Trying to find a mean of a time varying trig function is meaningless. You don’t even know if the data you are using in your linear regressions is stationary. You yourself admit this when you call temps a continuous function.
I will tell you. Find the standard deviation of the full temperature over some period of time. Then find the standard deviation of a station at winter and one in summer after combining the full temps. That is what anomalies hide!
Really, you think that’s the point he’s trying to make!? It’s hotter in summer than in winter? Does anyone seriously think that an anomaly of +1°C in July is the same as +1°C in December?
This is even closer to a normal distribution than many min/max distribution.
Look at the image I have attached for several cities around the U.S. Nothing normal about any of them except Santa Barbara that is next to the ocean. You can see the standard deviations are huge. That says that the mean has limited use for describing the distribution.
THAT is why the GAT is worthless. Keep asking folks for the Standard Deviation of the GAT. That is the only way to know how the mean describes the data.
Right! I haven’t done this site for a whole year but I suspect it would be just as strange as any of these. Bellman refuses to answer what these large variances mean.
Here is the whole year for this station (above Golden CO, 1-min data), it is almost trapezoidal without any strong peaks. It turns out there are three separate Vaisala temperature measurements recorded at the site, within 30-50 meters of each other. Accuracy specs are ±0.5°C (+10 to +30°C) and ±0.6°C outside of this range.
https://www.vaisala.com/sites/default/files/documents/HMP60-Datasheet-B210851EN.pdf
I averaged the three measurements to get a single value for each minute, and rejected points when the standard deviation was greater than 3°C. This removed several hundred points. Here is the distribution of the standard deviations:
“Average the lengths and tell everyone what the result means.”
He can’t tell you. He’ll just change the subject. He has a problem differentiating between multiple measurements of the same thing and multiple measurements of different things. He’s got a statistical hammer and everything is a nail even if its a screw!
It’s a meaningless exercise. Why do you want to find the average length of every piece of wood, including broken pieces, in a store? Why should I tell you why you want it, it’s Carlo’s exercise.
If you were to open your mind a little, you might see that it is very much like making a global temperature average.
It’s a direct analog for the temperature data around the globe. High temps (long boards), low temps (short boards), and medium temps (in-between boards). If it is a meaningless exercise for the boards at Home Depot then it is a meaningless exercise for trying to define a global average temperature.
And what are “those broken in shipping and remnants of custom cuttings” in this analogy?
Part of the population of boards. There is no reason to eliminate them from the population. They are *still* boards, they may not have square ends (which btw increases the uncertainty of any measurement)
I’m asking how they are analogous to temperatures. Where are the temperatures that are remnants of customer cuttings and broken in shipping.
So you require a 1000% analogy before you might consider that your thinking is wrong?
What do you get when you average Miami with Terra del Fuego?
1000%?
No, I just want the analogy to have some relevance to the thing it’s being compared to. I want to avoid the fallacy of argument by false analogy.
There are reasons people want to know what the average global temperature is, one of them mentioned in this head post (remember the pause?). If you could come up with a reasonable hypothesis you want to test with the length of pieces of wood in a store, maybe we could see if your statistic was useful for the purpose.
The analogy in this case is not false.
If people want to know the global average temperature then they need to come up with a way to determine it that doesn’t violate metrology rules.
The analogy of combining all the boards in a store is *exactly* what is happening with the determination of a GAT today. If the average of all the boards is meaningless and useless then so is the GAT as it is formulated today.
The problem is that you can not take an average of either anomalies or actual temps and discern anything from the average. You are averaging summer and winter, spring and fall, 90° vs 0°. The average is no more meaningful than that average heights of a herd of Clydesdales and Sheland ponies.
A mean implies an implicit range of members, i.e., a variance. Tell what the variance or standard deviation of the GAT is both for the anomalies and actual temps used to derive the anomalies. Better yet tell us the regions below the means and those above the mean and their values.
If you can’t do that then your “statistical analysis” is worthless.
Yet you are quite happy to use these meaningless averages to claim that there has been no warming over the last 6 years, and to deduce that CO2 does not cause warming.
If CO2 is well mixed and is the temperature control knob then the entire globe should see the same trend in temperatures. Yet we know that isn’t the case.
So is CO2 not well mixed? Or is CO2 not the temperature control knob? You pick. You are going to make someone mad whichever you choose.
(my guess is that you won’t answer or won’t pick)
TG said: “If CO2 is well mixed and is the temperature control knob then the entire globe should see the same trend in temperatures.”
It’s not the control knob; only a control knob.
Be careful. You will be accused of heresy by the AGW alarmists!
Rubbish. Nobody has ever said that everywhere on the globe will follow the same trend.
How many studies do I need to post from coral reefs, to wildfires, to glaciers melting, to insects dying, to birds changing that all use the GAT as the reason? None, and I repeat, NONE show what the local temps have done. They all simply reference the Global Average Temperature increase as the reason.
If that isn’t evidence that scientists have been brainwashed to believe that everywhere has rising temps then I don’t know what is.
Please tell me how many studies you would like posted to verify that.
Post as many as you want. It won’t prove the claim being made that CO2 warming is predicted to cause the same trend in warming everywhere.
So you ARE making predictions from your trend charts.
Finally a little truth emerges.
“Rubbish. Nobody has ever said that everywhere on the globe will follow the same trend.”
Really? India is supposed to see widespread starvation from global warming. Polar bears are supposed to die off. The central plains are supposed to be destroyed by more tornados. The Artic and Antarctic are supposed to become ice-free because of global warming. The Middle East is supposed to all migrate to Europe because of increased desertification. Central America migration is because of crop failures due to global warming. Argentina and Brazil are supposed to have crop failures and are supposed to lose all kinds of livestock because of global warming.
Sure sounds to me like everywhere on the globe will follow the same trend – the earth turning into a cinder!
Apparently you continue to have problems reading.
What do you think the comment about higher uncertainty meant?
Some temp stations have higher uncertainty than others in its measurement values, just like a broken board has a higher uncertainty associated with its length.
You *really* don’t have much experience with physical reality, do you?
The different uncertainties are not the problem. In fact there wasn’t even any mention of the uncertainties in the measurements, it’s about what the average of the lengths of wood tell us. (still if you do want to use this as an anology you might like to consider how much of an effect the uncertainty on measuring has on the average).
The problem is in why you want this average, what you think it will tell you about the wood situation in the store. I could just about see why you might want to know the average of your stock, though I expect knowing the total amount of wood is more useful, but why would you want to include broken pieces and off-cuts. Not only are they not going to be sold, but they will affect the average in meaningless ways.
This stems from the other main problem with this analogy – wood is not like temperature in that you cannot sub-dived temperatures. I can cut a 2m piece of wood in half to get 2 1m lengths, and that will change the average. I cannot take one station with a temperature of 20, and divide it into 2 stations with a temperature of 10 each.
“still if you do want to use this as an anology you might like to consider how much of an effect the uncertainty on measuring has on the average).”
All you need to know is the same tape measure was used. Call the uncertainty “u”.
“The problem is in why you want this average, what you think it will tell you about the wood situation in the store.”
Just about the same as the GAT tells me about the global temperature.
“wood is not like temperature in that you cannot sub-dived temperatures.”
Are you in the habit of walking into a store and cutting up their stock?
Show us a model that has pauses of substantial length. Your criticisms would also apply to them.
You asked me that before, and I pointed out that models do not have to show every piece of variance to be useful. You only have to look at past data to see how often in the real world you get sharply downward trends of 6 or 7 years, and how even faster warming rates are observed over similar time periods.
That said, I’m sure current models do show random variation, but I haven’t looked at any in detail. Lord Monckton keeps inaccurately quoting a NOAA summary which said models sometimes show ten or so years with no warming, so I assume models do show some variance.I suspect the problem is that model output is often shown as an average of multiple models, which inevitably smooth out the variations.
The hapless Bellman is too committed to climate Communism to be concerned with mere facts. The NOAA State of the Climate Report in 2008 said that 15 years with no warming would indicate that the models were wrong. In the end there were almost 19 years with no warming. The models are wrong, on NOAA’s own yardstick. If Bellman doesn’t like it, let him take it up with NOAA. No point in blubbing here.
As always an exact quote or preferably a link would be helpful. Did they say 15 years would indicate the models were wrong, or did they say “at least 15 years’ data are needed to establish a reasonably reliable trend.” as you claimed here.
Bellman:
As usual the great snake-oil salesman is lying.
There is no mention of ….
“15 years with no warming would indicate that the models were wrong” in the NOAA State of the climate reports.
As indeed there wouldn’t be, as the NOAA State of the climate reports are just that – a statement of the climate.
Facts regarding the weather that year/month.
He says stuff that the faithful buy without any scepticism whatever.
And he never answers a question put to him by his critics.
It’s just his MO.
Obfuscation via verbiage usually.
Or else the resort to ad hom – usually centred around childish versions on the person’s name or assertions about being a “socialist/communist” or the oh so clever, “don’t whine”.
It is of course not big or clever – just down the rabbit-hole bizarre.
But they queue up to by the latest recipe of said snake-oil every time.
And here is the NOAA State of the Climate Report 2008 ….
https://www.ncdc.noaa.gov/sotc/global/200813
I’ve given the link below for the State of the Climate report Monckton is, I think, referring to. It’s a 200 page document published in the AMS.
This does say “The simulations rule out (at the 95% level) zero trends for intervals of 15 yr or more, suggesting that an observed absence of warming of this duration is needed to create a discrepancy with the expected present-day warming rate.”
But changes the “is needed to” to “will”, as I kept suggesting to him, it’s a necessary not a sufficient condition, and possibly more importantly NOAA are talking about ENSO-adjusted trends. Also they are only talking about surface data, and I don;t think any of the surface data has shown a 15 year pause.
Found it.
https://journals.ametsoc.org/configurable/content/journals$002fbams$002f90$002f8$002fbams-90-8-stateoftheclimate.xml?t:ac=journals%24002fbams%24002f90%24002f8%24002fbams-90-8-stateoftheclimate.xml
The relevant quote is on page 25
I think the word “ENSO-adjusted” might be relevant here.
Now you sound like Nitpick Nick.
You are claiming NOAA said a 15 year “pause” would indicate a problem with the models, and are using a 15+ year pause generated by ENSO conditions, and fail to mention that NOAA were talking about ENSO-adjusted “pauses”. Some nitpick.
It hasn’t warmed for 80 years.
It has oscillated.
You’ve never looked at an IPCC spaghetti graph? I find this hard to believe.
Yes I’ve seen spaghetti graphs of model output. That’s why I think Jim is wrong to claim that no model shows 6 or 7 year pauses. I haven’t gone through any model to check that there are pauses, but the shear variability suggests there probably are. That and Monckton’s favorite quote from NOAA about how you can find 10 year pauses in the models.
You do realize that the models are reset periodically during a run so that long term pauses are not possible. In other words they don’t show real predictions.
So, when NOAA say “The simulations rule out (at the 95% level) zero trends for intervals of 15 yr or more,” they are wrong to suggest that means a 15 year pause would indicate a discrepancy in the models, because models are programmed to not show long term pauses. Is that the point you are trying to make?
I downloaded model data from the KNMI Explorer and I see a lot of pauses. I’m also not seeing any evidence of a periodic reset either. For example, here is the GFDL-ESM4-ssp370 run which clearly depicts several extended pauses.

If everyone who attended this and prior conferences (excluding Lord Monckton and others like HIM) had their mouths sewn shut, wouldn’t that lower the CO2 volume drastically?
Make them wear rebreather equipment and take before & after readings to find the differences and don’t allow them outside, either. Just an idea, that’s all.
If one could just lock them all in one building and toss the keys into a deep loch, the rest of us will quickly get on with our lives. They are nothing but self-involved money-grubbing dorks and should be sent some place “special” so that the rest of us can get on with our lives. These conferences have become nothing but opportunities for money-grubbing snods to find a way to rule something bigger than they are.
Thanks for the article!
Sara get ready for the cold weather.
We are lucky….
https://breadonthewater.co.za/2021/11/07/is-it-warmer-now-than-it-was-in-the-past/
I just get the impression that in spite of all the usual MSM propaganda, particularly with another COP jet in knees-up around, that it’s getting harder and harder to ignore the reality of the climate changers’ lunar prescriptions. So nukes are back on the menu for politicians-
Nuclear ‘back in vogue’ in ‘net zero-obsessed Europe’ (msn.com)
(which somewhat pulls the rug out from under Macron’s hissy fit that Oz ditched their diesel sub design for an Anglo nuke none)
A wee bit of questioning of the scriptures here with EVs almost bordering on heresy-
Is your electric car as eco-friendly as you thought? (msn.com)
while Volvo fart in polite company-
Volvo Says CO2 Emissions From Making EVs 70% Higher Than Gas Vehicles – Climate Change Dispatch
There’s a few like that bobbing up uncharacteristically.
The Guardian aint happy at all with the way things are going and gets to the Marxist point-
Cop26 is doomed, and the hollow promise of ‘net zero’ is to blame (msn.com)
but the reality is ‘net zero’ is an obvious delusional fantasy for rational grown-ups everywhere and politicians know they have to keep the lights and aircon on or they’re doomed. Hence the rhetoric not matching the realpolitik and rising tension as the penetration of unreliables bites. No more low hanging fruit to be had in that regard.
The SOI index is rising again after a brief decline. Rainfall in eastern Australia. It will not be a hot summer in the southern hemisphere.
Is the science settled? The ozone hole in 2020 and 2021 grows in November and December.
What is happening in the stratosphere to the south?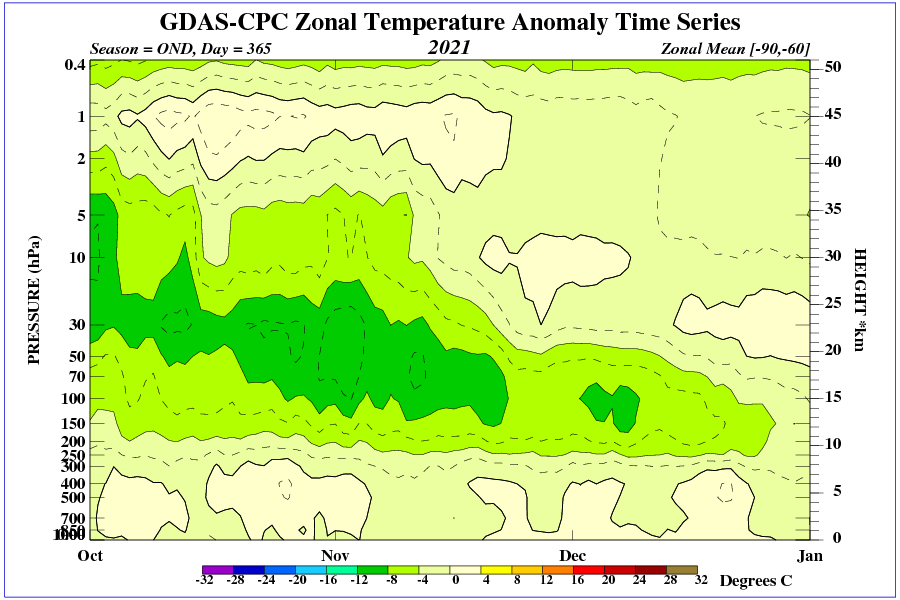
was in D960 in Bb, the last piano sonata he wrote, which is sublime, or some other piece?
In any case, hats off to your pianistical skills
“and install noisy, inefficient ground-source or air-source heat pumps”
Solar powered, of course. Just right for Northern England.
And I still don’t know when the old pause ended and the new one began. It looks as though the old one ended sometime around 2015, and the new one began in 2014. On Wednesday, perhaps.
See my first post under this article, the “Reply to TheFinalNail” one, and the attached graph.
When “pauses” start and end depend on which dataset you are looking at.
For UAH (V6) lower-troposphere (TLT), the original “Pause” (my “Pause 1” below) was from May 1997 to December 2015 [ = “when the old pause ended” ].
As noted on the first graph in the ATL article the current pause (my “Pause 2” below) in UAH now goes from “March 2015 [ “and the new one began” … ] to October 2021″. There is therefore 10 months of overlap between “breaking” the original pause and generating an “anchor” for the new, higher, one.
For the current pause, as long as the UAH data keeps oscillating around the 0.25 level it will keep extending … which would be “boring” … until it gets close to Ben Santer’s 17-year “statistically significant” level, at least …
From the abstract to Santer et al (2011, full title “Separating signal and noise in atmospheric temperature changes: The importance of timescale”) :
If the data “breaks higher”, a new step up will form … which also counts as “boring” in my books … as long as it doesn’t go “exponential / catastrophic warming” on us …
– – – – –
If, however, the data “breaks down“, that could end up in the “interesting” category !
As the average value of “Pause 2” drifts slowly lower, it could, eventually [ e.g. in the second half of the 2020s decade ? ] “merge” with the original pause, giving us a pause nearly 30 years long …
Unfortunately we will all just have to wait and see whether (or not) the rest of the 2020s will count as “interesting times” … for the UAH (V6, TLT) dataset at least.
A zoom-in on “Pause 2”.
Note that while UAH has dipped to the old pause level (0.0) a couple of times (in autumn 2018 and spring 2021) in the last 5 years, it would need to remain considerably lower than that for a (relatively) long period of time for my “interesting” scenario to play out.
While it currently looks like a “(much ?) more likely than not that it will not play out like that” scenario, it’s still an “interesting” one to explore, to me (and CMoB) at least.
My own estimate is that you would need more than 15 years of temperatures at 0.0 before the two pauses would merge. If temperatures were to permanently drop to -0.2°C it would happen in about 4 to 5 years time.
Sounds about right.
For my (completely arbitrary) target date of 2030 I need a “constant level” around -0.05.
This is the new pause; the old pause went back to 2000 and earlier – did that disappear like the medieval warm period. I tell the uninitiated that the surface temperature has been flatlining since 1991; is that an exaggeration?
Certainly not, even Michael mann’s notorious hockey stick showed flatlining for at least a 1000 years before mysteriously rising asymptotically from the X axis so that Al Gore needed a pair of step ladders and very long pointer to demonstrate a simple truth well before CRU found it necessary to start cooking the books.