Research suggests some ice caps grew during past periods of warming
WOODS HOLE OCEANOGRAPHIC INSTITUTION
Woods Hole, Mass. (September 9, 2021) – Greenland may be best known for its enormous continental scale ice sheet that soars up to 3,000 meters above sea level, whose rapid melting is a leading contributor to global sea level rise. But surrounding this massive ice sheet, which covers 79% of the world’s largest island, is Greenland’s rugged coastline dotted with ice capped mountainous peaks. These peripheral glaciers and ice caps are now also undergoing severe melting due to anthropogenic (human-caused) warming. However, climate warming and the loss of these ice caps may not have always gone hand-in-hand.
New collaborative research from the Woods Hole Oceanographic Institution and five partner institutions (University of Arizona, University of Washington, Pennsylvania State University, Desert Research Institute and University of Bergen), published today in Nature Geoscience, reveals that during past periods glaciers and ice caps in coastal west Greenland experienced climate conditions much different than the interior of Greenland. Over the past 2,000 years, these ice caps endured periods of warming during which they grew larger rather than shrinking.
This novel study breaks down the climate history displayed in a core taken from an ice cap off Greenland’s western coast. According to the study’s researchers, while ice core drilling has been ongoing in Greenland since the mid-20th century, coastal ice core studies remain extremely limited, and these new findings are providing a new perspective on climate change compared to what scientists previously understood by using ice cores from the interior portions of the Greenland ice sheet alone.
“Glaciers and ice caps are unique high-resolution repositories of Earth’s climate history, and ice core analysis allows scientists to examine how environmental changes – like shifts in precipitation patterns and global warming – affect rates of snowfall, melting, and in turn influence ice cap growth and retreat,” said Sarah Das, Associate Scientist of Geology and Geophysics at WHOI. “Looking at differences in climate change recorded across several ice core records allows us to compare and contrast the climate history and ice response across different regions of the Arctic.” However, during the course of this study, it also became clear that many of these coastal ice caps are now melting so substantially that these incredible archives are in great peril of disappearing forever.
Due to the challenging nature of studying and accessing these ice caps, this team was the first to do such work, centering their study, which began in 2015, around a core collected from the Nuussuaq Peninsula in Greenland. This single core offers insight into how coastal climate conditions and ice cap changes covaried during the last 2,000 years, due to tracked changes in its chemical composition and the amount of snowfall archived year after year in the core. Through their analysis, investigators found that during periods of past warming, ice caps were growing rather than melting, contradicting what we see in the present day.
“Currently, we know Greenland’s ice caps are melting due to warming, further contributing to sea level rise. But, we have yet to explore how these ice caps have changed in the past due to changes in climate,” said Matthew Osman, postdoctoral research associate at the University of Arizona and a 2019 graduate of the MIT-WHOI Joint program. “The findings of this study were a surprise because we see that there is an ongoing shift in the fundamental response of these ice caps to climate: today, they’re disappearing, but in the past, within small degrees of warming, they actually tended to grow.”
According to Das and Osman, this phenomenon happens because of a “tug-of-war” between what causes an ice cap to grow (increased precipitation) or recede (increased melting) during periods of warming. Today, scientists observe melting rates that are outpacing the rate of annual snowfall atop ice caps. However, in past centuries these ice caps would expand due to increased levels of precipitation brought about by warmer temperatures. The difference between the past and present is the severity of modern anthropogenic warming.
The team gathered this data by drilling through an ice cap on top of one of the higher peaks of the Nuussuaq Peninsula. The entire core, about 140 meters in length, took about a week to retrieve. They then brought the meter-long pieces of core to the National Science Foundation Ice Core Facility in Denver, Colorado, and stored at -20 degrees Celsius. The core pieces were then analyzed by their layers for melt features and trace chemistry at the Desert Research Institute in Reno, Nevada. By looking at different properties of the core’s chemical content, such as parts per billion of lead and sulfur, investigators were able to accurately date the core by combining these measurements with a model of past glacier flow.
“These model estimates of ice cap flow, coupled with the actual ages that we have from this high precision chemistry, help us outline changes in ice cap growth over time. This method provides a new way of understanding past ice cap changes and how that is correlated with climate,” said Das. “Because we’re collecting a climate record from the coast, we’re able to document for the first time that there were these large shifts in temperature, snowfall and melt over the last 2,000 years, showing much more variability than is observed in records from the interior of Greenland,” Das added.
“Our findings should urge researchers to return to these remaining ice caps and collect new climate records while they still exist,” added Osman.
Additional collaborators and institutions:
Benjamin Smith, University of Washington
Luke Trusel, Pennsylvania State University
Joseph McConnell, Desert Research Institute
Nathan Chellman, Desert Research Institute
Monica Arienzo, Desert Research Institute
Harald Sodemann, University of Bergen and Bjerknes Centre for Climate Research, Norway
This research is funded by the National Science Foundation (NSF), with further support from the U.S. Department of Defense National Defense Science and Engineering Graduate Fellowship; and an Ocean Outlook Fellowship to the Bjerknes Centre for Climate Research; the National Infrastructure for High Performance Computing and Data Storage in Norway; Norwegian Research Council; and Air Greenland.
About Woods Hole Oceanographic Institution
The Woods Hole Oceanographic Institution (WHOI) is a private, non-profit organization on Cape Cod, Massachusetts, dedicated to marine research, engineering, and higher education. Established in 1930, its primary mission is to understand the ocean and its interaction with the Earth as a whole, and to communicate an understanding of the ocean’s role in the changing global environment. WHOI’s pioneering discoveries stem from an ideal combination of science and engineering—one that has made it one of the most trusted and technically advanced leaders in basic and applied ocean research and exploration anywhere. WHOI is known for its multidisciplinary approach, superior ship operations, and unparalleled deep-sea robotics capabilities. We play a leading role in ocean observation and operate the most extensive suite of data-gathering platforms in the world. Top scientists, engineers, and students collaborate on more than 800 concurrent projects worldwide—both above and below the waves—pushing the boundaries of knowledge and possibility. For more information, please visit www.whoi.edu
JOURNAL
Nature Geoscience
METHOD OF RESEARCH
Observational study
SUBJECT OF RESEARCH
Not applicable
ARTICLE TITLE
Abrupt Common Era hydroclimate shifts drive west Greenland ice cap change
ARTICLE PUBLICATION DATE
9-Sep-2021
Bottom line: Send money to keep us going.
Alternatively: no matter what happens, it’s all climate change.
Other alternative: Turns out the science is unsettled, send even more money!
It’s worse than we thought !!
High End Parasitism is an honorable job.
Its not as hoenest as pan handling.
But parasitism with a degree is far more prestigious.
As the number of political jobs is limited climate science is the way to go.
The only 2 thing it takes is to follow the orthodoxy and know the results even before the research has started.(And never get the idea to ask why 100* higher co2 levels a billion years ago failed to create a runaway effect or why Mars 95% co2 atmosphereis supercold )
“… the number of political jobs is limited …” Really?? The bureaucracy always increases.
$3.5 Trillion coming your way.
NV gaming revenues and tourism are down–send money
send suckers
A conspicuous lack of actual numbers.
Try these.
https://gracefo.jpl.nasa.gov/resources/33/greenland-ice-loss-2002-2016/
“Research based on observations from the NASA/German Aerospace Center’s twin Gravity Recovery and Climate Experiment (GRACE) satellites indicates that between 2002 and 2016, Greenland shed approximately 280 gigatons (aka billions) of ice per year, causing global sea level to rise by 0.03 inches (0.8 millimeters) per year”
0.8 mm/y out of the current SLR of 3.0 mm/y or 11.8” PER CENTURY!!
https://en.wikipedia.org/wiki/Greenland_ice_sheet
“Analysis of gravity data from GRACE satellites indicates that the Greenland ice sheet lost approximately 2,900 Gt (0.1% of its total mass) between March 2002 and September 2012. The mean mass loss rate for 2008–2012 was 367 Gt/year.”
In the TEN YEARS between 2002 and 2012 Greenland lost 2,900 Gt which represented –
(0.1% of its total mass, 2.8 MILLION Gt) (Yep, read the fine print.)
YES – AN ASTONISHING, NAY STAGGERING EVEN, ZERO POINT 1 PERCENT OF ITS TOTAL MASS!!!!!!!!
Are you effing kidding me? The uncertainty must be 10 times that much.
Who measures this crap and thinks the numbers have substance???
Probably those barely 20 millennials with their participation/entitlement PhDs.
Every year Greenland “loses” 500 Gt during the summer and gains it all back in the winter.
They don’t have to really mean it. They don’t even have to be factually correct. They just need to include those statements to show that they are anointed members of the climate brotherhood.
These are the same guys who claim that using a couple hundred sensors to measure all of the oceans, from the surface down to 2000m is capable of measuring a 0.03C increase in temperature over a couple of decades.
Go get them, Nick. For a Reality Check read the story of “Glacier Girl” a WWII P-38 that landed on the Greenland ice field and was subsequently buried under 268 feet (82 meters) of accumulated snow and ice. A group searched for the several airplanes, found them, and excavated Glacier Girl. Put that in your sea level formula.
Wait until the remnants of hurricane Larry hits it and dumps prodigious amounts of snow in the next few days. Will no doubt jump start this year’s accumulation season. Might even go to record territory.
It will have to beat May 26 2022 which had an impressive gain, almost off the scale.
If you look here
http://polarportal.dk/en/greenland/surface-cond
Then select 26 May 2021 on date selector you’ll see 12gT of mass gain in a single day.
since when has ice and snow been measured in units of gram.tesla
Glad I checked comments, I was going to point out the MASSIVE 0.1% loss that is heralding the end of all life on Earth. Funny, 0.1% is the lethality of Chinese Disease and they are driving a hysterical agenda of totalitarianism with it. Starting to see a pattern, people really need to wake the f**k up.
Notice that they said that the ice loss was 2,900 GT between March 2002 (end of winter, when ice volume is at its annual maximum) and September 2012 (end of summer, when ice volume is at its annual minimum). Any fair comparison would measure the ice volume at the same season in both years, and the net loss would be lower.
If this represents a mass loss of 0.1% in 10 years, at that rate it would take 10,000 years for the entire Greenland ice cap to melt, so mankind would have lots of time to adapt to that eventuality, should it occur. Most of the land of central Greenland under the ice is a relatively low basin, surrounded by mountains over 2,000 meters high, so that even if the ice sheet did melt completely, most of the water would be trapped as an inland lake and not flow out to the sea.
We also know that the climate cooled after the Medieval Warm Period of circa 900 to 1200 (the Vikings wrote about it), and also after the Roman Warm Period which ended circa AD 400. If there were two known cooling trends during the past 2,000 years, how can anyone be sure that there won’t be another cooling trend over the next 10,000 years?
Interesting timing of an article suggesting that Greenland’s ice can grow during a warming period.
Per Electroverse.net:
“SNOWICANE” LARRY FORECAST TO DUMP FIVE+ FEET OF SUMMER SNOW ON GREENLAND
This will happen within the coming week.
https://scitechdaily.com/new-generation-of-climate-models-increased-snowfall-will-offset-sea-level-rise-from-melting-antarctic-ice-sheet/
Models.
But, at least for a change, it is a ‘friendly’ model. 🙂
“All models are wrong. However, some are useful.”
Clyde,
My takeaway from the linked article is that although there will not be much melt runoff from Antarctica, there will be more than originally modeled from Greenland and that will still produce a significant rise in sea level.
However, if Larry the “Snowicane” is a prelude of future weather, then Greenland’s snow and ice SMB will likely increase.
Per the Danish Meteorogical Institute’s latest chart,
polarportal.dk/fileadmin/polarportal/surface/SMB_curves_LA_EN_20210909.png
,the summer season just ended with Greenland’s SMB (Surface Mass Balance) approximately 38% higher than the 30 year mean.
So much for those degreed researchers at woods hole.
One gets suspicious about what hole they’re studying.
Melting ???
http://nsidc.org/data/seaice_index/images/daily_images/S_stddev_timeseries.png
How odd. Both polar sea ice graphs took similar downturns…
Must be because the data is too inconvenient.
It will be interesting to watch how much snow falls this week as hurricane/tropical storm Larry swings by.
Where is best place to monitor Greenland snowfall?
Polar Portal – Surface Conditions
Thank you, not seen before…
http://polarportal.dk/en/greenland/surface-conditions/
The past 12 months Greenland has had a net mass gain….
From the article:
“According to Das and Osman, this phenomenon happens because of a “tug-of-war” between what causes an ice cap to grow (increased precipitation) or recede (increased melting) during periods of warming. Today, scientists observe melting rates that are outpacing the rate of annual snowfall atop ice caps. However, in past centuries these ice caps would expand due to increased levels of precipitation brought about by warmer temperatures. The difference between the past and present is the severity of modern anthropogenic warming.”
Your graph above is …
a) just a year and not a long-term trend (ie noise)
b) does not include basal melt.
“AbstractThe Greenland ice sheet has been one of the largest sources of sea-level rise since the early 2000s. However, basal melt has not been included explicitly in assessments of ice-sheet mass loss so far. Here, we present the first estimate of the total and regional basal melt produced by the ice sheet and the recent change in basal melt through time. We find that the ice sheet’s present basal melt production is 21.4 +4.4/−4.0 Gt per year, and that melt generated by basal friction is responsible for about half of this volume. We estimate that basal melting has increased by 2.9 ± 5.2 Gt during the first decade of the 2000s. As the Arctic warms, we anticipate that basal melt will continue to increase due to faster ice flow and more surface melting thus compounding current mass loss trends, enhancing solid ice discharge, and modifying fjord circulation.”
https://www.nature.com/articles/s41467-021-23739-z
The next snow bomb is on the way 😀
Right underneath it.
https://twitter.com/i/status/1436174010555973632
Where is griff when you need him!
Do you need him ?? I don’t 😀
comic relief.
Calling for Griff is a capital offense on this website.
Especially if he shows up.
You’ve ‘been warned.
He is busy on the Daily Mail spouting the usual rubbish to anyone who will not question his dogma.
Let lying dogs sleep.
They always seem to forget that there are more factors involved in glacier mass loss than just temperature. Precipitation matters. If it snows more during the winter than it melts during the summer, the glacier grows.
This is news? In the last interglacial there were no coastal glaciers at all on Greenland. You can not get more variable than that.
Post hoc analyses can find justification for whatever one wants after the fact. The true test of a science hypothesis is in future prediction, and then admitting failure hwne it doesn’t happen. Climate Science just ignores the alarmist GH warming prediction failures, adjusts the data to make it not so bad, and then claims success is just around the next corner.
“The findings of this study were a surprise”
Warmer climate = more evaporation from the ocean = more snow. Who would ever have guessed such a thing? /s
I’m confused. According to these authors, warmer conditions in the past were associated with Greenland gaining mass. Greenland is currently losing mass, yet the Earth is warming?
Now you know what makes climate change so dangerous 😀 😀 😀
The paper asserts that current AGW is causing a decrease in ice whereas the same prior natural warming caused an increase. The learned paper authors said “The difference between the past and present is the severity of modern anthropogenic warming.”
Apparently the current warming has a greater impact on glacial melt than did the exact same past warming because of its “severity.” This verbiage has no explanation of what “severity” actually means nor any data to support such an assertion. We are dealing here with CliSciFi in action; something is different so we assume AGW did it. No investigation.
Sorry, the paper still makes no sense to me. I must be thick.
I’ll give you an upvote for the first part of your comment, Not the second
The laws of physics: constantly in flux.
“Apparently the current warming has a greater impact on glacial melt than did the exact same past warming”
So, “This time it’s different”?
Of course it is: This time it is the nasty AGW causing the warming, not that old fashioned natural stuff. There is a big difference in how the same temperatures affect ice properties depending on the cause of any temperature increase, doancha know?
Let’s don’t overcomplicate it for them. Climate is simple, everything is linear, and the laws of physics are changing as quickly as they can, in response to the requirements of political correctness and social justice.
In settled science, there are no surprises. That’s how we can land equipment on Mars or an asteroid with consistency. So, inquiring minds want to know, is climate science surprising or settled?
Neither. Just unsettling.
“World’s largest island”
Greenland is made of continental crust. “World’s smallest continent” would be technically much more correct.
Another contribution from the department of pedantic irrelevance.
The Aussies disagree.
New Zealand’s North vs South islands would compete for the title “World’s smallest continent”.
Bull puckey. Standard fare for pseudoscientists though.
Melting and freezing is a social construct, everyone ought to know that by now.
Sounds like a great excuse (probably the best since global warming was renamed climate change to get the opportunity to blame any anomaly,even the cold ones that were used against AGw,on co2).
“oh look.Sea levels ain’ t rising.Maledives don ‘t disappear,Ice mass increasing.Fort Denison Sea level 2 inches below 1910 average ”
Now itit no longer a problem to explain it away as we have now a peer reviewed deus ex machina that can blame increasing ice volumes on warming = checkmate for the sceptics
and Obamas, Al Gore,Markle of the beast can keep on buying beach properties.
China and Dubai can keep on building artificial sea islands.
We now have an excuse.
(Lets ignore the reason why Greenland was called Greenland in the first place and why the vikings died when it was no longer green)
Whatever happens – It’s because of AGW.
This paper follows the main principal of bureaucrtic job darwinsim (survival of the shittest):
Do whatever it takes to avoid a real job.
The bureaucracy is like a cesspool: All the really big chunks float to the top.
I read somewhere that the vikings left Greenland because the market for walrus ivory collapsed, as the Portugese found out how to get plentiful supplies of elephant ivory.
Ice melts at 0 deg C. It does not melt at any modeled global mean temperature anomaly.
Ice melts at +3 C according to some models.
Meanwhile:
“Sea ice in the Southern Ocean surrounding Antarctica was well above the 1981 to 2010 average extent in August, rising above the ninetieth percentile of the satellite record period near the end of the month (Figure 7). As of this post, Antarctic sea ice extent is fifth highest for the day in the satellite record,…”
https://nsidc.org/arcticseaicenews/
Also from nsidc :
“Arctic sea ice extent declined more slowly during August 2021 than most years in the past decade, and as a result, this year’s September minimum extent will likely be among the highest since 2007.”
Peter Wadhams- director of the Scott Polar Institute in Cambridge from 1987 to 1992 :
“I think it will be free of ice in summer and by that I mean the central Arctic will be ice-free. Ice-free means the central basin of the Arctic will be ice-free and I think that that is going to happen in summer 2017 or 2018.” quote from 2016.
3 years later the monthly average extent for August 2021 is 5.75 million square kilometres (2.22 million square miles).
The last days, ice was melting and growing alternately. As I said last week, this weekend may be the end of melting season, and the behaviour seems to be the respective hint.
The Danes own Greenland and don’t seem to be interested in ice bores…may find it boring…but are not worried that it will soon be too late to bore. The Danish Arctic ice information seems to differ from NASA …NOAA…whatever….whoever…but the Big Freeze is starting now according to their site.
This gobbledygook seems to be saying “ice and snow on earth are always melting even big they’re increasing in amount. Earth is always warming even if it’s cooling.”
With so many scientists involved I guess no one can argue with that. Odd that I expected to see George Orwell listed as a major contributor but did see his name.
The revelation of a new phenomenon: last sentence of the abstract of that paper:
“Taken together with modern observations, the ice core evidence could indicate a recent reversal in the response of west Greenland ice caps to climate change.”
We had already got “pauses” and other kinds of “anomalies”, now we got a plain “reversal of response to climate change”.
“The Science” and “The Experts” say that chunks of the Earth surface not only behave (they “respond”) but indeed behave in a kind of chaotic way: climate changes, but that “behaviour” may be anything or its reverse; a pattern possibly of the realm of psychopathology.
Earth, or, at least, climate (eventually, “climate change”) need urgently some medical advice, please invite some shrinks to participate in the IPCC.
But hey, it’s a great way to beat the summer heat in the desert.
Tell all this bull to the Vikings as they didn’t call the place Whiteland…..
The snow season on Grenland runs from September 1. to same date next year, with melting from May to September and build up the rest of the year. Every year there is more build up than melt. The reason the central ice sheet does not grow sky high is that the weight pushes the mass outwards to the coast via glaciers that are like slow flowing rivers. Here ice is melted as it meets the ocean. So this rate can increase with hotter sea water, but the variation can never be substansial and regarded as removal of the ice sheet. Over the years there must be a balance.
“… novel study …”. “ … the first …” ad infinitum, ad nauseam. Ooh, we must all be impressed. So they sent a drill rig to recover a single measly ice core, studied it to the extreme, then attempted to extrapolate the findings to all of Greenland for all time.
Send more money? Since everyone knows that “The Science”TM is settled, “defund the fleece.”
The truly odd thing is that ice cores are useless for recent temperatures, ice gains or losses.
The portions of ice cores near the surface are typically discarded until actual solid ice is encountered in the core.
So severe that at the average rate of 268 cu km per annum, as determined by the GRACE satellite, the ice cap will all melt away in only 10,634 years. By which time the next ice age will have been underway for several millennia.
“Glaciers and ice caps are unique high-resolution repositories of Earth’s climate history, and ice core analysis allows scientists to examine how environmental changes – like shifts in precipitation patterns and global warming – affect …”
Except when they don’t toe the consensus line!
From R.B. Alley (2004), GISP2 Ice Core Temperature and Accumulation. NOAA/EGDC, Paleoclimatolgy Program, Boulder CO.
This graph on its own completely punctures the CAGW narrative. It should be widely publicised.
“This graph on its own completely punctures the CAGW narrative. It should be widely publicised.
Yes, please do as it shows the scientific and unsceptical nature of certain “sceptics”, when seeing something that accords with their ideological viewpoint.
That is, as well as, the hypocrisy of “sceptics” implying that one bore-hole location on top of the Greenland plateau represents a proxy for the entire planet …. when if the shoe where on the “other foot” they would (rightly) be raising stink.
How about a (much) more scientific approach and consider a number of ice-cores across the breadth of the ice-field ….
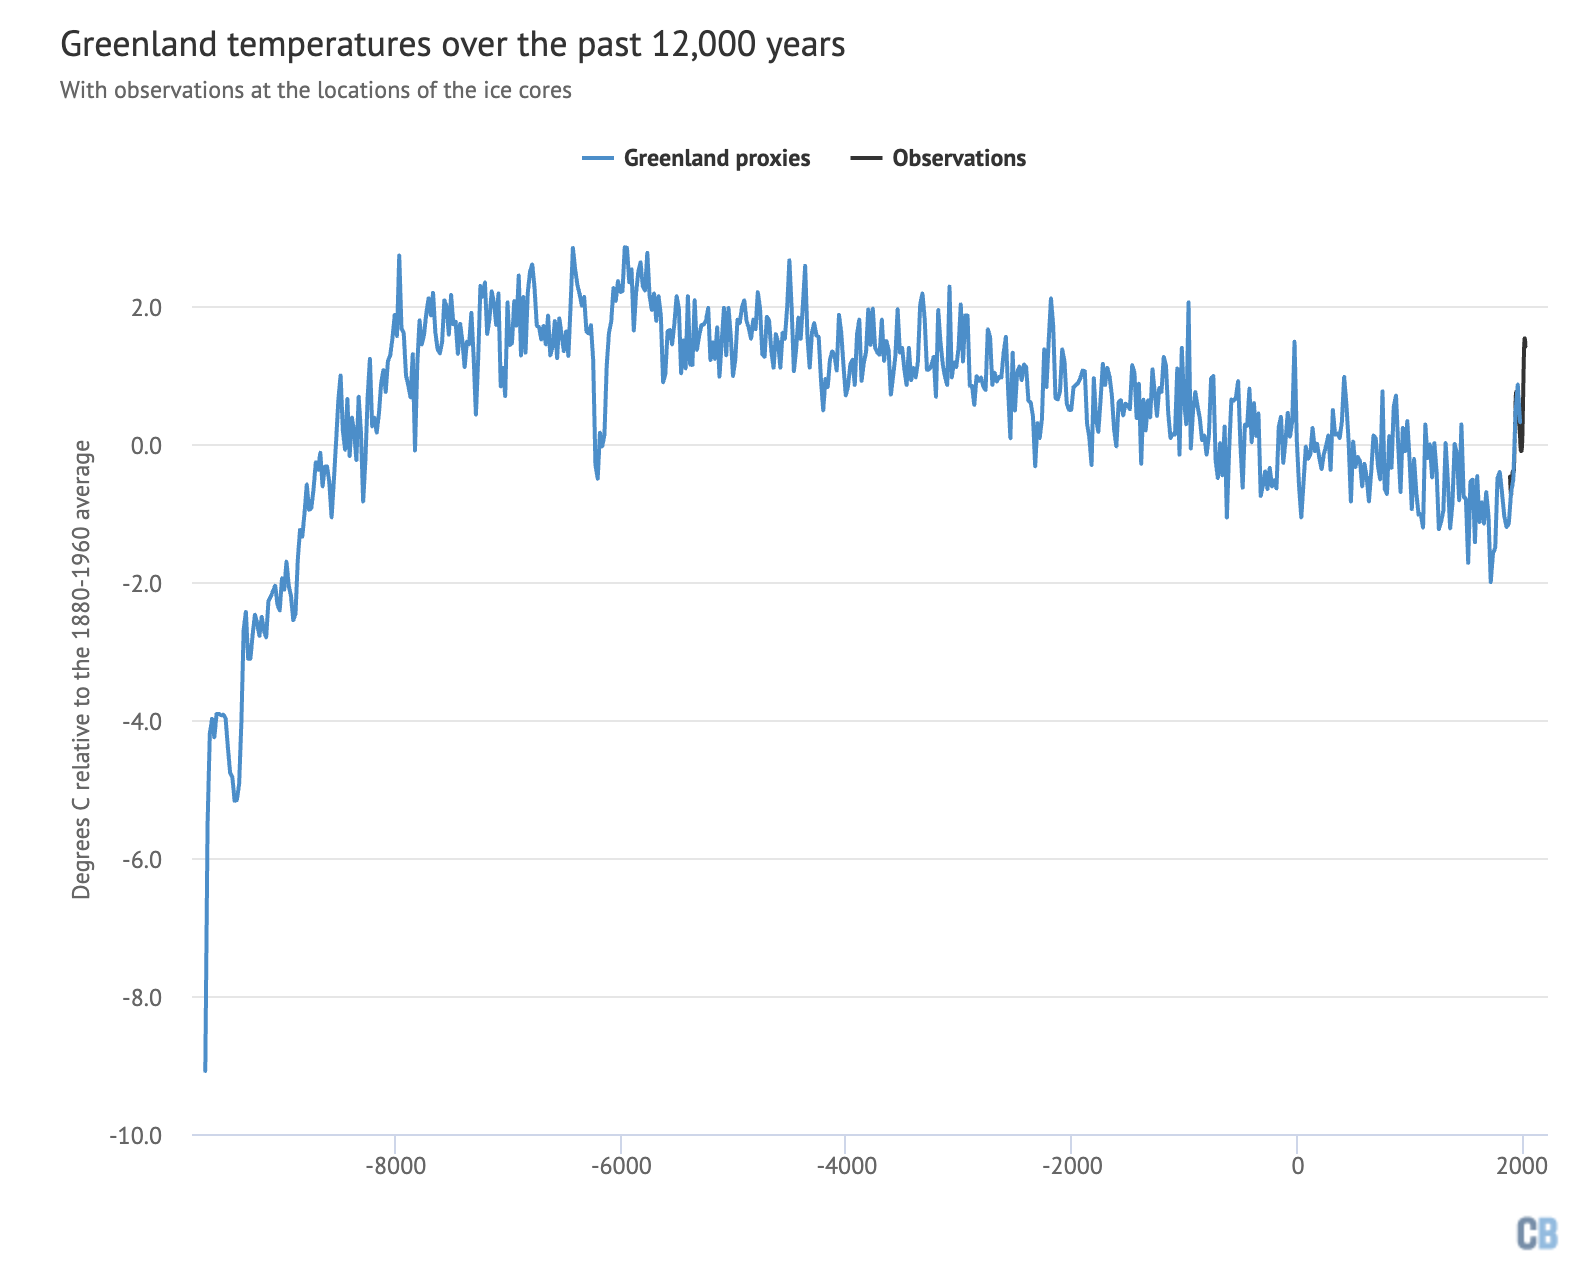
“Greenland temperature reconstruction from Vinther et al. (2009) using proxy data from six ice cores. Data spans the past 12,000 years with a resolution of 20 years. Observational temperature data from Berkeley Earth is shown at the end in black, with a 20-year smooth applied to match the proxy resolution. Proxy records and observations are aligned over the 1880-1960 period.”
Also we do know that the Arctic was warmer than present thousands of years ago.
The reason is easily discovered ……
And this is Greenland plateaux temperatures for the last 2000 years ….
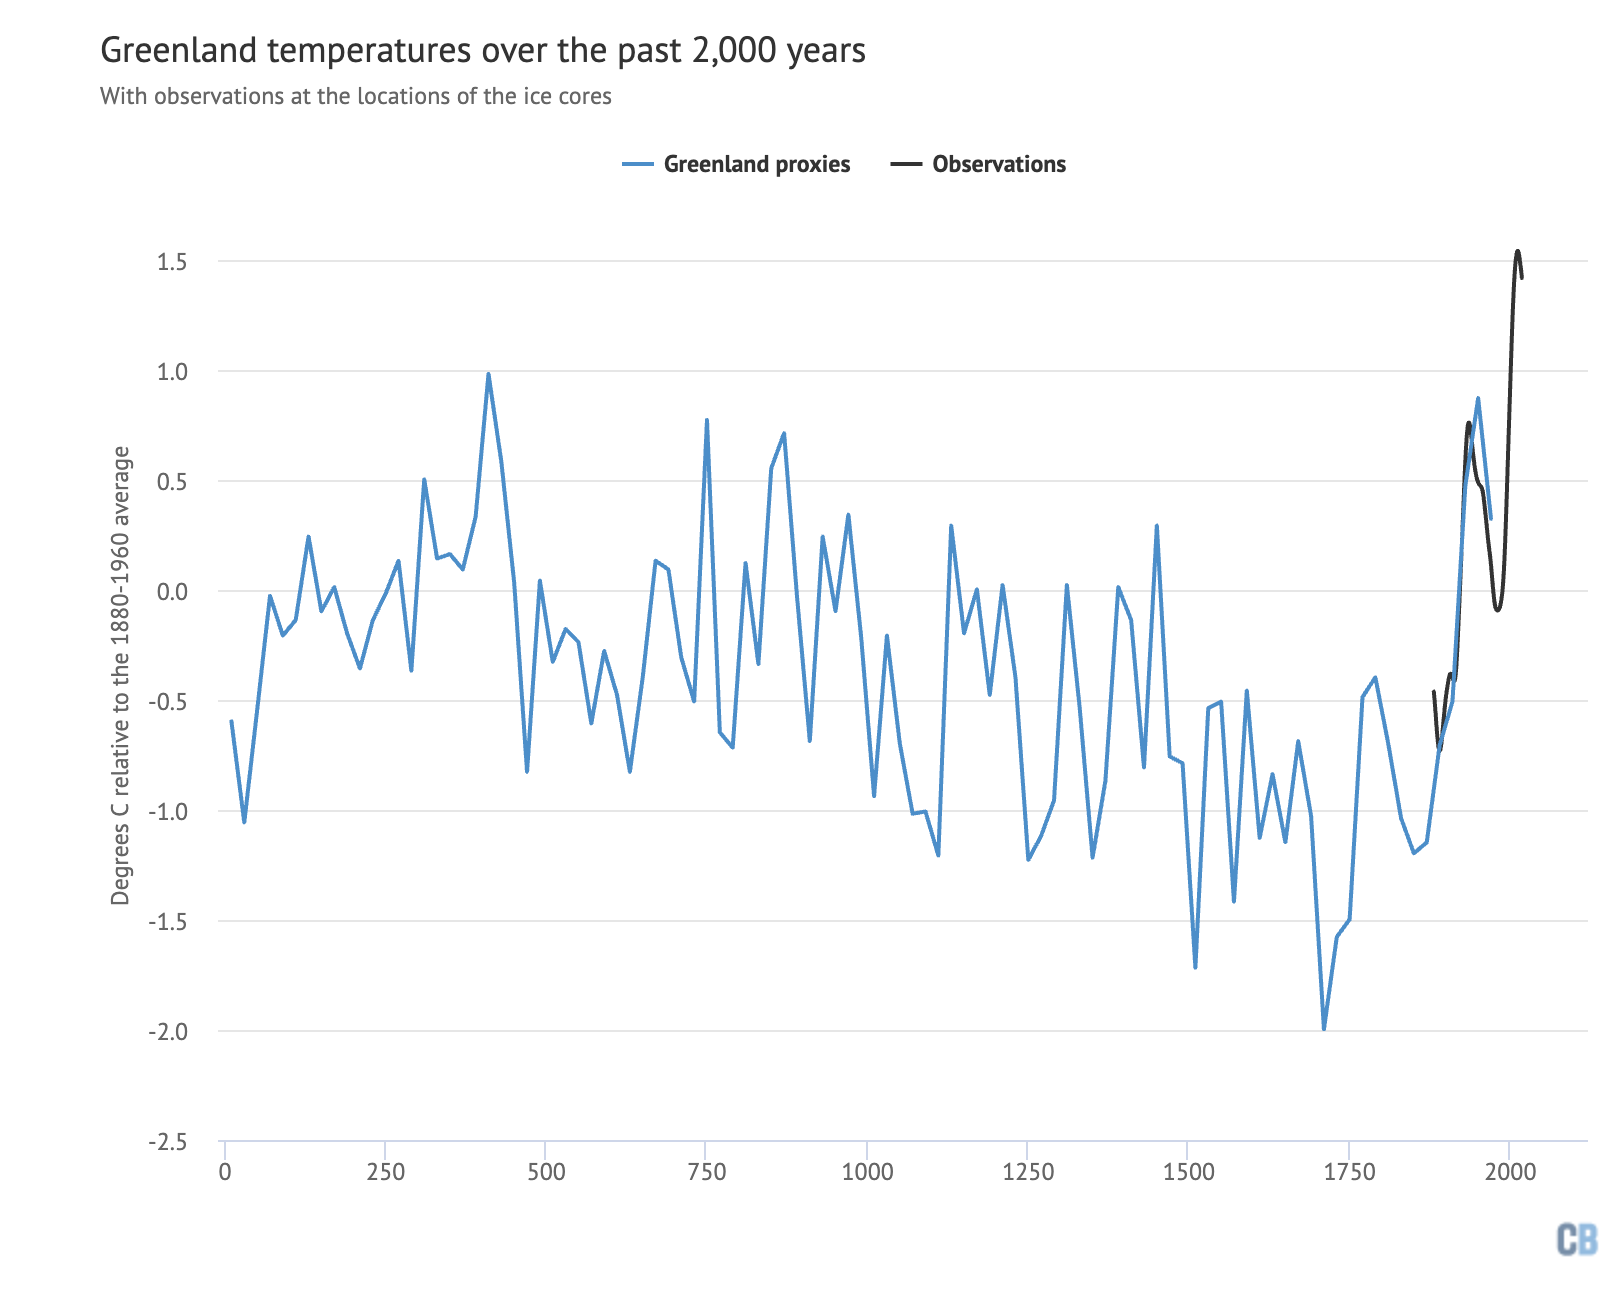
“Greenland temperature reconstruction over the past 2,000 years from Vinther et al 2009 and observational temperature data from Berkeley Earth with a 20-year smooth applied.”
Also from : https://www.carbonbrief.org/factcheck-what-greenland-ice-cores-say-about-past-and-present-climate-change
A comment from Alley (author of the “sainted” graph)….
“Alley made this point explicitly,
“So, what do we get from GISP2? Alone, not an immense amount. With the other Greenland ice cores… and compared to additional records from elsewhere, an immense amount… Using GISP2 data to argue against global warming is, well, stupid, or misguided, or misled, or something, but surely not scientifically sensible.”
So you agree that current temperatures are still well below those of the Holocene.
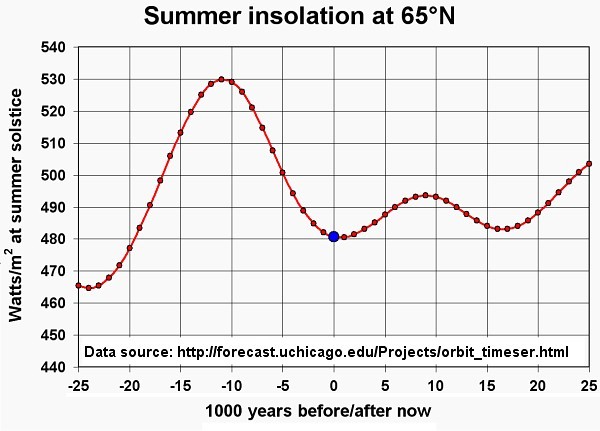
According to your graph, insolation at 65 North decreased from 530W/m2 at 10000 years BP to 500 W/m2 at 5000 years BP, yet the temperature increased from -30.5 to -28.8C over that period.
The question you ran away from the last time you spammed this graph:
What is “insolation”?
Air Mass Zero?
Direct normal?
Direct+diffuse?
Hemispherical?
Hemisherical tilted?
The article is implying that, because of anthropogenic warming in the region, Greenland is losing ice mass because this warming is somehow “unprecedented”, maybe because it’s warming so fast that new snowfall, even from a warmer ocean, can’t keep up. Okay, I’ll bite: even if that’s true, haven’t we always been told that water, and therefore the oceans, warm up more slowly than the atmosphere (in fact, it does)? That the ocean is “hiding heat”? Well, once the ocean warms up to increase evaporation (thus, more snowfall), the historical balance should reappear. But, they don’t seem to have a good grasp on the ice sheet mass balance in the first place, so who cares…
Someone needs to fly out a fleet of Zamboni to clean the dirt off the ice and stop the melting.
I know the graph up there has been “discredited” by the climate wroughters. It is what they do when they don’t get the pre-ordained ‘correct” data.
It’s what they did with global and local instrumental weather station temperatures. It’s what they did to correct Global Mean Temp forecasts that proved to be 300% too high (including moving the 1950 datum, first back to 1850, and in recent months, back to 1750!! to repurpose ~2°F of natural recovery from the LIA to shore up a weak CAGW account). It’s what they did to try to accelerate a stubborn linear SLR. It’s what they did to erase an embarrassing 2-decade “Pause” in global temperatures….Indeed most ‘professional’ climatological work had been expended making adjustments to nature’s uncooperative resistance to “crisis climate”.
The author’s explain, “…in past centuries these ice caps would expand due to increased levels of precipitation brought about by warmer temperatures. The difference between the past and present is the severity of modern anthropogenic warming”.
It must be nice being a University liberal knowing that more precipitation from warmer temperatures only happened in the past but not anymore simply because of anthropogenic warming. No other possible factors, black and white, stop burning “fossil fuels” and it will all be good. Ridiculous.
A single core means literally nothing,
Come back with the data after they’ve done at least a couple hundred, or preferably a couple of thousand of these ice cores.
The results of this study are useless bullshit as a tool to predict the performance of the entire Greenland ice cap. It’s like getting a tree ring record at a single point location in North America and extrapolating that to characterize the climate of the entire continent, from Hudson’s Bay to the Bay of Campeche.
SMH – any freshman student in climatology deserves to get drummed out of the program for delivering a set of conclusions like these!!!
“ It’s like getting a tree ring record at a single point location”
I think that’s been done by Piltdown Mann