Guest geological perspective by David Middleton
This is a sort of a spin-off of Rutgers University Global Snow Lab and “the Snows of Yesteryear” and A Geological Perspective of the Greenland Ice Sheet. And, yes, there are a lot more than five charts in this post… And, none of them were all that easy.
Introduction
There is a general scientific consensus that the Greenland Ice Sheet (GrIS) has been losing ice mass since the Little Ice Age (LIA). This should come as no surprise, since the LIA was quite likely the coldest climatic episode of the Holocene Epoch. Although it does appear that the GrIS may have gained ice mass during the mid-20th century global cooling crisis.
According to Mouginot et al, 2019, the GrIS was gaining an average of +47 ± 21 Gt/y from 1972–1980, then began to lose ice mass after 1980:
- -51 ± 17 Gt/y from 1980–1990
- -41 ± 17 Gt/y from 1990–2000
- -187 ± 17 Gt/y from 2000–2010
- -286 ± 20 Gt/y from 2010–2018
The alleged ice mass loss was driven by:
- A sharp decrease in surface mass balance from 1995-2012
- An increase in iceberg calving and other ocean-contact discharge

The drop in SMB was so severe, that it may have been negative in 2007 and 2012. Most of the ice mass loss is due to the calving of icebergs. The “funny thing” is that, apart from a spike in iceberg activity in the 1990’s, it’s not really much different now than it was from 1900 to 1950.
International Ice Patrol’s Iceberg Counts
1900-2011Donald L. Murphy
IntroductionEach year, the International Ice Patrol (IIP) estimates the number of icebergs that pass south of 48° N, the latitude south of which icebergs are considered a menace to North Atlantic mariners. The dataset (Table 1) extends from 1900, 12 years before the sinking of RMS Titanic, to the present.
For several reasons, these iceberg counts do not constitute a rigorous, scientific data set and should be interpreted with great care. For example, IIP’s reconnaissance operations focus on the icebergs closest to the transatlantic shipping routes, and rarely does IIP conduct a comprehensive survey of the area south of 48° N. In addition, the methods of observation have changed radically over the years as new technologies became available to detect and track icebergs. The earliest data were obtained from visual observations from early 1900s sailing vessels, while the recent information is obtained from visual and radar observations from modern ships, aircraft, and satellites.[…]
DiscussionThere is striking year-to-year variability evident in the 112-year record of IIP’s iceberg counts (See Figure 1 below and Table 1 (a PDF which will open in a new window)). The mean number of icebergs estimated to have passed south of 48° N is 474. The greatest number of icebergs (2202) occurred in 1984, while twice in IIP’s history (1966 and 2006) no icebergs were estimated to have passed south of 48° N. Five times in IIP’s history there has been at least one iceberg estimated to have passed south of 48° N during each of the months of the ice year: 1915, 1919 through 1921, and 1985. April and May are, by far, the months with the most icebergs entering the shipping lanes.
US Coast Guard Navigation Center

I was able to find detailed data on iceberg sightings on the National Snow and Ice Data Center website and extended the Coast Guard plot through 2019.
Chart Number One: Icebergs

While there was a significant increase in the 5-yr running average in the 1990’s, since then, it’s been comparable to 1900-1950. You would think that with Greenland spitting out Manhattan-sized icebergs on what seems like a weekly basis and the discharge rate supposedly rising by 50% since 1995, you should see it in the iceberg count.
Maybe the “unprecedented” Arctic warming is melting the icebergs before they can get south of 48° N. Well, the Arctic has a few very long-term “thermometers”… Ice cores from Greenland. The Greenland temperature reconstruction, most often cited by skeptics, is from the GISP2 ice core (Alley, 2000).

In my previous post, I was accused of misleading people with this graph:
Regarding the first graph: so often we see the GISP2 data mislabelled and here is no exception.
That data series ends in 1855, NOT in 1950 as labelled.
This has been made clear on this site so often, since 2010 in fact, that it’s hard to believe people keep using it without knowing that to be the case.
Why mislead people if our argument is so strong?
TheFinalNail
Anyone with at least a 5th grade reading comprehension can see that the x-axis is labeled “Years Before Present (1950 AD). Anyone with the slightest knowledge of radiometric dating knows that the P in BP is 1950. This is also the standard for most paleoclimate reconstructions. Unless a paper specifies that “present” is any year other than 1950, it’s safe to assume that it’s 1950. The most recent year in the Alley time series is 95 BP or 1855.
Of course, 1855 was back during the LIA, long before Al Gore invented Gorebal Warming. Fortunately, there are a few GISP2 temperature reconstructions that extend up to 1993 (Kobashi et al., 2008, Kobashi et al., 2011 and Kobashi et al., 2017). Unlike Alley, who relied on δ18O depletion as a paleo-thermometer, Kobashi employed “high‐precision analyses of δ15N and δ40Ar in trapped air in ice cores”…
The estimated average Greenland snow temperature over the past 4000 years was −30.7°C with a standard deviation of 1.0°C and exhibited a long‐term decrease of roughly 1.5°C, which is consistent with earlier studies. The current decadal average surface temperature (2001–2010) at the GISP2 site is −29.9°C.
Kobashi et al., 2011
The GISP2 ice core was drilled at the same location as Summit Station, Greenland.

According to Kobashi, the average temperature at Summit Station over the past 4,000 years has been −30.7 °C. The average temperature since 2008 has been about −30 °C.

Chart Number Two: GISP2 Ice Core
I downloaded the Kobashi et al., 2017 climate reconstruction from NOAA and plotted it to evaluate the context of recent climate change in central Greenalnd. Technically, this could be described as three charts… But, who’s counting?


The inescapable conclusion is that if there ever was a climate “crisis,” it was during the Little Ice Age… It was FRACKING cold back then!
What’s that? Central Greenland isn’t the Arctic? No schist Sherlock!
Chart Number Three: The Arctic
So, let’s look at the recent Arctic temperature reconstruction by McKay & Kaufman, 2014.


The inescapable conclusion is that if there ever was a climate “crisis,” it was during the Little Ice Age… It was FRACKING cold! And it got pretty cold again in the 1970’s!
But, but, what about all of the ice mass loss measured by satellites?
What about it?
Three Decades of Greenland Ice Sheet Change
14.June.2019
Posted by ESA Greenland Ice Sheet Climate Change Initiative.
This week there has been significant melting over a large area of the Greenland ice sheet. Temperatures even reached over 0°C for the second time this year at the very top of the ice sheet 3285m above sea level at Summit station where DMI operates a weather station.
The high melt rates have been due to warmer air moving over the ice sheet, which in combination with low snowfall over most of the ice sheet during the winter period means quite large amounts of melt might be expected this year. A large melt event this early is unusual but it’s not unprecedented a similar event happened in 2012 for example.
Specific melt events of this kind are controlled by local weather conditions in the North Atlantic but when these events are averaged over many years, you get the local background climate. In a paper published by scientists in a large European collaboration led by ESA and including DMI, DTU and GEUS, observations from satellites stretching back to the 1990s, including many shown here on the polar portal, have been used to give a well-rounded picture of how climate changes in Greenland have been affecting the ice sheet.
We show for example, that since the early 2000s the ice sheet has become thinner almost everywhere. For an ice sheet in balance with the local climate we expect to see a small increase in surface height year on year in the centre and a decrease around the edges as more snow falls than melts at higher elevations and the reverse happens lower down. However, scientists show that the ice sheet is now getting thinner almost everywhere (blue areas in the top row). “It’s quite striking that we see such big changes when we compare the early 1990s to the last few years” said scientist Sebastian Simonsen from DTU.
[…]
Polar Portal
The folks at Polar Portal were kind enough to feature this image:

I focused in on the top panel, elevation changes, because I can put those changes into geological context.
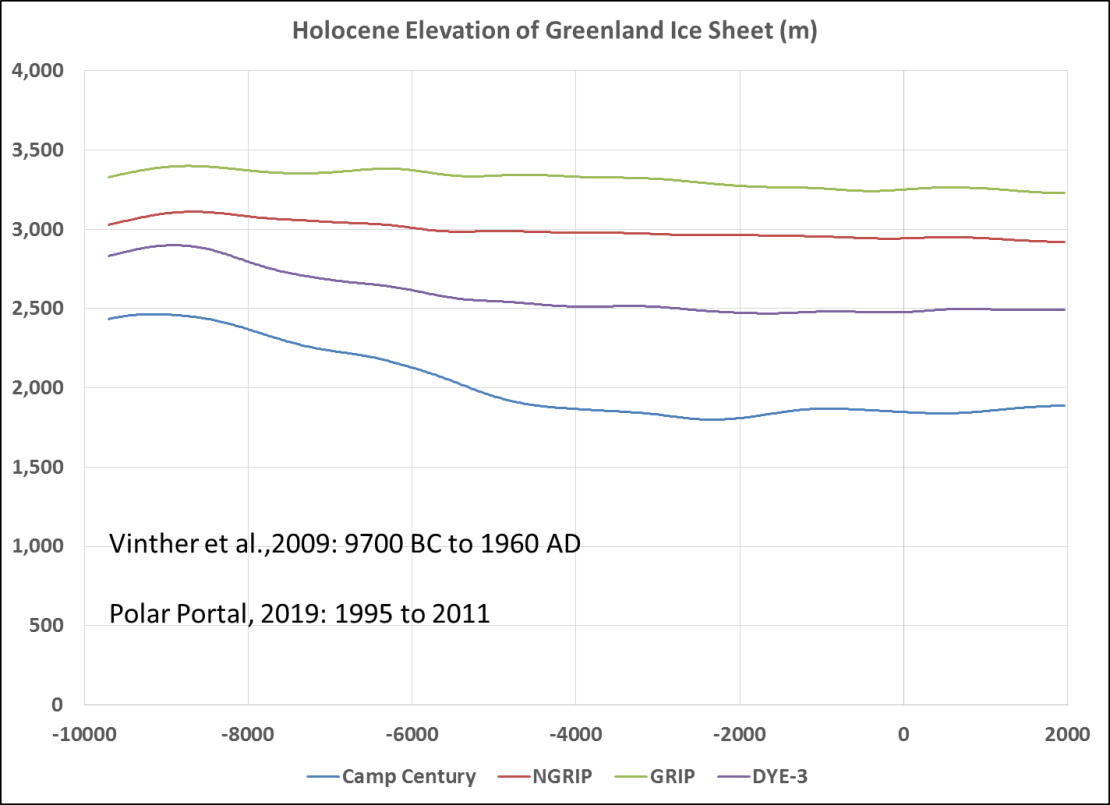
How does the recent melting compare to the rest of the Holocene? Short answer: “Same as it ever was”. Vinther et al., 2009 reconstructed the elevations of four ice core sites over the Holocene. There has been very little change in elevation of the two interior ice core sites (NGRIP and GRIP), while the two outboard sites (Camp Century and DYE3) have lost 546 and 342 m of ice respectively

Vinther’s elevation reconstruction runs from 11,700 to 40 years before the year 2000. So the most recent year is 1960.
Based on the mass balance estimates from Mouginot, there was very little net change from 1960 to 1995, the starting year for Polar Portal’s elevation change maps. I enlarged the elevation change maps and posted the ice core locations on them.

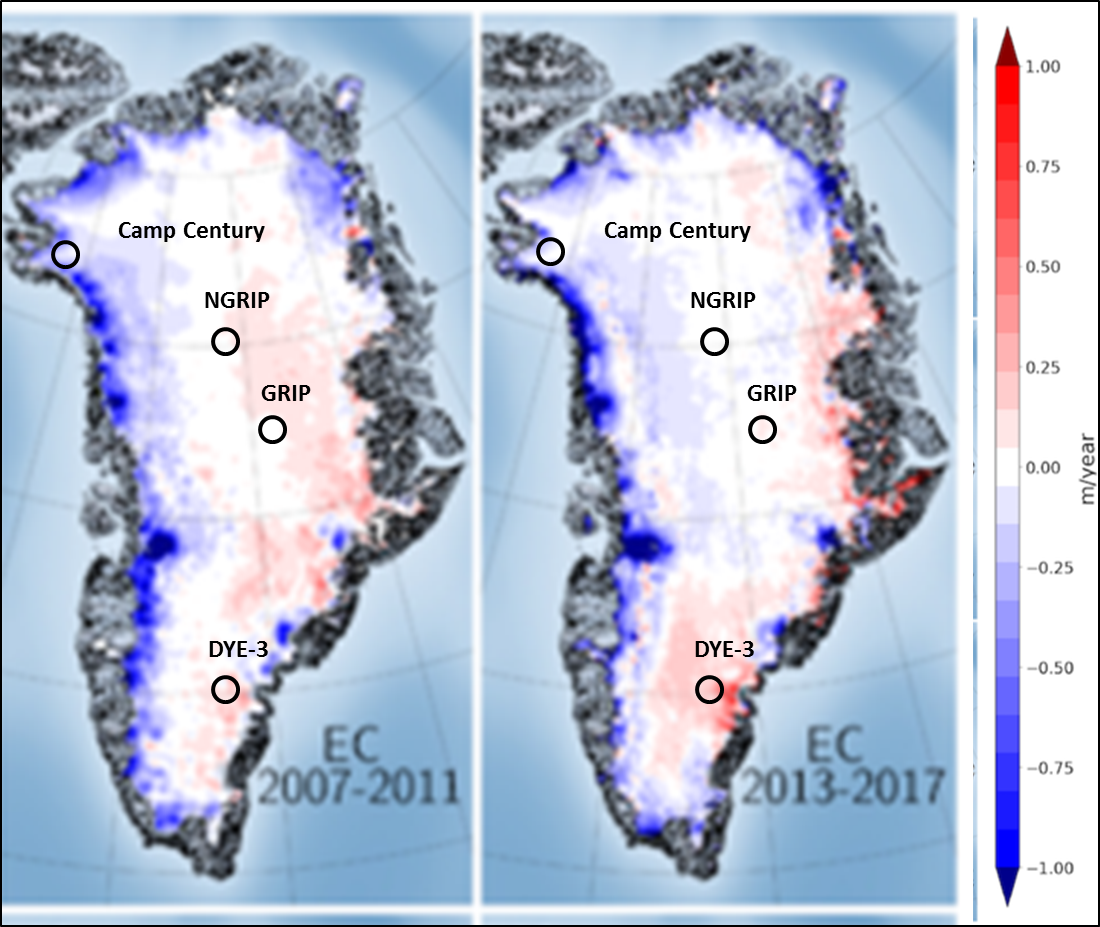
The scale is in meters per year. Note that there has been very little change in ice elevation at these locations. Using my Mark I eyeball, I estimated the annual changes in elevation from 1995-2017.
Ice Surface Elevation Change (m/yr)
| Camp Century | NGRIP | GRIP | DYE-3 | |
| 2017 | 0 | 0 | 0.125 | -0.5 |
| 2016 | 0 | 0 | 0.125 | -0.5 |
| 2015 | 0 | 0 | 0.125 | -0.5 |
| 2014 | 0 | 0 | 0.125 | -0.5 |
| 2013 | 0 | 0 | 0.125 | -0.5 |
| 2012 | -0.125 | 0 | 0.0625 | -0.375 |
| 2011 | -0.25 | 0 | 0 | -0.25 |
| 2010 | -0.25 | 0 | 0 | -0.25 |
| 2009 | -0.25 | 0 | 0 | -0.25 |
| 2008 | -0.25 | 0 | 0 | -0.25 |
| 2007 | -0.25 | 0 | 0 | -0.25 |
| 2006 | -0.0625 | 0 | -0.0625 | -0.375 |
| 2005 | 0.125 | 0 | 0.125 | -0.5 |
| 2004 | 0.125 | 0 | 0.125 | -0.5 |
| 2003 | 0.125 | 0 | 0.125 | -0.5 |
| 2002 | 0.125 | 0 | 0.125 | -0.5 |
| 2001 | 0.125 | 0 | 0.125 | -0.5 |
| 2000 | 0.125 | 0 | 0.0625 | -0.375 |
| 1999 | 0.125 | 0 | 0 | -0.25 |
| 1998 | 0.125 | 0 | 0 | -0.25 |
| 1997 | 0.125 | 0 | 0 | -0.25 |
| 1996 | 0.125 | 0 | 0 | -0.25 |
| 1995 | 0.125 | 0 | 0 | -0.25 |
Using the 2009 elevations provided by Vinther, I calculated the elevations of the four locations from 11,700 years ago up to 2017.
Chart Number Four…”Same as it ever was!”

But, but, the Greenland ice sheet is still shrinking! When it all melts, sea level will rise by 7 meters!!!
Chart Number Five: The Isopach Map
I usually prefer to use the word “graph” instead of “chart”… But charts can be either graphs or maps.
We petroleum geologists are obsessed with calculating volumes of oil and gas reservoirs and we spend a lot of time making things called “isopach maps” and running “volumetrics“. Fortunately for me, Eric Gaba – Wikimedia Commons user: Sting made an isopach map of the Greenland ice sheet.

Almost all of the recent thinning is in the outboard areas of the ice sheet (“Same as it ever was”). I downloaded a high-resolution copy of the isopach map and digitized the contours using NeuraMap volumetric analysis software. The area and volume of the isopach map were inline with estimates in USGS Professional Paper 1386–A, Table 2, page A77.
- Area: 1,736,095 km2
- Volume: 2,600,000 km3
I used the 10 m contour as the 0 contour. The area of the 0 m contour was very close to the USGS area.
| Contours (m) | km2 | Acres |
| 3,200 | 888 | 219,434 |
| 3,000 | 49,381 | 12,202,209 |
| 3,000 | 896.1 | 221,429 |
| 2,500 | 364,162 | 89,986,345 |
| 2,000 | 723,269 | 178,723,576 |
| 2,000 | 5,395 | 1,333,230 |
| 2,000 | 9,186 | 2,269,815 |
| 1,500 | 1,065,247 | 263,228,385 |
| 1,000 | 1,347,485 | 332,970,919 |
| – | 1,737,393 | 429,319,196 |
The volume was a little higher than the USGS estimate; but well within the range of other recent estimates. The USGS cites a 1954 reference for this number and also cites Bamber et al., 2011, which puts the volume at 2,900,000 km3. Bamber has subsequently upped his estimate to 2,960,000 km3.
| Volumes | km3 |
| Method | In situ |
| Trapezoid | 2,980,626 |
| Pyramid | 2,953,938 |
| TrapPyra | 2,961,940 |
| Simpson | 2,844,332 |
| 3/8Rule | 2,725,668 |
| VerticalSlice | 2,979,256 |
| Step | 2,456,431 |
| Average | 2,843,170 |
As can be seen, estimates for the volume of the Greenland ice sheet vary widely and the methods of volumetric calculation yield a pretty wide range of results… Yet modern climate “scientists” can detect 0.015% annual changes in its mass… Go figure!
This is what happens if I drop the 1,000 m contour by 10 m:
| Volumes | km3 | |
| Method | Lose 10 m | |
| Trapezoid | 2,977,601 | 99.90% |
| Pyramid | 2,950,926 | 99.90% |
| TrapPyra | 2,958,915 | 99.90% |
| Simpson | 2,844,332 | 100.00% |
| 3/8Rule | 2,725,668 | 100.00% |
| VerticalSlice | 2,976,230 | 99.90% |
| Step | 2,453,891 | 99.90% |
| Average | 2,841,080 | 99.93% |
99.93% of the Greenland ice sheet doesn’t melt and/or calve into the ocean. The USGS paper states that if the entire ice sheet were to melt, sea level would rise by 6.5 meters. In the highly unlikely scenario above, sea level would rise by a whopping 4.8 mm.
- 6.5 m * 0.07% = 0.00478 m
What happens if I drop the 1,000 m contour by 100 m?
| Volumes | km3 | |
| Method | Lose 100 m | |
| Trapezoid | 2,947,019 | 98.87% |
| Pyramid | 2,920,467 | 98.87% |
| TrapPyra | 2,928,333 | 98.87% |
| Simpson | 2,844,332 | 100.00% |
| 3/8Rule | 2,725,668 | 100.00% |
| VerticalSlice | 2,945,636 | 98.87% |
| Step | 2,428,207 | 98.85% |
| Average | 2,819,952 | 99.18% |
- 6.5 m * 0.82% = 0.0531m
That’s just over 2 inches of sea level rise.

There you have it… The insignificance of Greenland’s ice mass loss in five easy charts… And a lot of not so easy charts and tables.
References
Alley, R.B. 2000. “The Younger Dryas cold interval as viewed from central Greenland”. Quaternary Science Reviews 19:213-226.
Alley, R.B.. 2004. “GISP2 Ice Core Temperature and Accumulation Data”.
IGBP PAGES/World Data Center for Paleoclimatology Data Contribution Series #2004-013. NOAA/NGDC Paleoclimatology Program, Boulder CO, USA.
Bamber, J. L., J. A. Griggs, R. T. W. L. Hurkmans, J. A. Dowdeswell, S. P. Gogineni, I. Howat, J. Mouginot, J. Paden, S. Palmer, E. Rignot, and D. Steinhag. “A new bed elevation dataset for Greenland”. The Cryosphere, 7, 499–510, 2013 www.the-cryosphere.net/7/499/2013/ doi:10.5194/tc-7-499-2013.
Grosjean, Martin, Suter, Peter, Trachsel, Mathias & Wanner, Heinz. (2007). “Ice‐borne prehistoric finds in the Swiss Alps reflect Holocene glacier fluctuations”. Journal of Quaternary Science. 22. 203 – 207. 10.1002/jqs.1111.
Kobashi, T., J. P. Severinghaus, and K. Kawamura (2008a). “Argon and nitrogen isotopes of trapped air in the GISP2 ice core during the Holocene epoch (0–11,600 B.P.): Methodology and implications for gas loss processes”. Geochim. Cosmochim. Acta. 72, 4675– 4686, doi:10.1016/j.gca.2008.07.006.
Kobashi, T., Kawamura, K., Severinghaus, J. P., Barnola, J.‐M., Nakaegawa, T., Vinther, B. M., Johnsen, S. J., and Box, J. E. ( 2011). “High variability of Greenland surface temperature over the past 4000 years estimated from trapped air in an ice core”. Geophysical Research Letters. 38, L21501, doi:10.1029/2011GL049444.
Kobashi, T., Menviel, L., Jeltsch-Thömmes, A. et al. “Volcanic influence on centennial to millennial Holocene Greenland temperature change”. Scientific Reports 7, 1441 (2017). https://doi.org/10.1038/s41598-017-01451-7
McKay, N., Kaufman, D. “An extended Arctic proxy temperature database for the past 2,000 years”. Scientific Data 1. 140026 (2014). https://doi.org/10.1038/sdata.2014.26
Mouginot, Jeremie, E. Rignot, Anders Bjørk, Michiel Van den Broeke, Romain Millan, Mathieu Morlighem, Brice Noël, Bernd Scheuchl & Michael Wood. (2019). “Forty-six years of Greenland Ice Sheet mass balance from 1972 to 2018”. Proceedings of the National Academy of Sciences. 116. 10.1073/pnas.1904242116.
Van den Broeke, M., Box, J., Fettweis, X. et al. “Greenland Ice Sheet Surface Mass Loss: Recent Developments in Observation and Modeling”. Current Climate Change Reports. (2017) 3: 345. https://doi.org/10.1007/s40641-017-0084-8
Vinther, B.M., S.L. Buchardt, H.B. Clausen, D. Dahl-Jensen, S.J. Johnsen, D.A. Fisher, R.M. Koerner, D. Raynaud, V. Lipenkov, K.K. Andersen, T. Blunier, S.O. Rasmussen, J.P. Steffensen, and A.M. Svensson. (2009). “Holocene thinning of the Greenland ice sheet”. Nature. 461. 385-8. 10.1038/nature08355.
Weißbach, S., A. Wegner, T. Opel, H. Oerter, B. M. Vinther and S. Kipfstuhl. “Spatial and temporal oxygen isotope variability in northern Greenland – implications for a new climate record over the past millennium”. Climate of the Past. 12, 171–188, 2016 www.clim-past.net/12/171/2016/ doi:10.5194/cp-12-171-2016.
Williams, R.S., Jr., and Ferrigno, J.G., eds., 2012. “State of the Earth’s cryosphere at the beginning of the 21st century–Glaciers, global snow cover, floating ice, and permafrost and periglacial environments: U.S. Geological Survey Professional Paper 1386–A”. 546 p. (Also available at https://pubs.usgs.gov/pp/p1386a.) Glaciers.
Yau, Audrey M., Michael L. Bender, Alexander Robinson, Edward J. Brook. “Last interglacial in the GISP2 Greenland ice core”. Proceedings of the National Academy of Sciences. Aug 2016, 113 (35) 9710-9715; DOI: 10.1073/pnas.1524766113
https://gracefo.jpl.nasa.gov/resources/33/greenland-ice-loss-2002-2016/
“Research based on observations from the NASA/German Aerospace Center’s twin Gravity Recovery and Climate Experiment (GRACE) satellites indicates that between 2002 and 2016, Greenland shed approximately 280 gigatons (aka billions) of ice per year, causing global sea level to rise by 0.03 inches (0.8 millimeters) per year”
0.8 mm/y out of the current SLR of 3.0 mm/y or 11.8” PER CENTURY!!
https://en.wikipedia.org/wiki/Greenland_ice_sheet
“Analysis of gravity data from GRACE satellites indicates that the Greenland ice sheet lost approximately 2,900 Gt (0.1% of its total mass) between March 2002 and September 2012. The mean mass loss rate for 2008–2012 was 367 Gt/year.”
In the TEN YEARS between 2002 and 2012 Greenland lost 2,900 Gt which represented –
(0.1% of its total mass) (Yep, read the fine print.)
YES – AN ASTONISHING, NAY STAGGERING EVEN, ZERO POINT 1 PERCENT OF ITS TOTAL MASS!!!!!!!!
Are you effing kidding me? The uncertainty must be 10 times that much.
Who measures this crap and thinks the numbers have substance???
Probably those barely 20 millennials with their participation/entitlement PhDs.
Every year Greenland “loses” 500 Gt during the summer and gains it all back in the winter.
Don’t forget that the model-derived glacial isostatic adjustment (GIA) is often larger than the losses “measured” by GRACE.
Maybe so Nick, but whatever is happening in the Arctic, the media release will highlight that it’s still – “WORSE THAN WE THOUGHT!”
..the uncertainty is more likely over 100 times that much
There’s no such thing as uncertainty in climate science, we “know” what the problem is we are just having trouble proving it.
As soon as I see the blue “ocean contact discharge” line in figure , I know this is BS made up data. Clearly they have little of no data for the earlier half of the period and are just assuming it was flat. The later rise also fails to match coast guard reports so that’s probably based on model assumptions and fakes GAIA adjustments as well.
Left leaning scientists can’t do science anymore than the Dems can organise a caucus vote.
There is no problem and there is nothing to be done about that lack of a problem other than to try and create one. We have seen manipulation throughout history AND IT IS USUALLY TO THE DETRIMENT OF THE AVERAGE PERSON.
The certainty “same as it ever was” was evident in “Down & Out in Beverly Hills” starring three of the most outstanding weirdos Hollywood ever produced Dreyfuss, Nolte and Bette MIdler the latter a Gorebull Warming expert. Middleton love your depictions!!
Thank you, David. I saved these charts.
Would like to share two related works
https://tambonthongchai.com/2019/12/16/global-warming-melting-greenland/
https://tambonthongchai.com/2019/11/05/greenlandmelt/
The notion that more ice calving, with more bergs calving into the sea, proves that the ice sheet is melting is beyond silly, and betrays a fundamental lack of understanding of fluid mechanics, physics, and ice mechanics. Water ice is not a brittle or a stiff solid but, under the typical pressures imposed by a sheet thickness measured in hundreds and thousands of feet, literally flows like a highly viscous liquid, driven by gravity. The flows of ice are driven by differential terrain elevations and the rate of ice ADDITION upstream. Just as water with an open surface (not within a pressurized pipe) flows downhill, so does glacial ice.
The only means of accelerating the downward and outward flow of an ice sheet on elevated terrain terminating at the sea edge is to apply a higher potential energy to the upstream ice sheet due to increasing terrain elevation (generally not a significant factor absent an earthquake or vertical movement along a fault line) … or, practically speaking, by increasing the potential energy of the upstream ice sheet. And the latter only happens if the upstream ice sheet grows THICKER, not THINNER. The thicker upstream ice sheet provides the driving energy – or in hydrological terminology, the driving “head” – that causes accelerated ice flow into the sea.
Imagine a model of a land form with rising terrain in the interior, surrounded by water at constant elevation (called mean sea level). Start pouring chocolate sauce or motor oil on the center of the model. If you continue pouring the oil or sauce at a constant input rate, it will flow downhill and spread laterally until the leading edge reaches the sea and eventually reaches a steady state rate of flow into the sea. At that point measure both the elevation of the model where you are pouring the viscous fluid, and also measure the thickness of the fluid along its pathway to the sea. The profile of fluid surface elevations relative to model surface elevations defines its energy grade line.
The only way to increase the steady state flow rate of viscous fluid to the sea is to increase its upstream energy grade line. And that can happen only if either or both the surface elevation of the model is increased or the rate at which the fluid is added such that the thickness of the fluid layer, i.e. the energy grade line, is increased.
Until the “climate scientists” figure out how to repeal the laws of physics, they really need to shutup and stop embarrassing themselves with non-scientific stupid talk.
Good posting, David, and along comes Duane to describe a glacier system, to wit: a glacier that calves a lot of ice bergs is a healthy glacier system, that is, it is accumulating mass at the upper zone and maintaining a good flow-rate.
That’s reassuring. We wouldn’t want Greenland tipping over.
“That’s reassuring. We wouldn’t want Greenland tipping over.”
Hi Jeff, are you referring to Hank Johnston, his tragically low IQ and basic lack of understanding of….anything, and his inane question re Guam?
For those unfortunate enough not to have seen this astonishing moron ask the stupidest question in world history, put your coffee down and then watch this….
https://www.youtube.com/watch?v=cesSRfXqS1Q
Thanks Jeff, I had a mouthful of coffee, or cofefe, and damn near lost it. Cheers.
Do we have a good estimate, in Gigatonnes, of how much ice Greenland has? Are we talking about noise in the signal?
In short – yes. The uncertainty bar drowns the claimed effect measured.
Since when did uncertainty become data? Since the CO2 CAGW PsyOp swindle became the weapon of choice.
Nice chart by McKay
dave’s conclusion?
“The inescapable conclusion is that if there ever was a climate “crisis,” it was during the Little Ice Age… It was FRACKING cold! And it got pretty cold again in the 1970’s!”
what the authors say?
‘Finally, it should be noted that whereas these analyses are useful for quantifying some aspects of temperature sensitivity, they are poorly suited to determine the extent to which the records reflect long-term (centuries to millennia) changes in past temperature, or the stability of the modern relation back through time.”
of course THATS the conclusion of the authors, but its the last sentence in the piece so dave didnt read it
Basically This.
Like most skeptical posts the approach is hunt through the data to find stuff that supports your
conclusion. This means you have to AVOID reading the full article and understanding what was done.
And it works because most skeptics wont check the science you refer to.
GISP2. Now If this were a post by a REAL skeptic like Steve Mcintyre he would have plowed into all the
details and problems with ONE fricking data set.
That topic alone would be 10 posts. IF you were interested in understanding
But the goal here isnt understanding.
Thats why IPCC doesnt cite blog posts.
Steven, IPCC doesn’t cite anything that hasn’t been pre-filtered by ‘The Team’* to be supportive of ‘The Cause’*
* their terminology, as evidenced in the Climategate emails.
‘Finally, it should be noted that whereas these analyses are useful for quantifying some aspects of temperature sensitivity, they are poorly suited to determine the extent to which the records reflect long-term (centuries to millennia) changes in past temperature, or the stability of the modern relation back through time.”
Does not the same conclusion impact the ‘warmist’ certainties on predictions?
Hello David Hartley. Here is some work on the temperature sensitivity of Arctic sea ice extent and volume.
https://tambonthongchai.com/2019/11/07/precipitous-decline-in-arctic-sea-ice-volume/
https://tambonthongchai.com/2019/09/28/sea-ice-extent-area-1979-2018/
Thank you chaamjamal but that’s deflection surely. I read a lot of the points proposed on here and I’m aware of what you post. However it does not really address my question.
+1
“Thats why IPCC doesnt cite blog posts.”
Steven,
Wasn’t the IPCC audited and found to have used a significant amount of “gray” material?
IPCC cites non-science reports from $ billion companies like Greedpeace and WWF.
“Thats why IPCC doesnt cite blog posts.”
Instead they’ll cite papers that haven’t been published, or even ones that have been retracted. a blog post is probably better researched.
When their data conflicts with the authors’ opinions, I go with the data.
Precisely. Those who measure things and generate data are not the final judges of what it means. Even less so in today’s climate “science” where authors have to tack on some opinion that the data supports “the cause” or it won’t even be published. To say that you can’t cite to data in a paper without signing onto the opinions of the authors is as anti-science as It gets.
Its the “data” missing from the graph that shows where the real conflict lies.
What missing data?
Missing as in charts that end 20 years ago. I am pointing out that for example if the McKay & Kaufman, 2014 graph included the last 20 years of continued steep increases there would be a clearer indication of the anomalous modern warming.
Or the Kobashi et al graph or the other graphs that end in 1950. Opinions about the modern era warming formed without the benefit of the most of the “missing” modern data are conflicted.
Learn how to read. Kobashi ends in 1993. McKay & Kaufman is a PAGES 2k reconstruction (1 AD to 2000 AD).
There’s no missing data. Only your demented delusions are missing.
“Thats why IPCC doesn’t cite blog posts.”
The IPCC manufacture sensation in their reports, even from Wikipedia:
See details:
https://wattsupwiththat.com/2009/09/27/more-on-the-hanno-wikipedia-graph-in-the-un-climate-report/
@Mosher
You are critical of David’s use of the McKay-Kaufman paper because of this disclaimer, added to the very end of the paper:
But can you explain why the authors did not make it clear why they should not be used for analyzing “long-term changes in past temp” or its temporal “stability” [i.e. robustness], except, perhaps, it might contradict other proxies, e.g. tree-rings. [Recall that calibrated temperatures cannot be ‘directly’ observed. All quantitative temperature measurements must necessarily involve a “proxy” of some kind (e.g. expansion of mercury in a calibrated glass capillary).]
In fact, the abstract of the paper can be viewed as an ‘open invitation’ to study long-term changes:
I believe the disclaimer was added to merely appease other, easily-offended, proxy practitioners. Otherwise the disclaimers should have been added to the paper stepwise, as the discussion unfolded.
“hunt through the data to find stuff that supports your conclusion”
The projection is strong with this one.
Another drive by.
chemman
Yes, but he did come to a full stop before driving away.
Thats why IPCC doesnt cite blog posts.
Oops . . . not quite.
“That’s why the IPCC doesnt cite [other] blog posts.”
There. Fixed.
Steven Mosher February 5, 2020 at 7:27 pm
– the affinity between
Like most skeptical posts the approach is hunt through the data to find stuff that supports scepticals conclusions. This means scepticals have to AVOID reading the full article and understanding what was done.
And it works because most skeptics wont check the science they refer to.
– and
Like most green believers posts the approach is hunt through the data to find stuff that supports green believers conclusions. This means green believers have to AVOID reading the full article and understanding what was done.
And it works because most green believers wont check the science they refer to.
– is evident.
What is the aim of such meaningless vacuous bland exchangeable small talk.
A question which has always fascinated me and it applied to both polar regions; what is the age of the glacial age that is leading to the creation of the icebergs. For a start the problem is that each of the deep core holes that have been drilled are located in areas where there is no movement – other wise the drill stem would have sheared off many times during the coring process.
With the oldest ice around 432,000 yrs BP in Greenland and at least twice as old in Antarctica then this is a fair question.
Does anybody know?
The ice at the outboard edges tends to be either so deformed that it can’t be geologically dated or from the Holocene.
The volume of Holocene ice appears to be similar to the volume of ice.from the last Pleistocene glacial stage.
Note the curvature over the bathtub rim. It is not an indication of the bathtub overall but rim conditions alone.
Dave,
Here’s another cool image. Check out the multiple fracture orientations and they are not only on the edges. Looks like they are propagating up from the underlying layers. What is the age and composition?
https://imgur.com/a/MnBsyLK
Is this a lab practical? 😎
“other wise the drill stem would have sheared off many times during the coring process”
Ice moves very slowly.
Beyond that, you are concerned about the difference in velocity between the top of the glacier and the bottom. In most cases, top, bottom and all layers in between are moving pretty much in the same direction, just different velocities.
MarkW
You said, “… and all layers in between are moving pretty much in the same direction, just different velocities.” Not quite. The surface ice will tend to be moving radially away from the center of maximum accumulation. Near the edges, the ice will tend to be moving roughly parallel, and normal to the coastline, albeit with different vertical velocities as the ice shears over the uneven basal terrain. In the interior of the Greenland basin, the Eemain is probably stagnant and not having any particular direction, with ice above tending to shear over the deep ice in the basin.
The Kobashi reconstruction (Fig. 7c.) echos the temperature record for Nuuk the oldest meteorological station on Greenland:
http://www.climate4you.com/images/NuukGreenlandAirTempSince1866.gif
(climate4you).
Yep. It also matches up pretty well with an average of all of the long record length stations in the region.
Even using the volcanic activity affected changes in the GRACE/PIOMAS construction,
this is what a graph of Greenland’s Total Ice Mass since 1900 would look like.
At the present minimal rate of melting we will be into another glaciation well before any significant melt of the GIS.
David
International Ice Patrol? Here is some rare British pathe news reel of this patrol from 1922
“Full titles read: “To Prevent Repetition Titanic Disaster – Ice “Patrol” now finds & warns all vessels of location of Icebergs brought down by abnormal heat from Greenland Coast.”
https://www.britishpathe.com/video/ice-patrol-aka-to-prevent-repetition-titanic-disas
Abnormal heat? Yes, starting around 1908. In my local church is a plaque to a local dignitary who died on the Titanic. Right next to is a plaque to the first Arctic scientist Scoresby, who also lived locally who was asked by the Royal Society in 1818 to investigate the ‘unprecedented melting’ of the arctic in 1818. The sea was open to 84 degrees north which is as far as the expedition went but they wrote that had there been the time and stores they believe the way was open o the North Pole itself.
tonyb
David
Further to my comment above, here is the reference to the previous melting
I wrote this article a scary 10 years ago showing that in 1817 it was completely ice free to the 84 th degree and it was only logistics and supplies that stopped the British whalers and expedition from exploring any further north and reaching the pole
Contemporary reports from the time include the following 1817 book;
http://books.google.co.uk/books?id=EpwSAAAAYAAJ&dq=illustrations+of+greenland+1817&printsec=frontcover&source=bl&ots=3cjiizphFa&sig=nFNcBtJE-Bv3DDAf9U4lK2Y-JYg&hl=en&ei=1eEySpGRB4iZjAeItuyBCg&sa=X&oi=book_result&ct=result&resnum=1
“We learn that a vessel is to be fitted out by Government for the purpose of attempting again the north-west passage, the season being considered as peculiarly favourable to such an expedition. Our readers need not be informed that larger masses of ice than ever were before known have this year been seen floating in the Atlantic, and that from their magnitude and solidity, they reached even the fortieth latitude before they were melted into a fluid state.
From an examination of the Greenland captains, it has been found that owing to some convulsions of nature , the sea was more open and more free from compact ice than in any former voyage they ever made: that several ships actually reached the eighty-fourth degree of latitude, in which no ice whatever was found; that for the first time for 400 years, vessels penetrated to the west coast of Greenland, and that they apprehended no obstacle to their even reaching the pole, if it had consisted with their duty to their employers to make the attempt.
This curious and important information has, we learn, induced the Royal Society to apply to ministers to renew the attempt of exploring a north-west passage as well as to give encouragement to fishing vessels to try how far northward they can reach , by dividing the bounty to be given, on the actual discovery, into portions, as a reward for every degree beyond eighty-four that they shall penetrate For the same reason we think it would be advisable for the merchants engaged in the Greenland whale fishery not to postpone the sailing of their ships to the usual season but expedite them at once so as to take advantage”
Tonyb
Hi Tony
In trying to orient myself on the 84th parallel I found this island which is just south of the 84th.
https://en.m.wikipedia.org/wiki/Kaffeklubben_Island
In further effort to orient myself to the current location of sea Ice at the 84th parallel I found this. It appears (forgetting longitude) that the expedition found open water where in September, 2018 there was significant ice.
Do you agree with this conclusion?
Ceresco
That seems reasonable. Bear in mind that they could have got further north and also these reports had been made for at least a dozen years before an expedition was mounted. The reason that the royal society could not persuade the navy to release any ships earlier was apparently they were having a little local difficulty with some rebels further west.
Tonyb
That’s an interesting passage from the book. How would the fisherman prove how far north they got?
A sextant will tell you your latitude. (In the northern hemisphere it’s basically the elevation of the North Star above the horizon.)
But how did they “prove” it?
Geometry and trigonometry.
JMG, because in that region, you’re navigation was either correct or you were dead. They were still alive, therefore their navigation was correct.
Thank you very much. Every day we are subjected to “OMG, this is horrible” alarmist takes. Then along comes some context a few months later.
David
All these graphs and calculations and data look good, but have you run any of this passed Greta and Dave? Greta took time out of her busy school schedule so she could become an expert on world economics and stuff, so she needs to check your data.
We also need to make sure, “Using my Mark I eyeball” was calibrated to a NIST method 😉
So, no need to speculate on Greenland coastal real estate yet? Could probably fleece some greenies if one were morally flexible.
Even after this article and all the discussion, I still think Trump should buy Greenland.
Most Alarmists, I am guessing, look at a Mercator Projection map of Greenland.
It looks larger than Africa or South America. SCARY So much ice…..
NOW,, look at Greenland on a globe.
It is about the size of Saudi Arabia.
Greenland sank the Titanic yet Denmark was not sued.
It does show the power of icebergs and that iceberg calving has been happening for a long time. If Noah had been in the area of the Titanic he might have hit one.
Never thought of that before, but what happens to Greenland’s ice cap when Greenland is completely covered in water. Same for the Antarctic, just bigger.
Just above the “YAWN!” graphic, should it not read “6.5 m * 0.82% = 0.0531 m, rather than 6.5 m * 0.18% = 0.0531m?
No. It is correct as presented.
David Middleton February 6, 2020 at 4:14 pm
No. It is correct as presented.
No it isn’t, ‘stonehenge’ is right, it should be 100-99.18= 0.82%
I see the typo now. I was looking at the result of the equation, not the input.
Global warming scaremongers like to take cruises along the Greenland coast in June and July, and watch icebergs break off the edge of the ice cap in the sun, then they make predictions that the ice cap will be gone in X years.
They are nowhere to be seen in October through February, when most of Greenland is dark 24 hours a day, and frigid blizzards pile snow back onto the Greenland ice cap. Like the proverbial tree falling in the forest, the blizzards still occur even if no one is watching.
Satellite observations of sea ice show that the ocean between the east coast of Greenland and the west coast of Scandinavia remains ice-free most of the winter due to the Gulf Stream. Much like the nor’easters that track off the east coast of the United States in winter, storms tend to follow the sharp temperature gradient between the Greenland ice cap and the warmer open water to the east, and the counterclockwise circulation around the storms tends to evaporate ocean water and precipitate it over the Greenland ice cap as heavy snow.
In response to Mark W’s comment, there is a mountain range near most of Greenland’s coast that encloses the Greenland ice cap. Even if the Greenland ice cap were to completely melt, some of the water would escape through low points in the mountain range, but most of it would be captive as large inland lake some 1,500 meters above sea level, and would not contribute to sea level rise of the major oceans.
Why do you put, ” there is a general science consensus) when there is no such thing as a concensus in science!
There are many scientific consensuses. It’s a real thing. Consensus doesn’t mean that the science is right. It just means that there is a consensus.
Wish I could remember where I read this many months ago, but in the Antarctic some ice calving is due to the fact that as more snow falls and freezes the weight of the snow pack increases. This weight causes friction at its bottom creating heat and subsequently ice melting near the bottom. The iceberg can then slide and calve. Pretty simple, I thought. Might the same be happening in Greenland which has much more precipitation than Antarctica?
David
Thanks for the link to the story about Glacier Girl. It was “damn interesting,” as promised.
A new study finds that Greenland was 4-5 degC warmer than today 9000 years ago, when the Arctic was nearly ice-free.
https://notrickszone.com/2020/02/06/new-study-greenland-was-4-5-c-warmer-than-today-9000-years-ago-when-the-arctic-was-nearly-sea-ice-free/